Urban Traffic Accident Frequency Modeling: An Improved Spatial Matrix Construction Method
Abstract
Spatial correlation is a critical factor in establishing accurate traffic accident analysis models, with the choice of measurement method significantly influencing the results. Despite the central role of roads as the primary conduit for traffic flow and a direct exposure variable in accidents, their impact on spatial correlation in accident analysis has not been fully explored. This study introduces an innovative spatial correlation matrix, termed the road matrix, which incorporates shared road lengths between grids to enhance accident prediction accuracy. The model examines the relationship between traffic accidents and various predictor variables, including land use, road networks, and public transportation facilities. Compared to traditional spatial correlation methods such as the rook and queen matrices, the road matrix provides a more precise characterization of spatial dependencies and significantly improves accident frequency estimation. Notably, the application of the road matrix within a conditional autoregressive (CAR) model uncovers additional significant contributors to traffic accidents, such as the number of interchanges and the length of nonexpress arterial roads. These findings offer new insights and practical recommendations for urban planning and traffic safety management. The study provides a valuable reference for future research on traffic accident frequencies and offers guidance for the design of more effective traffic safety measures.
1. Introduction
Traffic accident frequency modeling, as an important research direction in traffic safety planning and management, is to investigate the distribution law, development trend, and influencing factors of traffic accident frequency. The research on the influencing factors of traffic accidents helps to improve the traffic safety planning scheme and formulate accurate and effective mitigation measures.
This study addresses two primary objectives: (1) Improving prediction accuracy: One of the key motivations of this research is to enhance the predictive accuracy of traffic accident frequency models by introducing a novel spatial correlation matrix, the road matrix. Traditional methods such as the rook and queen matrices do not account for road connectivity between grids and rely only on geographic adjacency, which can limit the accuracy of traffic accident predictions. The road matrix overcomes this limitation by considering the shared road lengths between grids, leading to a more accurate representation of spatial dependencies and improved accident frequency estimation. (2). Understanding the influence of specific factors: In addition to improving prediction accuracy, this study also aims to better understand the influence of various factors on traffic accidents. By incorporating variables such as land use, road network characteristics, and public transportation facilities, the study explores how these factors contribute to traffic accident frequencies. This analysis offers valuable insights for urban planners and policymakers to identify critical risk factors and design more effective traffic safety interventions.
There have been many studies exploring modeling methods of traffic accident frequency, for example, the Poisson regression model, Poisson lognormal model [1, 2], and negative binomial regression model. However, these models all assume that traffic accident data are spatially independent, which is contrary to the fact that traffic accident data are spatially correlated. In order to solve this problem, in recent years, some scholars have proposed to construct a Bayesian model considering spatial correlation. Aguero and Jovanis [1] estimated accident frequencies in Pennsylvania, USA, comparing the use of a fully Bayesian hierarchical model with spatiotemporal effects and spatiotemporal interactions with a traditional negative binomial model. The results reveal the existence of spatial correlations in crash data and point out the importance of spatial correlations and spatiotemporal interactions for accident frequency prediction. Siddiqui, Abdel-Aty, and Choi [3] applied a Bayesian model to analyze the traffic accident crash frequency data in the traffic analysis area and found that the Bayesian model with spatial correlation performed better than the model that did not account for spatial correlations. Liu and Sharma [4] use multivariate space structure, multivariate time structure, and multivariate time and space interaction structure to explain the spatial correlation between traffic accident frequency and influencing factors. These studies have shown the importance of spatial correlation in road traffic accident frequency models. Therefore, appropriate methods should be used to consider the impact of spatial correlation between regions on the frequency of accidents.
The division of traffic areas is one of the important research directions of accident spatial correlation. In the past decade, various zone systems have been explored from different studies. These zone systems divide the urban area into different units from the perspective of different purposes. For example, the block groups [5] and census tracks [6, 7] focus on the population statistics data and divide urban areas according to the distribution of population, traffic analysis zones (TAZs) [3, 8–10] and traffic analysis districts (TADs) [11, 12]are delineated for the long-term transportation plan, and ZIP code areas [13] are based on the administrative area. However, there is an inadequacy in these zone systems, that is, the number of units, aggregation level, and partition configuration of different zone systems in the same area may be very different. Thus, another type of zone system based on the grid structure is built to overcome such issues. Among them, Kim, Brunner, and Yamashita [14] explored a unified grid structure to analyze the influence of different land use, population size, and economic activity on traffic accidents. Loidl et al. [15] used hexagonal and square grids to calculate crash rates aggregated at different levels of bicycle crash risk and noted that grids can better represent spatial and statistical distributions. Amoh-Gyimah, Saberi, and Sarvi [16] investigated the effect of variations in six spatial units (e.g., girds and Thiessen polygons) on spatial heterogeneity not observed in collision models. It is found that using the grid unit as the analysis unit can reduce the adverse effect of spatial heterogeneity on the analysis results.
In addition, how to define the spatial weight matrix is the key to spatial correlation modeling and model prediction effect. Most previous studies have deployed a first-order adjacency structure of 0–1 between spatial units. That is, when two regions are adjacent, the adjacency index is equal to 1, otherwise the adjacency index is equal to 0 [3, 13, 17, 18]. Aguero-Valverde and Jovanis [1] proposed a spatial weight construction method based on network topology. Dong et al. [19] compared the four types of spatial weighted matrix (i.e., 0-1 first-order adjacency, common boundary length, geometry-centroid distance, and crash-weighted centroid distance) and confirmed the existence of a spatial correlation between different zones in crash occurrence. Wang and Feng [20] developed Bayesian conditional autoregressive (CAR) models with seven different spatial weight features (i.e., 0-1 first-order adjacency, common boundary length, geometric centroid distance–based, crash-weighted centroid distance, land use type, land use intensity, and geometric centroid-distance-order).The results show that the geometric centroid-distance-order spatial weight matrix outperforms all other spatial weight features. Zou, Wang, and Zhang [21] adopted a colocation quotient to construct a spatial weight matrix to study potential spatial correlations between vehicle collisions. From the above literature, we can find that the definition of the spatial correlation matrix is of great significance to the accident analysis results. For different areas in the city, from the perspective of traffic, roads are the link between various areas. However, the previous research on spatial correlation ignores the consideration of the road connection relationship between different grids. As the direct carrier of traffic flow between accident analysis units and the direct exposure variable of traffic accidents, the important influence of road on the spatial correlation in the traffic accident analysis has not been fully revealed.
To this end, from the perspective of cross-zone road connection at the grid level, this paper aims to explore a novel spatial weight matrix that takes into account shared roads between grids to improve the accident frequency estimation. We define a new spatial weight matrix based on the shared road connection relationship between different grids and explore the effect of land use, road network, and public transportation facilities factors on traffic accidents. For convenience, the new spatial weight matrix proposed in this paper is named the road matrix. Compared to traditional methods such as the rook and queen matrices, the road matrix incorporates shared road length between grids, which allows for a more accurate representation of spatial dependencies. This is particularly advantageous in urban environments with complex road networks, where geographic adjacency alone does not sufficiently capture the spatial relationships that influence traffic accidents.
The remainder of the paper is organized as follows. Section 2 describes the data adopted and the preprocessing method in this study. Section 3 introduces the modeling method of the road matrix. Section 4 presents the estimation results and the influencing factor analysis. Section 5 concludes the study and proposes future research directions.
2. Data Description
2.1. Research Domain and Grid Division
For this study, Shenzhen, one of the largest cities in South China, is selected as our research domain to analyze the accident-influencing factors. The research domain covers the entire municipality of Shenzhen, including 10 administrative districts. Urban land use is characterized by a high degree of diversity. There are various types of land use in various regions, such as urban villages, scientific, educational and cultural centers, commercial centers, and logistics centers. The high degree of mixing and large development intensity of land use in Shenzhen provides a good opportunity to carry out modeling research on the impact of urban land use on traffic accident frequency.
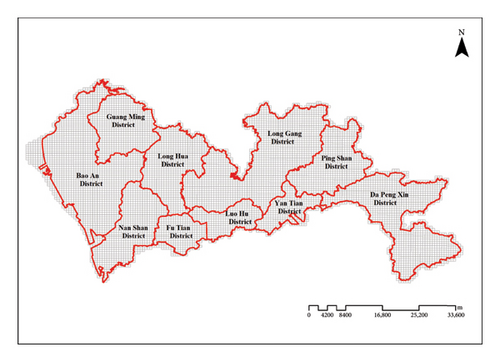
In previous research on grid structure division, 100-m-scale grids are usually used to aggregate high-resolution multisource heterogeneous data [22–24]. In this study, we divide Shenzhen into multiple grids of 500 × 500 m. Based on the projected coordinate system, ArcGIS software is applied to divide the geographic layer of Shenzhen with 500-m grids, and a total of 8650 grids are obtained, as shown in Figure 1. These grids are used as the basic spatial analysis unit of this paper.
2.2. Urban Traffic Accident Data
The traffic accident data for this study come from the accident alarm data in the database of the Shenzhen Municipal Transportation Commission. The traffic accident data from January 2019 to June 2019 were selected for this study, and a total of 89,525 road accidents were recorded. For each accident, information such as time, latitude, longitude, accident type, and property damage is given. Table 1 presents the distribution of accidents in each month from January 2019 to June 2019. The frequency of accidents in February was significantly lower than that in other months because the proportion of the nonlocal population in Shenzhen was higher than that of the local population, and a large number of nonlocal people returned to their hometowns during the Spring Festival, resulting in a significant reduction in travel within the city.
| Time | Accident frequency | Proportion (%) |
|---|---|---|
| 2019.1 | 16,588 | 18.53 |
| 2019.2 | 6603 | 7.38 |
| 2019.3 | 17,194 | 19.21 |
| 2019.4 | 17,247 | 19.27 |
| 2019.5 | 16,791 | 18.76 |
| 2019.6 | 15,102 | 16.87 |
2.3. Urban Land Use Data
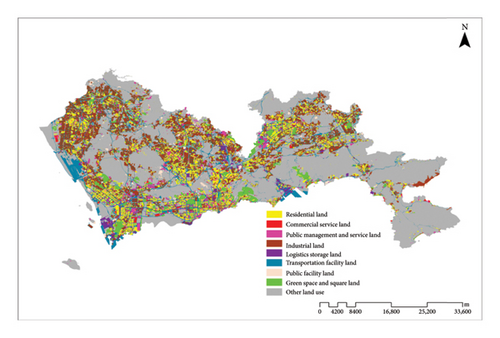
The land use data were obtained from the Shenzhen Municipal Planning and Natural Resources Bureau. The first-level classification of land use comprises the following nine categories: residential land, commercial service land, industrial land, transportation facility land, other land uses, logistics and storage land, green spaces and squares, and public facilities land. Figure 2 illustrates the current land use distribution in Shenzhen.
2.4. Road Network and Transportation Facility Data
As an exposure variable of traffic accidents, traffic facilities are an important factor affecting the frequency of traffic accidents in a region. Road network data (including national highways, provincial highways, express arterial roads, nonexpress arterial roads and other types of road data) are provided by the Shenzhen Municipal Bureau of Planning and Natural Resources. In addition, the road facility data (arterial road intersections, tunnels, overpasses, bus stops, and subway stations) are from the database of Shenzhen Urban Transportation Planning and Design Research Center.
2.5. Statistical Analysis of Data
In this paper, the ArcGIS software is applied to match the accident data with the regional grid to generate the statistical accident data of each grid. It is found that 3567 accidents could not be located due to the lack of coordinate data, and finally, 85,958 effective accidents are obtained. At the same time, we aggregated land use data, land use mix, and related data in transportation facilities (i.e., total road length, national road length, provincial road length, express arterial length, and nonexpress arterial length) into a grid. Among the 8650 grids generated, 6175 grids had total road lengths greater than 0, and 4207 grids had at least one traffic accident between January and June 2019. To ensure the accuracy of the model and avoid introducing noise, grids with zero road length and zero accidents were excluded from the analysis. These grids do not provide relevant information for predicting traffic accidents, and their inclusion could negatively impact the spatial relationships captured by the model. By focusing only on grids with road infrastructure and accidents, the model can better reflect the spatial dependencies and factors influencing traffic accidents. The data overview is shown in Table 2.
| Grid properties | Mean | S.D. | Min | Max | Total | Description |
|---|---|---|---|---|---|---|
| Traffic accident frequency | 13.92 | 26.27 | 0.00 | 297.00 | — | — |
| Land use | ||||||
| Land use mixture | 0.41 | 0.22 | 0.00 | 0.89 | — | — |
| Ratio of residential land | 0.07 | 0.205 | 0.00 | 1.00 | — | — |
| Ratio of commercial service land | 0.00 | 0.03 | 0.00 | 1.00 | — | — |
| Ratio of public management and service land | 0.07 | 0.15 | 0.00 | 0.99 | — | — |
| Ratio of industrial land | 0.17 | 0.22 | 0.00 | 1.00 | — | — |
| Ratio of transportation facilities land | 0.14 | 0.14 | 0.00 | 1.00 | — | — |
| Other | 0.43 | 0.35 | 0.00 | 1.00 | — | — |
| Road network | ||||||
| Total length of the road network | 1.57 | 1.08 | 0.00 | 9.11 | — | Unit: km |
| Length of national roads | 0.05 | 0.13 | 0.00 | 1.30 | — | Unit: km |
| Length of provincial roads | 0.06 | 0.16 | 0.00 | 1.20 | — | Unit: km |
| Length of express arterial roads | 0.05 | 0.14 | 0.00 | 1.01 | — | Unit: km |
| Length of nonexpress arterial roads | 0.05 | 0.25 | 0.00 | 3.00 | — | Unit: km |
| Total number of intersections | 0.13 | 0.39 | 0.00 | 6.00 | 784.00 | — |
| Number of tunnels | 0.01 | 0.10 | 0.00 | 2.00 | 62.00 | — |
| Number of interchanges | 0.02 | 0.15 | 0.00 | 2.00 | 138.00 | — |
| Public transportation facilities | ||||||
| Number of subway stations | 0.04 | 0.21 | 0.00 | 3.00 | 217.00 | — |
| Number of bus stops | 8.24 | 14.12 | 0.00 | 121.00 | 50,888.00 | — |
The spatial distribution of accident frequency in each grid is shown in Figure 3. Darker colors indicate a higher level of accident frequency in the grid. It can be seen that the accident frequency in Nanshan District, Luohu District, Longhua District, and Futian District is at a higher level. Figures 4, 5, and 6 illustrate the spatial distribution of Shenzhen’s road network, the spatial distribution of bus stations, and the spatial distribution of interchanges, subway stations, and intersections within the city’s grid, respectively.
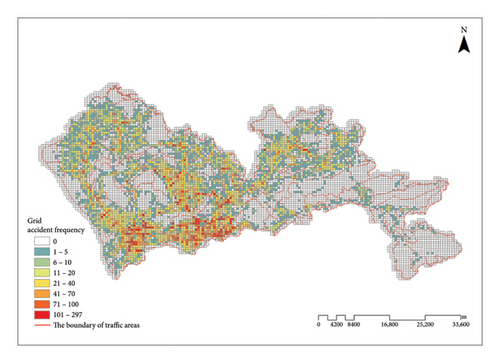
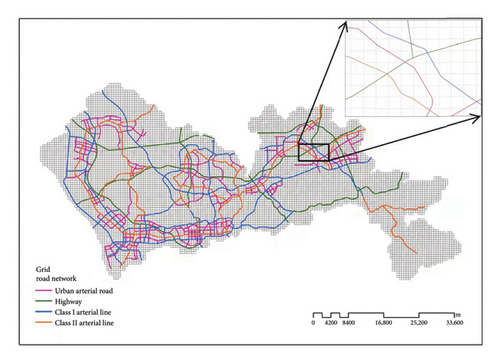
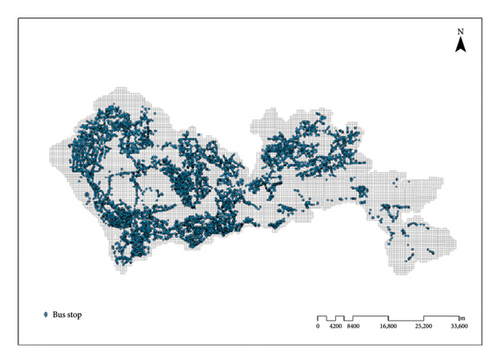
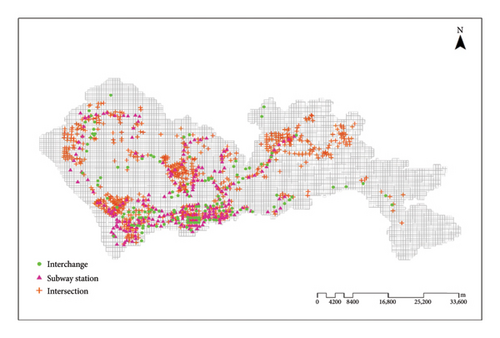
These Figures 3–6 clearly show that Shenzhen has a well-developed public transportation system. Among the 6175 grids, the average number of subway stations is 0.04, with a standard deviation of 0.21 and a maximum of 3.00. The average number of bus stations is 8.24, with a notably high standard deviation of 14.12 and a maximum of 121.00.
3. Modeling of Urban Traffic Accident Frequency Considering Shared Roads at the Grid Level
3.1. Spatial Model With CAR Priors
In the CAR model, the weights between each grid can be reconstructed into a n × n adjacency matrix W (W = {wij}). W is used to describe the spatial relationship between different grids, so it is also called the spatial weight matrix. Different spatial weight matrices selected by the same analysis method will eventually produce different results. Since traffic accidents are distributed on different grades of roads, whether two grids are spatial correlative is closely related to whether they have road connections. Motivated by this, in this paper, we propose a novel spatial correlation matrix (we call it the road matrix) to define the spatial correlation between grids from the perspective of the road connection relationship between grids.
3.2. Construction of “Road” Spatial Weight Matrix
The traditional spatial weight matrix can generally be divided into two categories: adjacency spatial weight matrix and distance spatial weight matrix [18].
For the distance spatial weight matrix, the neighborhood is determined based on the Euclidean or Manhattan distance between the centroids of the grid. If the distance between two centroids is within a specified threshold, the grids corresponding to the two centroids are adjacent [33].
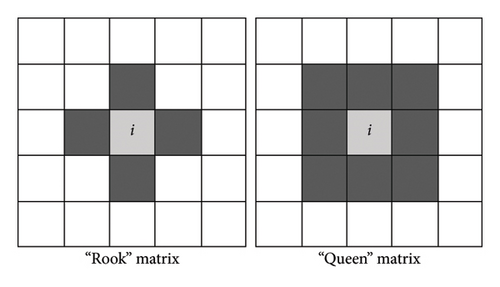
For the adjacency spatial weight matrix, it includes two types: the “rook” matrix and the “queen” matrix. For the “rook” matrix, if there exists a common boundary between grids i and j, then the adjacency relation between grids i and j can be defined as wij = 1. Otherwise, wij is defined as 0. For the “queen” matrix, on the basis of the “rook” matrix, if there exists a common point between grids i and j, then the value of wij is also equal to 1. Figure 7 depicts the adjacency relation between the grids in the “rook” and “queen” matrices. For grid i, only the gray-colored grids can be regarded as its neighbors. That is, the weight between the grid i and the gray-colored grid is set to 1( wij = 1), and for the other white-colored grids, the weight is set to 0 (wij = 0).
The weights for each road type used in equation (8) are derived from the data itself, based on the relative contribution of each road type to accident frequency across grids. This data-driven approach ensures that the model captures the actual influence of different road types on traffic accidents, allowing for a more accurate representation of spatial dependencies. The weighting process is dynamic, allowing the model to adjust the importance of each road type according to the specific traffic conditions in the study area. It is important to note that alternative weighting schemes could potentially influence the model’s outcomes. For example, overweighting expressways might lead to an overemphasis on high-speed segments, while underweighting arterial roads could reduce the model’s sensitivity to accident-prone areas with high-traffic volumes. Future research could explore the sensitivity of the model to different weighting schemes and evaluate how alternative methods might affect accident prediction accuracy and spatial correlation.
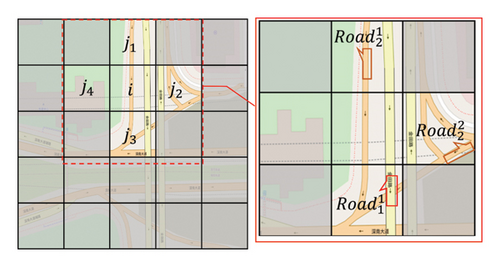
Figure.8 shows an example on how to generate weights between different grids in the “road” matrix. The urban area of Shenzhen is covered by multiple uniform grids, and these grids separate the original continuous roads of different types. That is, a same road will be shared by different grids. For example, there are two road types in the highlighted areas in Figure.6, and are shared by grids i and j1, is shared by grids j2 and j3, and grid j4 has no shared road with the other four grids.
4. Results and Discussion
4.1. Moran’s I Index Test
Table 3 presents the results of Moran’s I index test under different spatial weight matrices. All the Moran’s indexes are positive. From the p and Z values, it can be seen that the Moran’s I index test under the three spatial weight matrices has passed (p < 0.05, z > 1.96), indicating that the road matrix proposed in this paper can be modeled by the CAR model.
| Spatial weight matrix | Moran’s I index | p value | Z score |
|---|---|---|---|
| Rook matrix | 0.540 | 0.001 | 56.756 |
| Queen matrix | 0.485 | 0.001 | 71.511 |
| Road matrix | 0.816 | 0.001 | 141.899 |
4.2. Measures of Model Prediction Performance
4.2.1. Evaluation Indicators
4.2.2. Convergence Test
Before drawing conclusions from the model, it is necessary to evaluate the convergence of the samples. In principle, all parameters in the model should be checked. However, since this is impractical for a large number of random effects, a subset of parameters is often checked instead. Visual diagnostics can be performed on this subset, such as visualizing the sample parameters from multiple chains to assess convergence. Another commonly used method is to check the potential scale reduction factor (PSRF), where a value less than 1.1 indicates convergence. The PSRF test can be performed using the Gelman function in the R language.
Figures 9, 10, and 11 display the sample plots of the regression parameters for the intercept, land use mix, and residential land proportion under different matrices. Since the trends from left to right are minimal, indicating nearly identical means, this visually demonstrates good mixing and convergence between the chains.
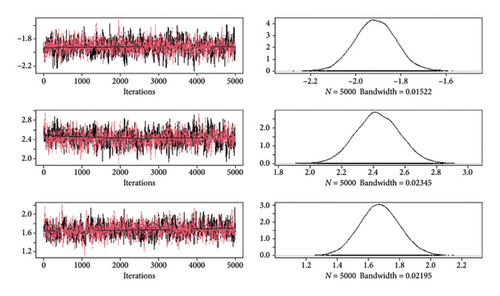
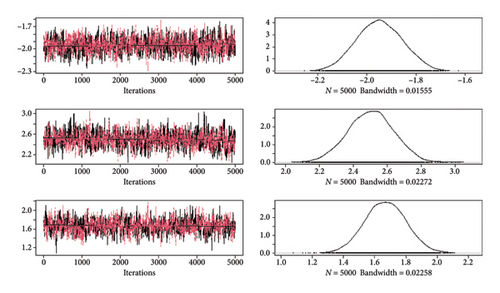
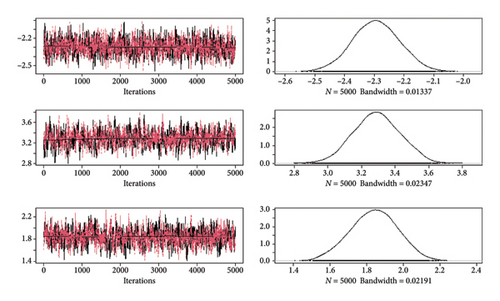
The results of the PSRF test are shown in Table 4. Since the PSRF values for the modeling results of the three spatial matrices are all below 1.1, it further confirms that using two chains in this experiment is sufficient for inference.
| Model | PSRF |
|---|---|
| Rook matrix | 1.03 |
| Queen matrix | 1.02 |
| Road matrix | 1.02 |
4.3. Estimation Results
Table 5 presents the parameter estimation results of the CAR model based on the rook, queen, and road spatial weight matrices. If the two extreme values of the parameter are greater than 0 in the 95% BCI, then the effect of the credible parameter on the frequency of grid traffic accidents is positive (i.e., gradually increasing). Similarly, if the two extreme values of the parameter are less than 0 in the 95% BCI, then the effect of the credible parameter on the frequency of grid traffic accidents is negative (i.e., gradually decreasing).
| Variables | Rook matrix | Queen matrix | Road matrix | ||||||
|---|---|---|---|---|---|---|---|---|---|
| Avg | BCI confidence interval | Avg | BCI confidence interval | Avg | BCI confidence interval | ||||
| 2.5% | 97.5% | 2.5% | 97.5% | 2.5% | 97.5% | ||||
| Intercept | −1.91 | −2.100 | −1.728 | −1.952 | −2.128 | −1.770 | −2.294 | −2.455 | −2.137 |
| Land use | |||||||||
| Land use mixture | 2.437 | 2.151 | 2.713 | 2.507 | 2.234 | 2.770 | 3.301 | 3.040 | 3.559 |
| Ratio of residential land | 1.669 | 1.429 | 1.936 | 1.667 | 1.406 | 1.920 | 1.838 | 1.580 | 2.091 |
| Ratio of commercial service land | 1.169 | 0.555 | 1.781 | 1.231 | 0.607 | 1.875 | 1.696 | 1.005 | 2.383 |
| Ratio of public management and service land | 0.063 | −0.356 | 0.466 | 0.041 | −0.367 | 0.464 | 0.041 | −0.403 | 0.459 |
| Ratio of industrial land | 1.636 | 1.453 | 1.825 | 1.669 | 1.464 | 1.860 | 1.540 | 1.361 | 1.718 |
| Ratio of transportation facilities land | 3.261 | 2.851 | 3.647 | 3.233 | 2.836 | 3653 | 2.683 | 2.318 | 3.038 |
| Road network | |||||||||
| Total length of the road network | 0.234 | 0.188 | 0.280 | 0.232 | 0.182 | 0.280 | 0.307 | 0.258 | 0.356 |
| Length of national roads | 0.298 | 0.052 | 0.559 | 0.337 | 0.089 | 0.604 | 0.331 | 0.065 | 0.589 |
| Length of provincial roads | 0.701 | 0.481 | 0.900 | 0.735 | 0.516 | 0.952 | 0.941 | 0.706 | 1.168 |
| Length of express arterial roads | 0.868 | 0.664 | 1.081 | 0.958 | 0.747 | 1.170 | 0.989 | 0.737 | 1.220 |
| Length of nonexpress arterial roads | 0.156 | −0.002 | 0.321 | 0.160 | −0.011 | 0.332 | 0.249 | 0.067 | 0.430 |
| Total number of intersections | 0.188 | 0.111 | 0.263 | 0.217 | 0.134 | 0.299 | 0.295 | 0.200 | 0.398 |
| Number of tunnels | 0.317 | 0.008 | 0.635 | 0.441 | 0.127 | 0.758 | 0.924 | 0.586 | 1.267 |
| Number of interchanges | −0.034 | −0.220 | 0.153 | −0.021 | −0.226 | 0.191 | 0.345 | 0.114 | 0.587 |
| Public transportation facilities | |||||||||
| Number of subway stations | 0.012 | −0.131 | 0.161 | −0.021 | −0.173 | 0.128 | 0.029 | −0.172 | 0.222 |
| Number of bus stops | 0.015 | 0.012 | 0.018 | 0.016 | 0.013 | 0.019 | 0.023 | 0.019 | 0.026 |
| τ2 | 2.088 | 1.968 | 2.217 | 4.641 | 4.374 | 4.914 | 1.326 | 1.242 | 1.413 |
| s | 0.972 | 0.951 | 0.986 | 0.956 | 0.918 | 0.981 | 0.127 | 0.081 | 0.182 |
| RMSE | 0.984 | 0.936 | 0.772 | ||||||
| SMAPE | 0.386 | 0.384 | 0.372 | ||||||
- Note: The bold values mean that this is the result of the method proposed in this paper.
It can be seen from Table 5 that the estimated spatial parameter s and the precision parameter τ2 of the three models are significant. Regarding the model prediction effect, both RMSE and SMAPE indicators show that the road matrix model proposed in this study is obviously superior to the rook and queen models. From the RMSE index, the prediction accuracy of the road model is 21.6% and 16.6% higher than that of the rook and queen models, respectively. Therefore, in terms of mining the spatial correlation of grid traffic accident frequency, the road matrix proposed in this paper has the best performance, and the queen matrix is slightly better than the rook matrix. This suggests that the spatial weight matrix accounting for the road connection between different grids would perform better.
In terms of the significance analysis of accident-influencing factors, the rook and queen matrix model analysis obtained the same significant and nonsignificant variables. The proportion of public management and service land, the length of nonexpress arterial roads, the number of interchanges, and the number of subway stations are all insignificant. However, in the estimation of the road matrix model, the two variables of nonexpress arterial road length and the number of interchanges are significant. For the number of interchanges, one possible explanation is that the road environment of the interchange ramp is complex, with the characteristics of frequent vehicle lane changes and large speed dispersion between vehicles, which leads to many traffic conflicts. Unreasonable interchange design will cause frequent accidents. For the nonexpress arterial road length, one possible explanation is that the traffic environment of nonexpress arterial roads is more complex, and more intersections lead to more traffic conflicts, which in turn lead to increased accident risk. Therefore, the estimation results of the three spatial weight matrix models show that when analyzing the impact of land use on the frequency of traffic accidents, the road matrix model can mine potential significant relationships that the other two matrix models cannot.
The estimation of land use admixture is consistent with the previous studies [35] that land use mixture is positively correlated with grid accident frequency. We can also find that among all the variables, the land use mixture has the highest estimated coefficient, indicating that it is a very important influencing factor of grid accident frequency. That is, regardless of the type of land use, the more the land use types, the more traffic activities in the area will increase, thereby increasing the frequency of accidents in the area. The large coefficients of the proportion of residential land and the proportion of commercial service land indicate that they have a relatively strong positive impact on grid accident frequency. The reason for this is related to people’s daily activities, that is, such land use areas may increase traffic activities, resulting in relatively more accidents. Commercial activities that often involve the use of large vehicles such as trucks for loading and unloading, which can obstruct the view of drivers, increase the chance of traffic conflicts and increase the likelihood of accidents on commercial service land. The conclusion on the proportion of industrial land is consistent with previous literature [36]. That is, it is positively correlated with grid accident frequency. Although areas with more industrial activity are considered to have fewer pedestrians, the proportion of large vehicles is higher, so it is necessary to implement corresponding large-vehicle safety measures on industrial sites. In addition, the proportion of transportation facility land has the most significant positive correlation with grid accident frequency, which is consistent with our expected results. This is due to the fact that the land of transportation facilities, as a direct exposure variable of traffic accidents, has more frequent traffic activities.
The relevant influencing factors of the road network and transportation facilities are discussed as follows. Different types of road lengths have a positive impact on the grid accident frequency, but the degree of impact is different. This phenomenon is consistent with the previous research [37]. We find that the length of provincial roads has a greater impact on grid accident frequency than the length of national roads. A plausible explanation is that provincial roads are generally in worse condition (i.e., poor road condition, poor sight instance, and poor traffic safety protection engineering), which in turn leads to an increase in traffic accidents. Therefore, we must pay more attention to the safety and life protection of roads with lower road levels. In addition, an increase in the number of arterial road intersections is associated with an increase in grid accident frequency, which increases the likelihood of accidents because intersections increase vehicle-to-vehicle interaction and introduce more stop-and-go actions. Therefore, it is necessary to develop a more rational scheme to organize and manage intersections, especially arterial road intersections. The number of bus stops has a positive impact on the frequency of grid accidents. This is because in the surrounding area of the bus station (including the adjacent upstream and downstream sections), in order to enter and exit the bus station, buses often take actions such as changing lanes, merging, accelerating, and decelerating. In addition, the traffic on the sections of high-density bus stations will often be disturbed by bus activities near the stations, resulting in more frequent and complex conflicts between buses and other traffic objects. Therefore, from the perspective of traffic safety, the distance between bus stops can be reasonably increased, and it is necessary to give priority to bus stops when implementing safety plans.
The spatial correlation analysis reveals significant spatial dependencies in traffic accident frequencies across the study area which are effectively captured by the road matrix. The spatial correlation between grids is measured by shared road lengths, leading to a more accurate representation of traffic accident patterns in densely populated and high-traffic areas.
- 1.
Major intersections and arterial roads: These locations, characterized by heavy traffic flow and complex road structures, demonstrate a high concentration of accidents. The road matrix captures the strong spatial correlation between adjacent grids in these areas due to significant road-sharing.
- 2.
Commercial and transportation hubs: Areas near public transportation facilities, such as bus stations and subway entrances, as well as commercial centers, show a strong spatial dependency. The mix of pedestrians, vehicles, and bicycles contributes to a high-accident frequency, and the road matrix effectively identifies this clustering.
- 3.
Urban hot spots: Specific regions with a high density of accidents, such as business districts and industrial zones, also exhibit strong spatial correlations. The road matrix reveals how accidents in one grid influence neighboring grids, enhancing our understanding of spatial accident clustering in these high-risk areas.
These findings underscore the ability of the road matrix to not only improve predictive accuracy but also to provide insights into the spatial clustering of accidents, especially in high-risk zones. The results suggest that areas with complex road networks and high-traffic volumes are more prone to spatially correlated accidents, offering valuable information for urban traffic safety planning. The overall results indicate that the proposed road matrix outperforms traditional spatial correlation methods and provides a clearer understanding of traffic accident distribution patterns.
4.4. Results of Model Comparison
4.4.1. Compared With Benchmark Methods
In this subsection, several benchmark models are tested and compared with the proposed models. Since the model constructed in this paper is based on the CAR model, the focus is on verifying the effect of incorporating the road matrix into the CAR model. Therefore, the selected models are all variants of the CAR model. The models chosen include the following: a model that considers spatial random effects [30], a model that accounts for hotspot information [20], and a model that incorporates public transport [38]. For convenience in the following discussion, we label these three models as Model 1, Model 2, and Model 3, respectively.
The comparison results are shown in Table 6. From the model comparison, the following findings are discussed.
| Models | RMSE | SMAPE |
|---|---|---|
| Model 1 | 1.054 | 0.618 |
| Model 2 | 0.985 | 0.512 |
| Model 3 | 1.254 | 0.687 |
| Proposed model | 0.772 | 0.372 |
- Note: The bold values mean that this is the result of the method proposed in this paper.
Overall, the proposed model outperforms the selected baseline models in terms of RMSE and SMAPE. This finding confirms the superiority and feasibility of the proposed model, which successfully captures the spatial and temporal characteristics of short-term collision risk predictors across the city. It also indirectly validates the effectiveness of the road matrix, a measurement method based on shared road length between grids, in better representing spatial dependencies. This provides valuable insights for future studies on the spatial correlation of traffic accident frequency. The road matrix outperforms traditional methods by effectively capturing the spatial relationships between grids based on shared road length, which provides a more accurate reflection of the road network’s impact on traffic accidents. While traditional adjacency-based matrices only consider geographic proximity, the road matrix acknowledges the actual traffic flow and connectivity between grids. However, this improvement comes with increased computational complexity, as calculating shared road lengths between grids requires additional processing time and resources. Future work could focus on optimizing this computational process to maintain the model’s accuracy while reducing complexity.
4.4.2. Compared With Different Size of Grids
This section conducts a sensitivity analysis to examine the impact of different grid resolutions on model performance by setting various grid sizes. The grid sizes are set to 300 × 300, 1000 × 1000, and 5000 × 5000 m, respectively. Table 7 presents the comparison results for the different grid sizes.
| Size of grids (m) | RMSE | SMAPE |
|---|---|---|
| 300 × 300 | 0.512 | 0.218 |
| 500 × 500 | 0.772 | 0.372 |
| 1000 × 1000 | 2.515 | 0.912 |
| 5000 × 5000 | 10.645 | 1.581 |
As shown in the data from Table 7, the impact of different grid sizes on model prediction performance is significant. With an increase in grid size, both RMSE and SMAPE exhibit a rising trend, reflecting a growing prediction error and a clear deterioration in model performance. When the grid size is set to 300 × 300 m, the model achieves an RMSE of 0.512 and a SMAPE of 0.218, indicating lower error and more accurate predictions. Smaller grids provide higher spatial resolution, allowing the model to capture local characteristics of traffic accidents, such as road intersections and accident-prone areas. This higher precision is suitable for scenarios requiring detailed predictions at a local level. However, despite the increased accuracy, smaller grids also result in a larger data volume and higher computational complexity due to the greater number of grids and denser data points. This can lead to higher computational costs, especially in large urban areas.
When the grid size is increased to 500 × 500 m, although the error increases compared to the 300 × 300 m grid, this grid size strikes a good balance between capturing local features and managing computational complexity. It may be more appropriate for scenarios requiring moderate accuracy and computational resources. As the grid size further expands to 1000 × 1000 m, the model performance significantly declines. This is because larger grids reduce spatial resolution, making it difficult for the model to capture local spatial variations, especially in high-accident areas where larger grids may combine regions with different characteristics, thus affecting prediction accuracy. For the 5000 × 5000 m grid, the prediction error is the highest. Although larger grids reduce the number of grids and the data volume, the spatial resolution is too low to capture the complex traffic patterns and localized risks within the city. In particular, microlevel characteristics of accident-prone areas are overly smoothed, leading to a significant deterioration in model performance.
From the above results, it is clear that grid size has a significant impact on model performance. Smaller grids can more accurately reflect the spatial distribution characteristics of traffic accidents, providing higher prediction accuracy but at the cost of higher computational complexity. Larger grids, while reducing computational load, may lose sensitivity to local features due to lower resolution, resulting in a substantial increase in prediction error. The model’s performance shows a clear declining trend with increasing grid size, indicating that selecting the appropriate grid size for traffic accident prediction using the grid method requires a trade-off between accuracy and computational efficiency.
5. Conclusion
This study proposes a novel spatial correlation matrix construction method, the road matrix, which considers shared roads between grids, and explores the association between traffic accidents and various predictor variables, including land use, road network, and public transportation facilities. The road matrix, which incorporates the length and type of shared roads between grids, has been proven to better characterize spatial dependencies and improve accident prediction accuracy. This provides a more reasonable approach to spatial correlation modeling compared to traditional methods, such as the rook and queen matrices.
The key innovation of this study lies in the development of the road matrix, which introduces a new way of capturing spatial dependencies by considering shared road connections between grids. This approach significantly enhances the performance of traffic accident frequency prediction models, as evidenced by its superior RMSE and SMAPE values compared to benchmark models. The study also provides important insights into the impact of land use and road network features on traffic accidents, particularly emphasizing the importance of considering transportation facility land in urban safety planning.
The proposed model has practical applications in urban traffic safety planning and management. By accurately predicting traffic accident frequencies and identifying critical contributing factors, the model can help urban planners and policymakers to design more effective traffic safety measures, optimize land use strategies, and improve transportation infrastructure planning. This is particularly relevant for fast-growing urban areas with complex road networks, such as Shenzhen.
There are several avenues for future research. First, while the road matrix enhances model accuracy, its computation is relatively complex, especially when applied to large urban areas with extensive road networks. Future studies could explore more efficient computational techniques or parallel processing to reduce the complexity. In addition, incorporating more dynamic and real-time data, such as traffic flow and speed data, could further improve the model’s prediction accuracy and robustness. Another promising direction would be applying this model to other cities to validate its generalizability and refine its adaptability to different urban environments.
In summary, this study provides a valuable contribution to the field of urban traffic accident prediction by developing a novel spatial correlation matrix, demonstrating its advantages over traditional models, and offering practical insights for improving urban traffic safety.
Conflicts of Interest
The authors declare no conflicts of interest.
Author Contributions
The authors confirm contribution to the paper as follows: study conception and design: Qing Su, Linheng Li, Linchao Li, and Yanni Ju; data collection: Jing Gan and Qing Su; analysis and interpretation of results: Qing Su and Linheng Li; draft manuscript preparation: Jing Gan, Linheng Li, and Yanni Ju. All authors reviewed the results and approved the final version of the manuscript.
Funding
This research was supported by the Intelligent Policing Key Laboratory of Sichuan Province ∗ ZNJW2024KFQN002 Natural Science Research Start-up Foundation of Recruiting Talents of Nanjing University of Posts and Telecommunications ∗ NY222030.
Acknowledgments
This research was supported by the Intelligent Policing Key Laboratory of Sichuan Province (Grant no. ZNJW2024KFQN002) and the Natural Science Research Start-up Foundation of Recruiting Talents of Nanjing University of Posts and Telecommunications (Grant no. NY222030).
Open Research
Data Availability Statement
The data that support the findings of this study are available from the corresponding author upon reasonable request.


