Optimization of Speed Limit Method for Freeways Considering AVs Under Rainy Weather
Abstract
Rainy weather significantly affects traffic efficiency and safety on freeways. This study investigates a safe speed limit model for freeways under rainy conditions, considering both human-driven vehicles (HVs) and automatic vehicles (AVs). The relationship between safe speed limits and rainfall intensity is quantified. The intelligent driver model (IDM) was selected as the basis for this study due to its complexity and applicability. By analyzing the effects of rainfall on model parameters, an improved IDM was proposed, optimizing the expected speed. Simulation results demonstrate that the proposed speed limit method effectively reduces collision rates, with AVs showing superior traffic efficiency, stability, and safety compared to HVs.
1. Introduction
Adverse weather conditions, such as rain, snow, and fog, pose significant challenges to freeway traffic operations, reducing road visibility and vehicle skid resistance. In the United States, a quarter of road accidents are weather-related, resulting in over 1.56 million incidents annually, with more than 60,000 injuries and nearly 7400 fatalities [1]. Reduced visibility due to bad weather is a major problem for drivers, leading to traffic accidents.
When dealing with bad weather, reduced visibility is a major problem faced by drivers. The consequent traffic accidents can be caused due to the bad visibility in human-driven conditions. With the development of automation technology, sensor technology, and communication technology, automatic vehicles (AVs) have emerged. AVs can drive smoothly and avoid traffic accidents by relying on information sharing and vehicle control. This is a good solution for bad weather bringing new solutions to transportation problems. Compared to human-driven vehicles (HVs), AV is considered to be able to improve traffic efficiency, reduce traffic accidents, and reduce energy consumption [2–4]. Connected AVs benefit from detection equipment on the road, roadside communication equipment, and their own sensors. On the one hand, they can obtain traffic flow status information on the road and share their own motion status. On the other hand, they can control their own vehicle movement trajectory.
The challenging driving environment of freeways during rainy weather reduces traffic efficiency and increases accident risks. Current speed limit measures for adverse weather primarily rely on variable speed limits based on rainfall levels and traffic conditions, which are often insensitive to changes in rainfall intensity and road conditions. Designing speed limitations based on rainfall intensity and road conditions is therefore crucial.
Although AV technology is mature, the lack of experimental data due to regulatory constraints means simulation software must be used to explore AV operations under various scenarios. This study proposes a freeway speed limit method for rainy weather and analyzes the traffic flow characteristics of HVs and AVs, providing important theoretical and practical insights.
2. Literature Review
2.1. Impact of Adverse Weather on Traffic Flow
Research on the impact of adverse weather on traffic flow mainly focuses on analyzing the impact of adverse weather on traffic safety and the impact on macrotraffic flow characteristics. Some scholars also study how to modify the parameters of the simulation model.
The severity of the impact of adverse weather on traffic safety can be qualitatively and quantitatively analyzed based on historical accident data. Ghasemzadeh et al. identified the influencing factors of crash severity in work areas under different space, time, and environmental conditions and found that weather and lighting conditions are one of the most important influencing factors [5]. Pennelly et al. used Canadian actual traffic collision data and related weather data, analyzed the relationship between severe weather and the number and severity of traffic accidents, and found that severe weather affects traffic conflicts in various ways [6]. Fior et al. quantified the impact of severe weather on vehicle safety based on the relationship between historical accident data and meteorological data in specific dangerous areas [7].
The operating efficiency of traffic flow decreases under bad weather, and changes in macroscopic traffic flow characteristics are manifested in reduced flow and speed. Zhang et al. quantitatively studied the impact of rainfall on traffic flow characteristics of urban freeways. The results showed that the Greenshields model is the most suitable macroscopic basic graph model for rainfall weather. Under light rain, moderate rain, and heavy rain, the road capacity decreases by 7.26%, 10.87%, and 17.09%, respectively, and the free flow velocity decreases by 3.07%, 5.29%, and 6.64%, respectively [8]. Rijavec et al. studied the impact of severe weather conditions on lane flow distribution and vehicle speeds in different lanes. The results showed that lane flow distribution and lane speed distribution at a specific location depend on weather conditions [9]. Ivanovic et al. introduced a method to analyze the impact of adverse weather on the urban transportation system, studied the changes in transportation demand and transportation supply characteristics caused by adverse weather, and quantified the impact of weather on the transportation system [10]. Roh et al. established a method based on a dummy variable regression model. The winter weather model was used to quantify the impact of snowfall and temperature changes on traffic flow in Alberta, Canada [11].
The revised simulation model can better describe the traffic flow characteristics under adverse weather conditions. Hammit et al. evaluated the driver’s car-following behavior in various adverse weather conditions (rain, snow, and fog) and calibrated the Gipps car-following model (Gipps model [GM]). The results showed that under different adverse weather conditions, there is an intradriver heterogeneity [12]. In order to effectively simulate traffic under snowy road conditions, Asamer et al. calibrated the car-following model parameters [13]. Gong et al. developed a mixed traffic cellular automaton model considering limited visual distance and explored the impact of visibility level and AV market penetration on traffic efficiency. The results showed that when visibility is low, the introduction of AV driving is conducive to improving the efficiency of mixed traffic. 100% AVs can increase traffic capacity by 182% in dense fog environments [14].
2.2. Freeway Traffic Flow Characteristics
Research on the characteristics of freeway traffic flow mainly focuses on the distribution model of traffic flow parameters. Some scholars also study the flow–speed–density basic diagram of traffic flow in different scenarios. Some scholars also focus on the flow, speed, and delay of traffic flow study of macroscopic characteristics.
The research on the distribution characteristics of traffic flow parameters under normal weather is relatively mature. In recent years, there have been more and more studies on the parameter distribution characteristics under bad weather. Based on actual observed traffic flow data on freeways, Wang et al. studied the probability distribution and cumulative probability distribution of microscopic traffic flow parameters (such as speed, acceleration, headway, and lateral offset) in rainy weather environments [15]. Wang et al. relied on freeway traffic flow and rainfall data to study the speed and density distribution of traffic flow under different rainfall conditions, thereby calibrating the speed and density distribution model of traffic flow in different rainy days [16]. Regarding the study of basic traffic flow diagrams, Guan et al. explored the basic speed–density relationship of urban freeways by analyzing the correlation between speed distribution and density. Regarding the research on the macroscopic characteristics of traffic flow [17], Yue et al. proposed a two-lane freeway vehicle microsimulation model to evaluate the delay, speed, flow, and density of the traffic flow. The experimental results verified the effectiveness of the model [18].
With the development of AVs, some scholars have analyzed and compared the differences in basic diagrams and macroscopic characteristics of AV and HV traffic flows, and some scholars have studied the improvement of traffic efficiency brought about by AVs.
Compared to HVs, the operating efficiency of AV traffic flow has been significantly improved. As the penetration rate of AV increases, its advantages in terms of traffic capacity, travel speed, delays, etc. will become more and more significant. In order to study the impact of commercial AVs on traffic flow, Shi et al. proposed a general method that combines empirical experiments and theoretical models. They used high-resolution trajectory data of multiple commercial AVs to conduct simulation experiments and found that the traditional basic diagram is still suitable for describing the traffic flow characteristics of AV traffic, and the road capacity is significantly improved [19]. Guo et al. considered the situation of vehicle on-ramp merging and off-ramp separation and studied the impact on mixed traffic flow as the market penetration of connected AVs increases [20]. Through VISSIM microsimulation, Beza et al. studied the impact of AVs and connected AVs on traffic capacity, average traffic speed, average travel time per vehicle, and average delay per vehicle. The simulation results show that under the 100% market penetration rate of the basic freeway section, the traffic rate of connected AVs has increased more than that of AVs [21]. Obai et al. studied the expected impact of AVs on road traffic parameters from a macrolevel. The traffic parameters studied include daily kilometers traveled, daily driving hours, daily total delay, and average driving speed of the road network [22], Alozi et al. employed the microsimulation of the Dubai Freeway section in the United Arab Emirates, and quantified the impact of AV penetration on the average delay, average speed, and total travel time of traffic flow [23]. Kavas et al. constructed AV and non-AV′s model based on simulation andstudied the impact of AV on the average speed and fluidity of traffic flow on the road [24].
2.3. Freeway Speed Limit Strategy
Research on freeway speed limit strategies focuses on variable speed limit control, combined with ramp and mainline control to improve traffic capacity.
Variable speed limits are the most common control strategy for freeways, and can achieve good results when combined with ramp control. In recent years, changes in visibility, road adhesion coefficient, etc. caused by adverse weather have been considered in speed limit strategies. In order to cooperatively control the traffic flow on ramps and mainlines, Carlson et al. proposed two types of variable speed limits (VSL) local mainstream traffic flow control (MTFC) feedback controllers. The results show that the feedback controller has satisfactory control behavior and is close to the optimal control result [25]. Jiang et al. studied the effectiveness of the weather response management strategy based on connected vehicles on freeway corridor safety issues under adverse weather through analysis, modeling and simulation. Among them, the emergency response management strategy based on connected vehicles was applied to forward collision warning, Three aspects advance lane change suggestions and variable speed limits [26]. Guo et al. proposed a variable speed limit control strategy under severe weather conditions. According to the impact of rainfall intensity under rainy conditions, visibility under foggy conditions, and road adhesion coefficient under snowy conditions on traffic capacity, severe weather conditions are determined. The results show that the variable speed limit control strategy under severe weather conditions effectively improves road traffic capacity and reduces vehicle driving risks [27]. Tian et al. studied the classification of severe weather and the identification of dangerous sections in Inner Mongolia, used the evaluation point method to calculate the risk value under adverse weather conditions, and proposed control measures such as traffic diversion, traffic organization, speed limit, and road closure [28].
3. Modeling
This study mainly proposes an improved car-following model based on dynamic safety speed limits. First, a safe distance model is derived based on the influence mechanism of safe speed limit and safe driving conditions. Based on this, a dynamic safe speed limit model on rainy days is proposed, and the reliability of the safe distance model and dynamic safe speed limit model is verified. Then, each model is compared and analyzed. To examine the advantages and disadvantages of the classic car-following model, the intelligent driver model (IDM model) was selected as the basic model, the IDM–improved car-following model was proposed, and the model parameters were optimized. Finally, based on the characteristics of HV and AV, a proposal was made for the expected speed in the IDM-improved model. Optimization.
3.1. Construction of the Dynamic Speed Limit Model on Rainy Days
The safe distance between vehicles directly determines driving safety. In rainy weather, the driver’s visual distance and the perception range of AV are affected. If the visual distance and perception range are smaller than the safe distance between vehicles, the vehicle may be affected by braking. Insufficient moving distance leads to traffic accidents. Therefore, safe driving distance should be considered when setting the safe speed limit on freeways in rainy days.
In rainy weather, as the rainfall intensity, friction coefficient, and the slope of the road where the vehicle is located change, the safe speed limit’s value will also change [29]. In order to ensure that the vehicle always drives safely, it needs to be based on the current rainfall intensity, friction coefficient, water film thickness, road visibility, etc., to calculate the safe speed limit value in real time, so that the safe speed limit value can dynamically adapt to changes in the driving environment.
In rainy weather, the visual distance of both manual and AVs will be affected. For manually driven vehicles, road visibility can be considered as the driver’s visual distance, that is, Sc = Sv, and the maximum value is 300 m. Generally speaking, when the rainfall intensity is relatively small, road visibility does not affect the driver’s safe driving speed. The safe driving speed depends on the following status and the road speed limit. However, when the rainfall intensity increases to a certain value, the vehicle’s visual distance will decrease, which directly affects the safe speed limit of the vehicle.
For AVs, the visual distance of the vehicle in rainy weather depends on the sensing distance of the sensor and communication equipment. First of all, for millimeter-wave radar, the performance will not be greatly affected. According to Table 1, the detection distance under normal circumstances is 250 m; second, for cameras, on rainy days, due to raindrops blocking the lens or interfering with imaging, there will be a larger high missing rate and low confidence, but the rain removal algorithm can be used to alleviate this situation. According to Table 1, under normal circumstances, the detection distance of the camera is 250 m. After the rain removal algorithm, its performance is almost unaffected [31]; again, for radar, rainfall has little impact on detection distance, but due to rain coverage, the solid surface is smooth, resulting in a reduction in reflectivity when the laser reaches obstacles and vehicle body surfaces, reducing to ensure the accuracy of the measurement; finally, for dedicated short range communications (DSRCs), Lee tested the performance of the vehicle-mounted DSRC on rainy days through real vehicle experiments, and the performance was stable and good within 150 feet [32].
| Grade | Rainfall intensity q (mm/min) | Rainfall level | HV | Autopilot | ||
|---|---|---|---|---|---|---|
| Sc (m) | vsafe (km/h) | Sc (m) | vsafe (km/h) | |||
| I | 0 < q ≤ 1.49 | Light/moderate rain | ≥ 200 | 93 ≤ vsafe < 120 | 200 | 110 ≤ vsafe < 120 |
| II | 1.49 < q ≤ 2.66 | Heavy rain | < 200 | 60 | 47.5 | 64.0 ≤ vsafe < 64.5 |
| III | 2.66 < q ≤ 4.74 | Rainstorm | < 100 | 40 | 47.5 | 63.3 ≤ vsafe < 64.0 |
| IV | q > 4.74 | Extremely heavy rain | < 50 | 20 | 47.5 | vsafe < 63.3 |
Generally speaking, cameras and millimeter-wave radar can capture obstacles and vehicle information even on rainym days and are almost unaffected by changes in rainfall intensity. Although lidar has some effects, it is feasible to use it as an information auxiliary means. The short-distance sensing performance of DSRC is very stable on rainy days. Therefore, through analysis, it can be seen that the sensing distance of an AV in light or moderate rain is determined by millimeter-wave radar, camera, and lidar. In order to ensure safety, it is set to 200 m. In heavy rain and heavy rain, the sensing distance depends on DSRC, set to 47.5 m.
According to the rainfall intensity, the relationship with road visibility is to further refine the existing rainfall levels, using the visual distance of 200, 100, and 50 m as the boundaries to find the rainfall intensity interval corresponding to each level. Among them, the transverse slope gradient is taken as 0.02°, and the longitudinal slope is taken as the most unfavorable case of −0.03°. The results are shown in Table 1.
Through analysis, it was found that AVs have a larger safe speed limit than HVs under any rainfall level.
For HVs, when there is light rain or moderate rain, that is, when the visual distance exceeds 200 m, a higher safe speed limit can be maintained, with a value range of 93–120 km/h. However, when the weather is heavy rain or heavy rain, that is, when the visual distance is less than 200 m, considering the restrictions of traffic regulations, its safe speed limit value drops sharply.
For AVs, when there is light rain or moderate rain, the vehicle’s visual distance is almost unaffected and can maintain the expected speed of 110–120 km/h. However, when the weather is heavy rain or heavy rain, the sensor and communication equipment are affected and the visual distance drops sharply, causing the expected speed to also drop sharply, but the expected speed can still be maintained at around 64 km/h.
In this model, “dynamic” is reflected in the adaptability to rainfall conditions and road geometric design. Specifically, the setting of the safe speed limit value of the freeway in this study should be determined based on the current rainfall intensity and road longitudinal slope, that is, the speed limit value under each rainfall intensity of each road section is changing, dynamically adapting to the longitudinal slope and rainfall intensity of the current road section.
3.2. Improvement of the IDM–Following Model
The microscopic driving dynamics of the vehicle are determined by the interaction of the car-following model, the intersection model, and the lane-changing model. Specifically, the car-following model determines the vehicle’s speed relative to the vehicle in front; the intersection model determines the vehicle’s behavior in terms of right-of-way rules, gap acceptance, and congestion avoidance at the intersection; and the lane-changing model determines the vehicle’s behavior on multilane roads, lane selection, and lane-changing speed adjustment.
This study chooses freeways as the road scene for research. The scope of road scenes is limited to freeway sections. The impact of on- and off-ramps on the mainline is not considered. The lane change selection is mainly free lane change, and because the freeway intersections are all in the form of interchanges, so there is no complex right-of-way issue of intersection conflict. Therefore, this study mainly improves the car-following model and uses a suitable car-following model to describe the microscopic driving behavior of vehicles in rainy freeway scenes.
In the expression of expected speed, the static safety distance s0 is only meaningful for slow-moving vehicles when the traffic flow is in a congested state; Tv means that in a stable traffic flow, the vehicle follows the vehicle in front with a constant safe headway. vΔv(2∗ab) is mainly suitable for unstable traffic flow. This item ensures that the vehicle can brake under any circumstances, even in emergency braking conditions. In order to make the model model more intuitive and easier to measure, this item is usually set to 0.
The IDM model after calibration using the traffic flow data of the Xi’an Freeway section under normal and rainy weather is shown in Table 2. By comparing the parameter changes under normal and rainy weather, it is found that rainfall has the most obvious impact on the expected speed, while the maximum acceleration, comfortable deceleration, and safe time interval change slightly. Therefore, it is considered that the expected speed is the main affected parameter, and the maximum acceleration, comfortable deceleration, and safe time interval are the secondary affected parameters. At the same time, the stationary safety distance is the distance between the vehicle and the vehicle in front when it is stationary, and it is considered to remain unchanged on rainy days.
| Weather | Maximum acceleration (m/s2) | Comfort deceleration (m/s2) | Safe interval (s) | Expected speed (m/s) |
|---|---|---|---|---|
| Normal weather | 6.23 | 0.8053 | 1.67 | 31.25 |
| Rainy weather | [4.40, 6.02] | [0.41, 1.31] | [1.93, 2.56] | [25, 30] |
This model is suitable for HV and AV car-following models; however, the parameters are not exactly the same. For maximum acceleration, comfortable deceleration, and safe time intervals, it can be considered as the impact of vehicle performance on rainy days. The parameter values of the two are the same, and the values change with the change in rainfall level.
However, the expected speeds of human and automatic car-following models are not the same. First, the main control body of artificially driven vehicles is human drivers, and human drivers vary in age, gender, driving experience, and other physiological characteristics, resulting in different driving habits between drivers, so there are differences between vehicles. Qualitatively, the expected speed should obey the normal distribution; and the control of AVs is completely based on intelligent algorithms, and the driving behavior is highly consistent [36]. Therefore, it can be considered that AVs belong to the same driving style. In the IDM model, expected speed is a constant value. Second, compared to HV, AV has a shorter reaction time and shorter reaction distance. Therefore, under the same rainfall intensity and visual distance conditions, the expected speed of AV is greater.
3.3. Improved Expected Speed Optimization of Car-Following Models
- 1.
The perceived delay of AV is consistent with the system delay. Vehicle-mounted sensors perceive obstacles in real time. At the moment of perception, information such as the position and speed of obstacles can be transmitted to the decision-making layer. The decision-making layer processes the information in real time and transmits it to the control layer. The delay error between vehicles is very small. This study assumes that the process from perception to control is processed based on the same decision-making algorithm, and all AV response delays are consistent.
- 2.
The measurement error of AV is not considered. The vehicle’s information about itself and the motion status of obstacles can be measured and fused in a variety of ways. This study assumes that the information obtained by the vehicle within its own detection range is accurate.
- 3.
The vehicle types in the model are all standard passenger cars. For the convenience of modeling, regardless of the difference in vehicle models, the traffic volume of manually driven vehicles is converted into the equivalent of a standard passenger car according to the conversion coefficient. It is considered that the dynamic performance of the AV is consistent with that of the manually driven vehicle and is also a standard passenger car.
3.3.1. Expected Speed Considering Driver Heterogeneity
In rainy weather, due to psychological and physiological differences, there are individual differences between drivers. Therefore, the expected speed is not a fixed value but conforms to a normal distribution [37]. To reflect the heterogeneity among drivers, modification of the expected speed in the car-following model should be considered.
- 1.
Initializing h clustering centers.
- 2.
Calculating the distance between each data object and the cluster center and performing clustering. Since the point velocity belongs to one-dimensional data, the Manhattan distance calculation formula is selected, that is, the absolute value of the difference between the sample value and the one-dimensional coordinates of the cluster center, represented as
() -
where d is the Manhattan distance (m), xi are the coordinates of the ith sample, and xj are the coordinates of the jth cluster center.
- 3.
Clustering and grouping the samples. It is assigned to the cluster corresponding to the nearest center point according to the distance between each sample and h cluster centers.
- (4)
Recalculating the cluster center based on the samples in the cluster group.
- (5)
Repeating the above steps and continuing iterating until the convergence condition is reached.
- 1.
If there are more cluster centers, that is, the larger the k value, the higher the degree of aggregation of each cluster, and the smaller the corresponding SSE value.
- 2.
When the k value is less than the optimal number of clustering groups, the degree of aggregation of each cluster increases faster; therefore, the SSE value decreases faster as the k value increases.
- 3.
When the k value is greater than the number of optimal clustering groups, the increase in the degree of aggregation of each cluster will decrease rapidly. Therefore, the SSE value decreases slightly as the k value increases and gradually levels off.
3.3.2. Expected Speed Considering AV’s Time Headway
The functions that can be achieved include using onboard sensors to detect the position of the vehicle ahead, using communication equipment to share information such as location and speed, and controlling vehicle movement trajectories in real time. This paper designs an expected speed optimization method based on the headway based on the vehicle’s motion status and on a rainy day, aiming to keep the driving speed of AV in the best state.
- 1.
The free state means that there are no other vehicles within a certain range in front of the lane where the vehicle is located, the driving state is not restricted, and the vehicle can drive freely on the road at the expected speed.
- 2.
The following state means that there are other vehicles in front of the vehicle in the lane, which restricts the driving state of the vehicle. The vehicle needs to adopt the corresponding speed based on the position, speed, and other information of the vehicles in front and behind.
- 3.
The braking state refers to a state in which the vehicle is following the vehicle in front and the vehicle in front suddenly decelerates or the speed difference between the front and rear vehicles is too large. In order to avoid a collision, the vehicle has to apply emergency braking.
- 1.
If the headway is equal to the headway t > tmax, the vehicle is in a free state
- 2.
If, then the vehicle is in the following state
- 3.
If t < tmin, the vehicle is in a braking state
In addition, when a vehicle is in a car-following state, in order to pursue the maximum driving speed, it often chooses to keep the desired time tdes distance. The driving status division of the vehicle is shown in Figure 1.

Vehicles will pursue driving with the highest efficiency under different motion states, that is, pursuing driving at the expected speed. However, in order to ensure driving safety, the expected speed cannot exceed the maximum speed. In rainy weather, the expected speed of the vehicle depends on the intensity of the rainfall, the vehicle’s following status, and the road design speed, which, respectively, correspond to the safe speed limit under the corresponding rainfall intensity VR and the maximum expected time distance in the following mode. The safe speed VF, road design speed VL, and expected speed should be based on the minimum of all speed limits.
- 1.
The vehicle detects the position of the vehicle in front based on the rainfall intensity and the sensing distance under the rainfall intensity. If the vehicle in front is not within the sensing distance, the vehicle is in a free state. VL The expected speed takes VR the smaller value of and. If the vehicle in front is within the sensing distance, we calculate the headway between your vehicle and the vehicle in front t.
- 2.
We determine whether the headway t is greater than the free critical headway tmax. If so, t > tmax, the vehicle is still in the free state. If so t < tmax, continue to compare with the braking critical headway.
- 3.
We determine t whether the headway is less than the critical braking headway. If t < tmin, the vehicle is in the braking state, VL and VF the expected speed is VR the minimum VF; if t > tmin, the vehicle is in the following state.
() -
where Vfo is the following vehicle speed (m/s) and Vld is the speed of the leading vehicle (m/s).
- 4.
When the vehicle is in the following state, it is judged whether the headway t reaches the expected headway tdes. If it has reached the expected headway, we return to the next calculation step. Otherwise, the expected speed of the vehicle VR is VL taken as VF minimum value.
3.4. Freeway Speed Limits on Rainy Days
Since the speed limit value lacks adaptability to changing rainfall intensity and road gradient, it cannot be dynamically adjusted according to objective driving conditions, resulting in reduced reliability of the speed limit value. In order to achieve refined management of freeway speed limits on rainy days, it is necessary to design speed limits for different road sections based on real-time rainfall intensity and road slope.
The freeway is divided into sections according to the longitudinal slope, as shown in Figure 2. The speed limit value of each section is different. Among them, the maximum speed limit is the design speed of 120 km/h, and the speed limit value should be 10 km/h, which is an integer multiple of the speed limit difference between two adjacent road sections, which should not be greater than 20 km/h.

- 1.
The freeway roadside system collects road information and weather information. Road information includes the location of each road section, lane width, slope, water film and thickness and weather information includes rainfall intensity and visibility.
- 2.
The central processing system receives the information sent by the roadside information collection system, calculates and processes it, and passes the decision to the roadside information release system.
- 3.
The roadside information release system transmits the road section speed limit value to vehicles through variable information boards, vehicle-mounted communication equipment, etc.
4. Simulation Results
This study mainly verifies the rainfall weather speed limit method based on the SUMO simulation platform and studies the traffic flow characteristics of HV and AV. First, we design the speed limit method for freeways on rainy days and propose speed limit value schemes for different rainfall intensities and longitudinal slopes; second, we build a simulation platform, design the simulation process, and calibrate model parameters; finally, we verify the safety and effectiveness of the speed limit method and analyze the traffic flow characteristics of HV and AV under this speed limit method.
4.1. Simulation results of the Speed Limiting Method
In order to verify the effectiveness of the speed limit method in improving traffic safety in rainy weather, simulation experiments need to be conducted to compare the safety of the speed limit scheme and the unlimited speed scheme. At the same time, in order to put forward reasonable safe speed limit recommendations for freeways in rainy weather, simulation experiments are needed to analyze how to set reasonable speed limit values under different longitudinal slopes and different rainfall intensities.
4.1.1. Effectiveness of Rate Limiting Methods
Simulation experiments are used to verify the effectiveness of the speed limit method in improving traffic safety in rainy weather. The detection section of Hangzhou Xifu Freeway is selected as the scene. This section is the mainline of the freeway, with a total length of 1.5 km, a design speed of 100 km/h, two-way 6 lanes, and a lane width of 3.75 m. According to the road segment division standards in Section 2.1, the radius of the flat curves in this section is greater than 1000 m and can be regarded as a straight section. According to the longitudinal slope, the section is divided into three sections. The section length and longitudinal slope are shown in Table 3.
In this simulation scenario, the freeway is designed as a two-way 6-lane freeway with a lane width of 3.75 m and a cross-slope gradient of 0.02°. The simulation takes 4000 s with a warm-up time of 400 s. In order to simulate the rapid changes in rainfall weather, the rainfall intensity of the three road sections is set to increase sequentially, namely, q1, q2, and q3. The speed limit value of each road section is calculated according to the rainy day freeway speed limit method, and the three road sections can be obtained the speed limit values are V1, V2, and V3, respectively. The specific values are shown in Table 4.
| Serial number | Rainfall intensity (mm/min) | Speed limit value (km/h) | ||||
|---|---|---|---|---|---|---|
| q1 | q2 | q3 | V1 | V2 | V3 | |
| Experiment 1 | 0.9 | 1.0 | 1.1 | 100 | 100 | 90 |
| Experiment 2 | 1.4 | 1.5 | 1.6 | 80 | 60 | 60 |
| Experiment 3 | 1.9 | 2.0 | 2.1 | 60 | 60 | 60 |
The purpose of implementing speed limits in rainy weather is to improve traffic safety, so it is necessary to conduct simulation experiments on the proposed speed limit method, and then comparatively analyze the safety of traffic flow before and after the speed limit. The time-to-collision (TTC) model is a classic conflict measurement index, which is defined as the time it takes for the vehicle and the leading vehicle to maintain the original speed difference at a certain moment until a collision occurs. Therefore, it is more reasonable to use TTC as the evaluation index of traffic safety.
This paper chooses collision time as the safety evaluation index. When TTC > 0, it means there may be a collision risk, when TTC ≤ 0, it means that there is no collision risk and the vehicle’s following distance is getting larger and larger. The TTC threshold for traditional vehicles is 3 s, and when TTC is less than this value, it means that the vehicle conflicts. Therefore, this paper takes the TTC threshold as 3 s, that is, at that time, the vehicle is considered to be at risk of conflict. TTC ≤ 3
Through the simulation experiment, the sum of the number of conflicts of all step sizes was calculated to compare the number of traffic conflicts and the conflict rate under the speed limit and unlimited speed conditions on rainy freeways. The results are shown in Table 5. Statistics found that in the three experiments, compared to the unlimited speed measure, the conflict rate of the speed limit scheme dropped by 7.1%, 73.6%, and 82.4%, respectively. The results show that the speed limit method on freeways in rainy weather has a significant effect, and the number of conflicts and the conflict rate have dropped significantly, indicating that this speed limit method can effectively reduce conflicts on freeways in rainy weather.
| Serial number | Conflict (times) | Conflict rate (%) | ||
|---|---|---|---|---|
| Unlimited speed | Speed limit | Unlimited speed | Speed limit | |
| Experiment 1 | 14,408 | 13,436 | 2.82 | 2.62 |
| Experiment 2 | 14,532 | 4396 | 2.84 | 0.75 |
| Experiment 3 | 18,724 | 3848 | 3.58 | 0.63 |
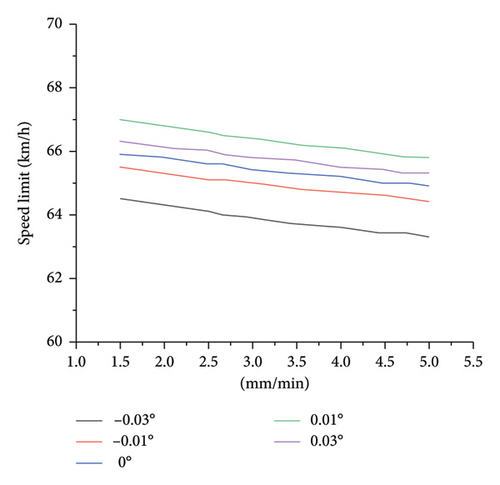
4.1.2. Speed Limit Value Sensitivity
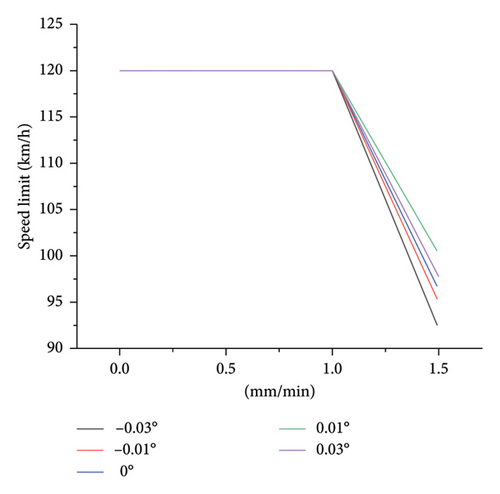
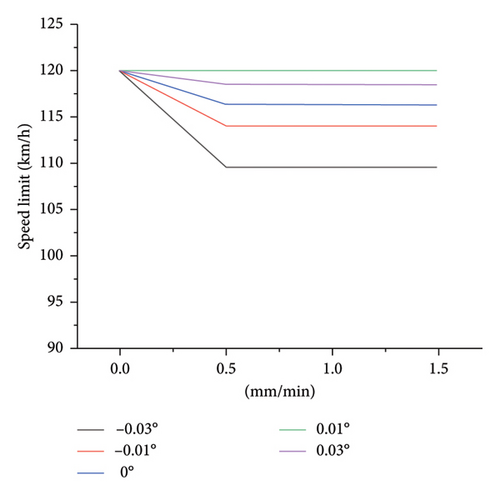
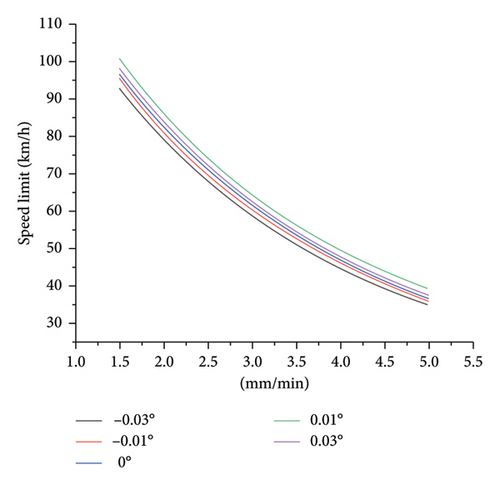
- 1.
During light/moderate rain, the speed limit for manually driven vehicles remains above 90 km/h, while the speed limit for AVs remains above 110 km/h.
- 2.
During heavy/torrential rains, the speed limit of manually driven vehicles has a larger span, dropping from 100 to 35 km/h, while the safe speed limit of AVs has a smaller span, remaining at 64 km/h, within the range of 67 km/h.
- 3.
When the longitudinal slope is 0.01°, both HVs and AVs have the highest safe speed limit. When the longitudinal slope is −0.03°, both the safe speed limits are the smallest, which is the most unfavorable driving condition.
4.2. Analysis of Traffic Flow Characteristics of HV and AV Under the Speed Limit Method
Rainfall not only reduces the traffic efficiency but also increases the risk of traffic accidents and worsens traffic flow stability due to the heterogeneity of HVs. Therefore, this section starts from the three aspects of traffic efficiency, stability, and safety and analyzes the traffic flow characteristics of HV and AV under this speed limiting method based on the rainy days freeway speed limit method and the SUMO simulation platform.
In this experiment, the freeway in the simulation scenario was designed as a two-way 6 lane, with a lane width of 3.75 m, a design speed of 100 km/h, a cross slope of 0.02°, and the most unfavorable longitudinal slope of −0.03° on a sunny day. The friction coefficient is 0.05, the freeway sections are all set as rain areas, and the length is set as 5 km. The SUMO simulation warm-up time is 400 s, and the period for statistics of simulation results using the traffic control interface (TraCI) is from 400 to 4000 s.
4.2.1. Traffic Efficiency
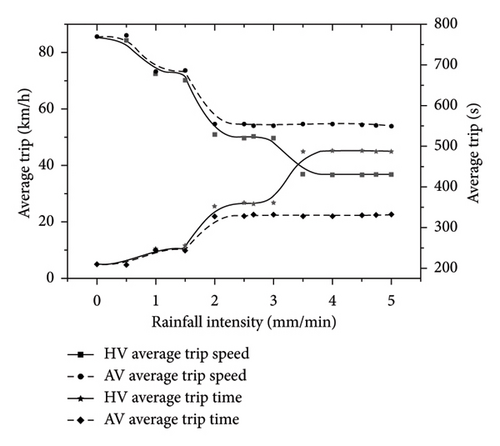
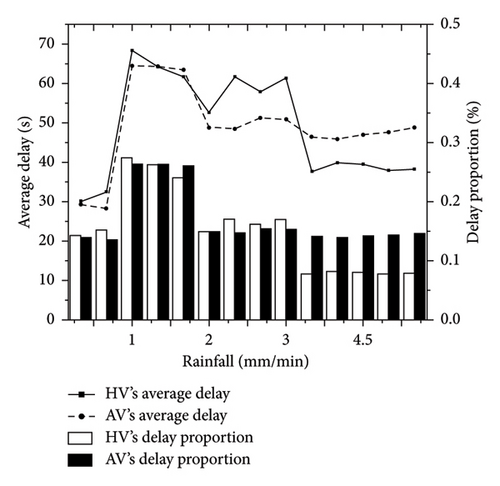
The differences in visual distance, reaction time, and expected speed between manual and AVs will be reflected in the operating efficiency of traffic flow. AVs have higher expected speeds on rainy days, which will make the average travel speed of the entire traffic flow higher. High, average travel time is shorter. Therefore, the average travel speed of the road section, the average travel time of the road section, the average delay of the road section, and the proportion of delay to travel time are used as the efficiency evaluation indicators of traffic flow.
The traffic efficiency index uses average travel speed, average travel time, average delay, and the ratio of delay to travel time. The simulation results of average travel speed and average travel time are shown in Table 6, where HV and AV represent HV and AVs.
| Rainfall intensity (mm/min) | HV | AV | ||
|---|---|---|---|---|
| Travel speed (km/h) | Travel time (s) | Travel speed (km/h) | Travel time (s) | |
| 0 | 84.46 | 210.59 | 86.15 | 209.80 |
| 0.5 | 8 3.4 4 | 213.14 | 86.58 | 208.75 |
| 1 | 71.48 | 248.82 | 73.81 | 244.87 |
| 1.5 | 70.24 | 256.20 | 73.74 | 243.85 |
| 2 | 73.53 | 352.91 | 73.47 | 327.97 |
| 2.5 | 49.77 | 362.08 | 54.75 | 328.54 |
| 2.66 | 50.28 | 358.40 | 54.13 | 332.28 |
| 3 | 49.81 | 361.84 | 54.14 | 332.20 |
| 3.5 | 49.77 | 487.59 | 54.75 | 328.25 |
| 4 | 36.72 | 489.85 | 54.76 | 328.46 |
| 4.5 | 36.75 | 489.42 | 54.46 | 330.25 |
| 4.74 | 36.87 | 487.85 | 54.23 | 331.64 |
| 5 | 36.72 | 488.13 | 54.76 | 333.10 |
- 1.
The average travel speed of manually driven and AVs gradually decreases, and the average travel time gradually increases; among them, when the rainfall intensity q > 3.8 mm/min, the average travel speed and average travel time of manually driven vehicles tend to be stable, and when the rainfall intensity q > 2.2 mm/min, the average travel speed and average travel time of AVs tend to be stable.
- 2.
During light/moderate rain, the traffic efficiency of HVs and AVs is not much different; when the rainfall intensity is q > 1.49 mm/min, the traffic efficiency of AVs is higher, especially during heavy rain, and the traffic efficiency of AVs is significantly better for HVs.
- 1.
In rainy days, the average delays of manual and AVs are significantly higher than those in sunny weather.
- 2.
When the rainfall intensity is 0 < q < 1 mm/min, the average delay of manual and AVs increases sharply; at that time, the delay of manual vehicles remains high, and, 1.0 mm/min < q < 3.0 mm/min 1.0 mm/min < q < 1.5 mm/min, at that time, the delay of AVs remains high.
- 3.
When the rainfall intensity is, the average delay of self-driving vehicles is smaller, and when 2.0 mm/min < q < 3.0 mm/min 3.5 mm/min < q < 5.0 mm/min, the average delay and delay proportion of HVs are smaller.
| Rainfall intensity (mm/min) | HV | AV | ||
|---|---|---|---|---|
| Delay (s) | Delay proportion (%) | Delay (s) | Delay proportion (%) | |
| 0 | 30.11 | 14 | 29.33 | 14 |
| 0.5 | 32.54 | 15 | 28.32 | 14 |
| 1 | 68.39 | 27 | 64.57 | 26 |
| 1.5 | 61.72 | 24 | 63.52 | 26 |
| 2 | 52.64 | 15 | 48.86 | 15 |
| 2.5 | 61.68 | 17 | 48.48 | 15 |
| 2.66 | 58.00 | 16 | 51.34 | 15 |
| 3 | 61.43 | 17 | 50.97 | 15 |
| 3.5 | 37.69 | 8 | 46.48 | 14 |
| 4 | 39.94 | 8 | 45.92 | 14 |
| 4.5 | 39.54 | 8 | 47.00 | 14 |
| 4.74 | 37.96 | 8 | 47.68 | 14 |
| 5 | 38.27 | 8 | 48.82 | 15 |
4.2.2. Stability
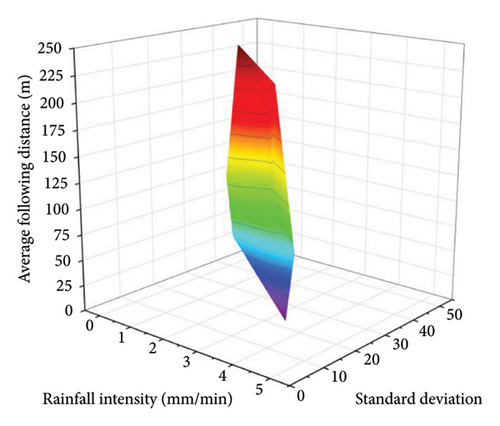
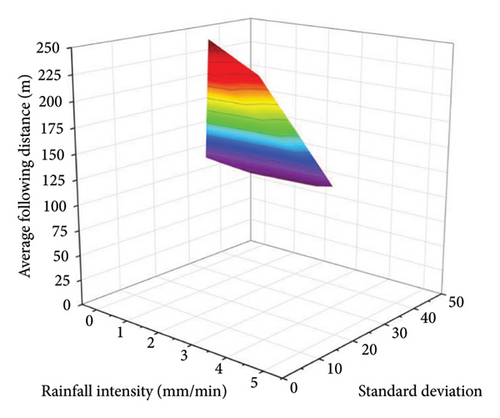
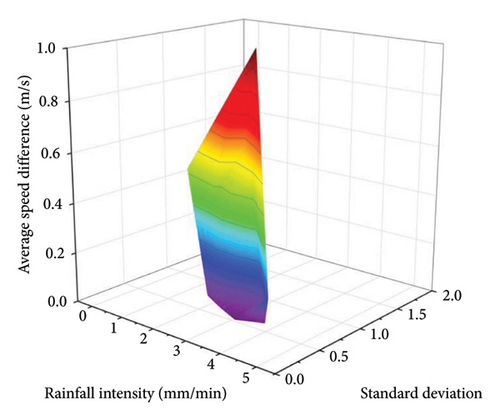
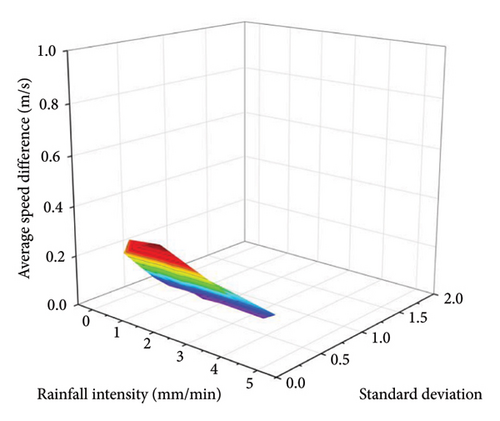
The standard deviation of the following distance can describe the continuity of traffic flow on the freeway, and the speed standard deviation represents the amplitude of vehicle speed changes and can describe the degree of discreteness of the traffic flow. Due to the influence of rainy weather, vehicles on the freeway reduce their speed. Upstream vehicles decelerating or braking can easily cause greater disturbance to the downstream traffic flow, causing the traffic flow to show an unstable trend, which is reflected in changes in following distance and speed superior. Therefore, the standard deviation of the following distance and the standard deviation of speed are selected to measure the traffic flow stability of HVs and AVs on rainy days.
The stability index uses the standard deviation of the following distance to describe the continuity of the traffic flow, and the speed standard deviation to describe the degree of discreteness of the traffic flow. The following distance and speed difference of all vehicles on the road are collected every 10 s. The simulation results are shown in Table 8.
| Rainfall intensity (mm/min) | HV | AV | ||
|---|---|---|---|---|
| Following distance (m) | Speed difference (m/s) | Following distance (m) | Speed difference (m/s) | |
| 0 | 231.61 | 0.44 | 240.58 | 0.23 |
| 0.5 | 187.56 | 0.91 | 214.17 | 0.23 |
| 1 | 194.92 | 0.59 | 211.10 | 0.27 |
| 1.5 | 123.76 | 0.37 | 143.78 | 0.17 |
| 2 | 121.79 | 0.41 | 142.51 | 0.16 |
| 2.5 | 121.21 | 0.50 | 142.88 | 0.16 |
| 2.66 | 120.70 | 0.44 | 142.77 | 0.16 |
| 3 | 93.66 | 0.14 | 141.23 | 0.15 |
| 3.5 | 93.53 | 0.12 | 141.30 | 0.15 |
| 4 | 94.81 | 0.10 | 141.82 | 0.17 |
| 4.5 | 93.43 | 0.14 | 141.71 | 0.16 |
| 4.74 | 94.77 | 0.12 | 141.99 | 0.15 |
| 5 | 44.67 | 0.23 | 141.57 | 0.17 |
- 1.
Overall, whether it is the average following distance or the average speed difference, the change range of AVs is smaller than that of HVs, indicating that the stability of AVs is better than that of manual vehicles.
- 2.
The following distance of AVs is larger, but the speed difference is smaller and always remains low. Analysis believes that maintaining a larger following distance and a smaller speed difference is because the reaction time of AVs is shorter. It can adjust its own distance and speed to a reasonable range more quickly.
4.2.3. Safety
The safety indicator of traffic flow uses TTC, and the TTC of all vehicles on the road is collected every 10 s. If the TTC of the vehicle meets 0 < TTC ≤ 3, the s condition, the vehicle is considered to be in a conflict state and may collide. The number of conflicts and conflict rates data between HVs and AVs are shown in Table 9.
| Rainfall intensity (mm/min) | HV | AV | ||
|---|---|---|---|---|
| Number of conflicts (times) | Conflict rate (%) | Number of conflicts (times) | Conflict rate (%) | |
| 0 | 259 | 0.0545 _ _ | 38 | 0.0082 |
| 0.5 | 103 | 0.0321 | 6 | 0.0019 |
| 1 | 24 | 0.0076 | 1 | 0.0003 |
| 1.5 | 179 | 0.0392 | 1 | 0.0002 |
| 2 | 299 | 0.0639 | 2 | 0.0005 |
| 2.5 | 305 | 0.0658 | 2 | 0.0005 |
| 2.66 | 342 | 0.0731 | 1 | 0.0002 |
| 3 | 3 | 0.0005 | 0 | 0 |
| 3.5 | 3 | 0.0005 | 0 | 0 |
| 4 | 2 | 0.0003 | 0 | 0 |
| 4.5 | 9 | 0.0014 | 1 | 0.0002 |
| 4.74 | 1 | 0.0002 | 0 | 0 |
| 5 | 0 | 0 | 1 | 0.0002 |
The number and conflict rates of traffic flow conflicts are shown in Figure 7. It can be found that under this speed limit method, the number and conflict rate of AV are significantly smaller than that of HV.
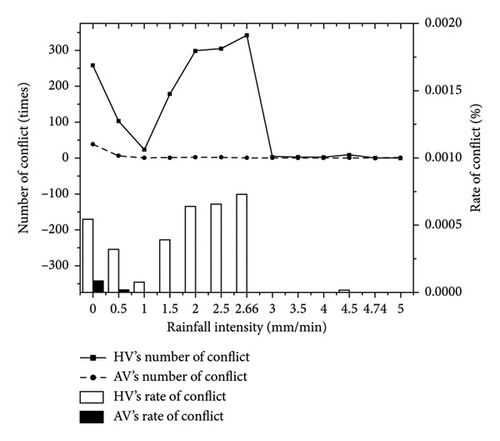
For HVs, first, in light/moderate rain, the number of conflicts and conflict rate gradually decrease with the increase in rainfall intensity; second, in heavy rain, conflicts are the most serious, and the number of conflicts and conflict rates decrease with the increase of rainfall intensity. The number of conflicts gradually increases with the increase in rain intensity, exceeding the number of conflicts on sunny days; third, during heavy rain, almost no conflicts occur. Through analysis, it is believed that, first, during light/moderate rain, the safe distance is mainly affected by the driving speed. The safe speed limit decreases as the rainfall intensity increases, and the braking distance of the vehicle gradually decreases, so the conflict rate gradually decreases. Second, during heavy rain, the influence of water film thickness is intensified. As the rainfall intensity increases, the braking distance gradually increases. The insufficient braking distance causes the conflict rate to gradually increase. Third, during heavy rain, the speed limit value is very low. At this time, the braking distance of the vehicle is short, so there is less vehicle conflict.
For self-driving vehicles, whether it is sunny or rainy, the number of conflicts and conflict rates are significantly less than that of HVs. Among them, there are a small number of conflicts on sunny days and almost zero conflicts on rainy days. Through analysis, it is believed that the reaction time of AVs is shorter than that of manually driven vehicles. The braking distance of the former is shorter, so there are fewer conflicts under the same rainfall intensity. At the same time, compared to sunny days, the safe time of AVs on rainy days is larger, travels at a smaller speed, and can ensure a sufficient safe distance, so it is close to zero conflict.
In summary, the traffic flow characteristics of HV and AV under the speed limit method proposed in this study are analyzed through simulation means. The analysis results show that first, AVs are better than HVs in terms of efficiency, stability and safety. Second, for both HV and AV traffic flow, the travel speed decreases faster and delays are the highest during moderate, heavy, and heavy rains. Third, under this speed limit method, the number of conflicts between HVs is most obvious during heavy and heavy rains. Self-driving vehicles have close to zero conflict on rainy days.
5. Conclusion
- 1.
An improved car-following model based on a dynamic safety speed limit is established. The impact mechanism of rainfall on safe speed limit is analyzed. Combined with safe driving conditions, the safe distance model is derived and a dynamic safe speed limit model on rainy days is proposed. On this basis, the impact mechanism of rainfall on the IDM car-following model was analyzed and the car-following model was improved [38]. This model overcomes the shortcomings of the traditional classic car-following model that is only suitable for describing ideal traffic conditions and can be used to describe rainy weather and microscopic motion states of HVs and AVs.
- 2.
A freeway speed limit plan under rainy weather is proposed. Aiming at the requirements of ensuring timeliness and accuracy of speed limit control on freeways under rainy weather, a speed limit value scheme for freeways on rainy days is proposed. This scheme takes into account the rainfall intensity and longitudinal slope of the road section and implements a freeway speed control system. The function of publishing corresponding speed limit values in real time and accurately for HVs and AVs ensures refined management of traffic flow and driving on rainy days [29, 38].
- 3.
A simulation experiment was designed to analyze the traffic flow characteristics of freeways under rainfall weather. Using SUMO simulation software, a simulation experiment was designed to analyze the traffic flow characteristics of HVs and AVs under different rainfall intensities and compared the traffic efficiency, stability, and safety between the two, verifying that AV operates under rainfall conditions. Based on the simulation results, the following suggestions are made for freeways in rainfall weather:
- 1.
In light rain or moderate rain, in order to ensure driving safety, the safe speed limit for HV should be set to 90 km/h, and the safe speed limit for AV should be set to 105 km/h.
- 2.
During heavy rain or torrential rain, the safe speed limit for manually driven vehicles should follow relevant regulations, that is, when the rainfall intensity is, the speed limit is 60 km/h, and when the rainfall intensity, and the speed limit is 40 km/h. When the rainfall intensity is, the speed limit is 20 km/h and you need to leave the freeway as soon as possible.
- 3.
During heavy rain or rainstorms, in order to ensure traffic safety, the safe speed limit of AVs should be set to 60 km/h.
- 1.
- 1.
In the freeway scene in this study, the main consideration for the road alignment is the longitudinal slope. However, due to the restrictions of terrain, geology, and other conditions, the alignment of some road sections is poor, such as continuous slope sections, steep slopes, and turning sections. These alignments with poor road sections also have a significant impact on road speed limits. Subsequent research can focus on these scenarios, which can make the applicable scenarios of this speed limit method more abundant.
- 2.
When analyzing the impact mechanism of rainfall on the safe speed limit of AV, this study mainly considers factors with more significant effects. Since AV relies on sensors to identify signs and markings and other information, if there is water on the road, it can easily affect its perception and accuracy. Follow-up research can consider the impact on safe speed limits caused by water accumulation on the road, which makes it difficult to recognize signs and markings.
Conflicts of Interest
The authors declare no conflicts of Interest.
Funding
This study was supported by a grant from the Department of Education of Guangdong Province (Grant no. 2022KCXTD027) and the Shenzhen UAV Test Public Service Platform and Low-Altitude Economic Integration and Innovation Research Center (Grant no. 29853MKCJ202300205).
Open Research
Data Availability Statement
The authors can make data available on request through the email: [email protected].


