Investigating the Safety of Run-Off-the-Road Vehicles on Vertical and Horizontal Curves With the Foreslope Using Multiple Regression Analysis
Abstract
The run-off-the-road (ROR) vehicle from the curves, as one of the most accident-prone sections of roads, has always received special attention. Centrifugal force on vehicles and human error are the two main causes of accidents in these areas, which will eventually lead to overturning or sliding of vehicles. Based on previous research, few studies have been conducted on the influence of friction factors over horizontal and vertical curves with foreslopes for ROR vehicles considering various factors such as vehicle type, speed, departure angle, and foreslope slope through the vehicle dynamics simulation. Thus, in this research, the safety of ROR vehicles on curves over the foreslope was investigated from the perspective of the vehicle dynamics simulation. Finally, by simulation outputs for each of the vehicles used (Sedan, SUV, and truck), a multiple regression modeling was presented to examine the side friction factor of horizontal and vertical curves with a foreslope. The results showed that for horizontal curves, the first third of the beginning of the curve was the most dangerous part when vehicles deviated from the curves. Also, in vertical curves, the departure angle of 15 and 25° for vehicles, and foreslopes of 1: 3 and 1: 4, had the greatest effect on the overturning points of the vehicles. In addition, trucks had fewer friction factors at all speeds in comparison with Sedans and SUVs, and consequently, they had lower skidding potential in all specified conditions. On the other hand, an increase in skidding potential was observed in all tests on steeper foreslopes, which was caused by increasing the side friction factors and decreasing the margin of safety of vehicles on these types of foreslopes. Finally, based on the multiple regression analysis, the best model was presented to predict the side friction factor for various vehicles on horizontal and vertical curves with a foreslope, and it was indicated that the obtained models had a good correlation for all the test conditions. The study’s findings can be applied to improve road safety by modifying road geometry, adjusting foreslope angles, enhancing pavement friction, and informing vehicle design and driver education programs.
1. Introduction
Transportation management is a multifaceted discipline that encompasses the planning, execution, and oversight of the movement of goods and people. One of its primary goals is to ensure the safety and efficiency of transportation systems [1, 2]. This involves a range of activities, from route planning and vehicle maintenance to traffic management and the implementation of safety protocols [3, 4]. Sustainability in urban planning plays a crucial role in creating transportation systems that minimize environmental impact and promote long-term ecological balance [5–7]. A critical aspect of transportation management is road safety, particularly in areas prone to accidents, such as horizontal and vertical curves. These curves are especially hazardous due to the centrifugal force exerted on vehicles, which can lead to a loss of control if not properly managed. The design and maintenance of these road sections are crucial in mitigating risks and preventing accidents [8–10]. The safety of curves, especially on foreslopes, is dependent on some factors, the most important of which is the geometrical features of the road [11]. Enhancing the safety of horizontal and vertical curves, especially on mountain roads, is crucial due to the potential combination of horizontal curves with vertical alignments and steep foreslopes [12].
The condition of the pavement surface plays a vital role in ensuring road safety by providing necessary friction for vehicle control [13–15]. Pavement surface friction is a critical factor in road traffic safety. A low friction factor caused by surface polishing or improper implementation is considered a potential risk for the occurrence of an accident [16, 17]. In addition, low friction decreases the available friction and increases the required friction, which will raise the risk of an accident, especially in curves [18]. The coefficient f is referred to by various terms, including the side ratio, rotation ratio, friction factor, and side friction factor, of which, the last one is used here because of its increased application. Friction is defined under two longitudinal and radial (side) directions of movement [19, 20]. Based on this, the design guidelines define the allowed friction factors in two directions of movement. The wheels of the vehicle start to slide when the side friction factor reaches its upper limit, which is called the impending skidding point. The amount of friction is dependent on different parameters: the conditions and type of tires and pavement surfaces, weather conditions, vehicle type, driver performance, the ability to control the vehicle when leaving the road, changing driver behavior, and applying the braking force. Vehicle dynamics simulation can be used to predict and analyze the behavior of vehicles under various friction conditions, helping to design safer roads and improve vehicle control strategies [21–23]. As speed increases, the required friction also increases if the existing friction decreases at the same time [24–26]. Based on this, if the margin of safety has a value greater than zero (i.e., available side friction > necessary side friction), the road conditions are considered safe and suitable, but when it is less than zero (available side friction < necessary side friction), there is not enough friction for braking force and for returning to the moving path. In this case, it is necessary to provide safe conditions on vertical and horizontal curves with the following methods: modifying the geometry of horizontal and vertical curves, adjusting the geometry and slope of foreslopes, reducing the 85th percentile speed, and improving the friction conditions of the pavement surface [27, 28].
Zhu and Li analyzed the use and impact of roadside guardrails on Indiana’s highways, focusing on types, lengths, and positions. It examined 4657 run-off-the-road (ROR) crashes from 2004 and 2006, assessing crash frequencies, locations, and consequences, as well as factors such as road geometry, seasons, and traffic volume. The study also evaluated vehicle–guardrail crash features and predicted crash rates and severities, finding lower encroachment rates than the AASHTO guidelines. In addition, it reviewed guardrail repair costs, noting significant increases in steel prices and varying costs for different guardrail types. The average repair cost was $722 per crash, with annual maintenance at $0.305 per foot. ArcMap was used for managing and analyzing the data [29]. Montella and Pernetti analyzed 1092 ROR crashes on Italy’s A16 motorway (2001–2005) to identify the risk factors for improving safety measures. Findings revealed that motorcycle crashes were more severe than other vehicle types, while adverse conditions (nighttime and wet pavement) reduced crash severity. Crashes into ditches and slopes were more severe than those against steel barriers. Blunt-end terminals of safety barriers significantly increased crash severity compared to their longitudinal counterparts. Thrie-beam barriers outperformed older W-beam types, and New Jersey concrete barriers led to more severe crashes and rollovers compared to steel barriers, despite better performance in preventing penetration and override [30].
Delgado aimed to create regression models to estimate annual ROR crash costs for rural road segments, considering roadway and traffic characteristics, as well as the nature and dimensions of roadside hazards. These estimates would enable quick network-level evaluations. The models, which were based on Road Safety Analysis Program (RSAP) analysis and collected data, achieved a coefficient of determination (R2) of 0.80. They were used to replicate a 2005 Hillsborough County study, confirming the ranking of 19 sites for further engineering evaluation with minor variations in the risk index [31]. Bamzai et al. provided a detailed analysis of the safety impacts of shoulder attributes on Illinois state highways from 2000 to 2006. It began with a preliminary data analysis to identify correlations between shoulder-related ROR crashes and shoulder characteristics such as material type and paved width. An analytical procedure, incorporating empirical Bayesian (EB) analysis, cross-sectional analysis, and an optimization model, was then applied to assess the safety impacts of shoulder paving and prioritize highway segments for improvement. While human judgment remains essential, this method aids experts in making more informed decisions. The findings aimed to assist the Illinois Department of Transportation (DOT) in updating their design manuals [32]. Siddiqui delved into the issues related to single-vehicle ROR crashes, highlighting their significance and examining both traditional and modern countermeasures. It was indicated that these crashes accounted for 40.6% of fatal, 20% of injury, and 11.2% of property damage-only incidents in the United States. Key findings included a high prevalence of fatal crashes on rural roads and the dominant role of driver error. Effective countermeasures, such as shoulder rumble strips and electronic stability control, were crucial in reducing these incidents and improving safety. The analysis underscored the importance of addressing driver behavior, environmental conditions, and vehicle performance to mitigate ROR crashes [33].
Bham et al. analyzed winter crashes on depressed medians of four Southcentral Alaska freeways. Cross-median crashes (CMCs) were randomly distributed and were 2.5 times more likely to cause severe injuries than in-median crashes. Rollovers accounted for 72.9% of median crashes. Both flatter (6H: 1V) and steeper (4: 1/5: 1) slopes had similar CMC and rollover frequencies, but flatter slopes saw more nonrollover crashes. Median crashes were most frequent with a 32 ft width and decreased as width increased. Regression models linked median rollover crashes to severe injuries, driver inexperience, curves, specific median widths, ice, and certain times of day, while CMCs were linked to multiple vehicles, light trucks, nighttime, and rutting. The spatial analysis identified nine crash hotspots and six interchanges for further study [34]. Carrigan et al. performed a study that is one of the pioneering efforts to analyze ROR crash data for both urban and rural settings simultaneously. The research highlights notable differences between these areas. It was found that, with all other roadway characteristics being equal, urban roadways tend to have a higher incidence of ROR crashes compared to rural ones. Conversely, factors such as road curvature and grade significantly increase the likelihood of ROR crashes in rural areas but have minimal impact in urban settings. In addition, the presence of shielding affects crash severity more in rural areas than in urban ones. These findings suggest that the AASHTO Roadside Design Guide should incorporate these distinctions in future updates to better address the varying crash frequencies between urban and rural areas [35].
Chawla evaluated the impact and cost-effectiveness of various culvert safety treatments to reduce ROR crash risks. Analyzing crash data from January 2007 to August 2017, the study linked crash, culvert, and roadway data, resulting in a dataset of 500 crashes on 481 culverts. Crash rates were calculated for different road types and modeled using the RSAP. RSAP’s estimated crash rates were generally 2–13 times higher than actual rates. The findings suggest that safety grates on culvert openings are the most cost-effective solution, while guardrail installation was the least effective, often increasing crash numbers and costs. Extending culverts outside the clear zone was somewhat cost-effective but less so than installing safety grates [36]. The Kansas DOT (KDOT) funded a study to evaluate the cost-effectiveness of installing guardrails on low-volume rural roads to reduce ROR fatalities and costs. Using RSAPv3 simulations and local data, Wang analyzed traffic and road features to assess the benefits of guardrails. The findings indicated that new guardrails for bare culverts or embankments were not cost-effective. However, W-beam guardrails were beneficial for bridges with medium-hazard edges, while bridge-approach guardrails were not justified for TL-2 bridge rails. The study also identified key factors contributing to rural roadside crashes [37]. Yarmohammadisatri et al. introduced an enhanced multibody dynamics model that evaluates steering and suspension systems together. It examined how suspension geometry and the kingpin axis affect steering. The approach involved three steps: assessing suspension geometry’s impact on steering returnability and ride quality, using geometry model’s outputs to evaluate steering effects, and applying a probabilistic method with NSGA II for robust design. The model’s accuracy was validated through tests on a Renault Logan, including constant cornering and double-lane change tests, and compared with Adams Car simulations [38]. Lee et al. theoretically analyzed the overturning stability of small ROR vehicles, focusing on backward roll-over and lateral overturning. It identified critical angular velocity and traveling speed, which cause these instabilities. Findings showed that moving the vehicle’s center of gravity forward and increasing its width enhance stability. The results guided the design of stable small ROR vehicles for navigating narrow ridges and orchards and provided a foundation for further research on agricultural machinery stability [39].
1.1. Research Objectives
According to the flaws in AASHTO’s relationships, especially the assumption of using the point mass model, the calculation of the margin of safety will also be accompanied by errors, so the results obtained from it are not completely accurate, and it may lead designers and officials to find dangerous and accident-prone points (points with a margin of safety less than zero) by mistake. Moreover, based on previous research, few studies have been conducted on the influence of side friction factor over horizontal and vertical curves with foreslopes for ROR vehicles considering various departure angles of vehicles, speeds, and slopes of foreslopes through the vehicle dynamics simulation concept. Therefore, by the use of a more appropriate model compared to the point mass model, the present study aims to solve the problem of the horizontal and vertical curves over the foreslope. Also, simulations will be performed using the vehicle dynamics simulator software (CarSim and TruckSim) in order to analyze the curves and safe foreslopes under study. After the completion of the simulation stage, to achieve new relationships, the output data of CarSim and TruckSim software are applied for the input of SPSS statistical analysis software, so that with the use of this software, the effect of the variables in question, such as the slope of the foreslope, speed, and vehicle’s departure angle, can be obtained according to the side friction factor, and finally, a multiple regression modeling will be presented to estimate the side friction factor according to the available variables, which can help designers and officials to identify and reduce the risk of the vehicle overturning and sliding.
2. Methodology
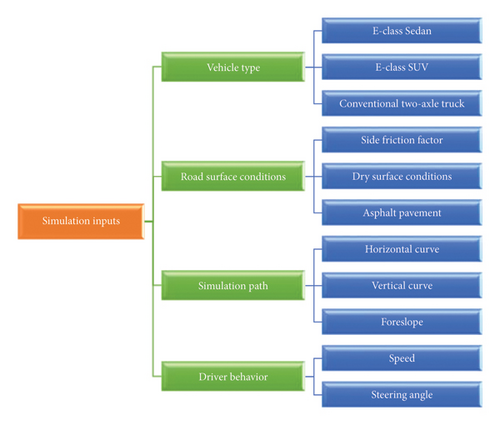
This section begins with introducing the simulation software utilized in this study. Following this, the process of inputting various data types, such as vehicle classifications, roadway information, and the specifics of the analysis procedure, is detailed. Figure 1 illustrates the variables incorporated in the simulations.
2.1. Simulation Software
Computer simulation models provide a possibility to accurately evaluate the performance of vehicles. The development of these simulation models needs accurate knowledge about vehicle dynamics, route dynamics, and their interactions. Considering the strongly coupled characteristics of the interactions between the vehicle and the road, the general procedure is to decouple the interactions and develop two different models for the vehicles as well as the road. Recently, with the advancement of technology, there has been a tendency to consider vehicle–road interactions during the development of simulation models. Since the simulation models are very complex in terms of format, they basically have high research values instead of practical amounts.
Vehicle dynamic simulations have been used for multiple vehicle designing and testing applications for at least 3 decades. Through simulation, engineers can easily evaluate new designs, both at the component level and at the system level, without developing any prototypes. Simulations can be used for preliminary evaluation of a new design, e.g., in eliminating many potential problems that may arise and ultimately lead to a more improved design that can be developed and tested as a prototype. In the long application, this set of simulation tools reduces the time and cost of the entire design process at a high level [40–42].
In the current study, the simulation software of CarSim and TruckSim was used, through which the movements of various vehicle types have been simulated in various driving behaviors and road conditions. Different variables have been considered in the simulation in several ways in order to achieve a comprehensive model, as indicated in Figure 1.
2.2. Vehicle Types
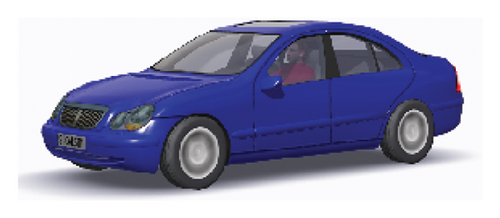
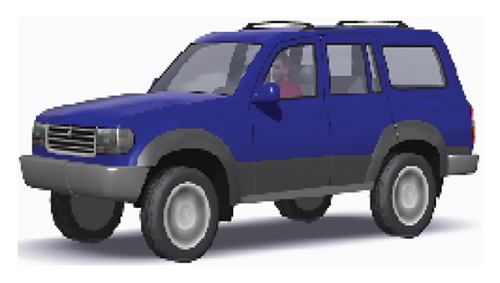
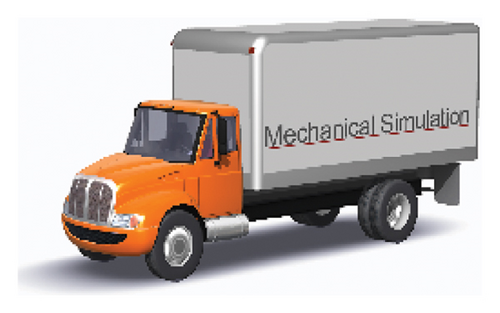
Taking into account the diverse range of vehicles on the road and their fundamental differences in mechanical and geometrical characteristics, this research investigates various vehicle parameters by selecting a representative sample of vehicles for the simulation. The simulation trials included three types of vehicles: two passenger cars (E-class Sedan and E-class SUV) and a conventional two-axle truck.
Due to the distinct geometrical and mechanical characteristics of the E-class Sedan and E-class SUV, these vehicles were chosen as representatives of typical passenger cars in the simulations. In addition, a conventional two-axle truck was included as a representative of cargo vehicles. It is important to note that the E-class SUV, given its geometrical features, has a higher risk of rollover or skidding compared to the E-class Sedan. Figure 2 provides images of the vehicles, while Table 1 details their geometrical characteristics.
| Parameters | Values | |||
|---|---|---|---|---|
| E-class sedan | E-class SUV | Two-axle truck | ||
| Cargo | Driver room | |||
| Weight | 1653 kg | 1592 kg | 6789 kg | 4457 kg |
| Mass center height | 590 mm | 719 mm | 1800 mm | 1173 mm |
| Wheel center height from the ground | 375 mm | 385 mm | — | — |
| Axel span | 3048 mm | 2950 mm | — | — |
| Height | 1480 mm | 1800 mm | 1000 mm | 3200 mm |
| Width | 1880 mm | 1875 mm | 2000 mm | 2438 mm |
| Length | 4250 mm | 4220 mm | 3000 mm | — |
2.3. Surface Conditions and Road Geometry
The maximum friction coefficient of a pavement surface is a numerical value that represents the interaction between the pavement and vehicle tires. This coefficient is influenced by the type of pavement, such as concrete, asphalt, or soil, and the condition of the pavement surface, whether it is dry, wet, or frozen. In this study, we focused on asphalt pavement under dry conditions, and the maximum friction coefficient has been assumed to be 0.9 [43]. This value is crucial for understanding vehicle dynamics and ensuring safety in road design and traffic management. By accurately determining this coefficient, engineers can better predict vehicle behavior, optimize pavement materials, and enhance overall road safety.
To design various route conditions and simulate different placements of the slopes of the foreslopes at the curves, this study has applied different states of horizontal and vertical curves with foreslopes. Moreover, to better compare the slopes of the foreslopes with each other, three slope modes of 1: 3, 1: 4, and 1: 10 have been considered for the embankment foreslope, which is the most common mode on curves.
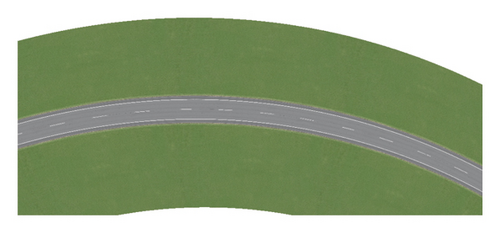
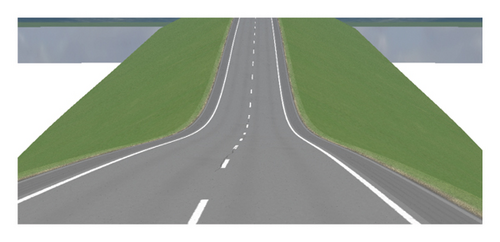
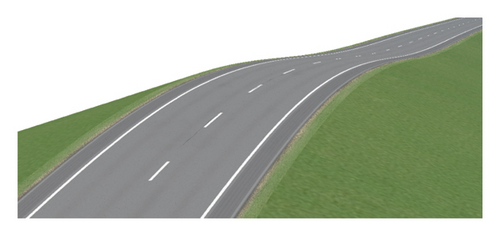
The route plan design includes three simple horizontal curves, as well as four sag vertical curves and one crest vertical curve with grades of (−2, +2), (−2, +6), (−6, +2), (−6, +6), and (+6, −6), in accordance with the AASHTO guidelines. Figure 3 illustrates an example of a route plan for roads with horizontal and vertical curves to examine the safe slope of the foreslopes.
2.4. Driver Behavior
In this research, the driver behavior is simulated by defining variables, such as speed and steering wheel angle. In the performed simulations, the speed of the vehicle is three constant speeds of 80, 100, and 120 km/h for the horizontal curve and two constant speeds of 80 and 100 km/h for the vertical curve. These speeds were chosen based on standard speed limits on rural highways and expressways and reflect typical driving conditions, ensuring the study’s relevance to real-world scenarios.
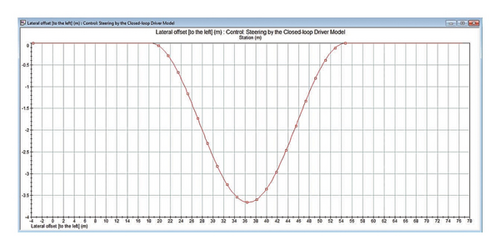
When the vehicle is traveling on curves with various foreslope slopes at different speeds, the steering scenarios are considered so that the changes in the behavior of drivers are simulated and investigated in 4 modes of angle changes to exit the roadway on horizontal curves and 3 modes of angle changes to exit the roadway on vertical curves. In this regard, the vehicles depart from the roadway at an angle of 7.5, 15, 20, and 25° for horizontal curves and 7.5, 15, and 25° for vertical ones. These angles were chosen to represent common scenarios where vehicles might unintentionally depart from the roadway due to driver error, road conditions, or other factors. Figure 4 illustrates the simulation of one scenario where a vehicle departs from the road and then returns to the simulated path.
2.5. Side Friction Factor Calculation
Finally, after extracting all the data and completing the prepared tables, the available data are modeled by the SPSS software. In this modeling, side friction factors will be regarded as a dependent variable, and the variables of the vehicles’ departure angle, speed, and foreslope will be considered independent variables.
3. Results
3.1. Analysis of the Forces on the Wheels
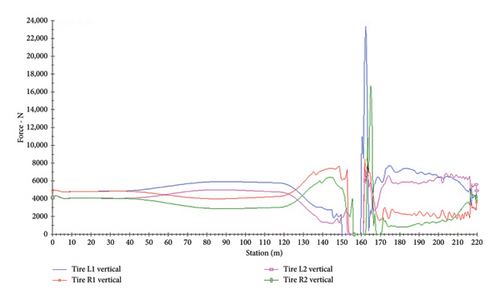
In the current study, to calculate the side friction factors of the moving vehicle, graphs of lateral and vertical forces on vehicle wheels have been used, as shown in Figure 5 for one of the simulation tests. The results show that the maximum lateral force on wheels after the vehicle leaves the road and when the steering angle change reaches its maximum occurs on the curve path on the foreslopes. Figure 6 indicates the graph of lateral force on vehicle wheels on the foreslope.
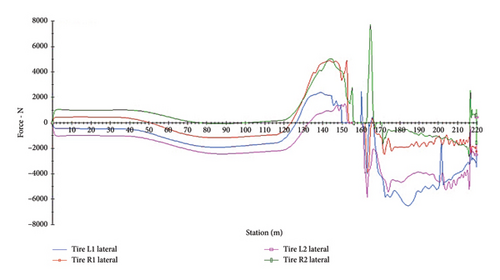
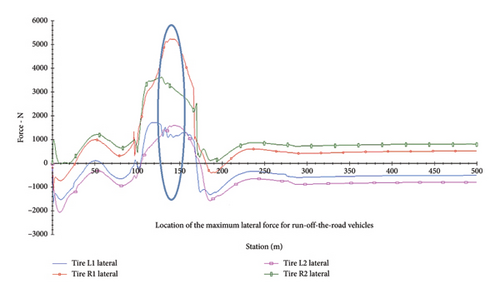
As illustrated in Figure 6, at the maximum departure angle of the vehicle’s steering wheel from the roadway, the vehicle wheels are subjected to the maximum lateral force, which is 5%–10% more than that exerted when traveling the roadway outside on the foreslope in various tests. As a result, this point is most likely to cause the vehicle to skid. It should be noted that the accidents related to ROR are mostly because of the vehicles’ skidding and the lack of control of steering wheel angles when leaving roads on foreslopes.
According to the simulations performed regarding the influencing variables in these simulations, the results of the considered path for vertical curves with the foreslope according to Tables A1, A2, A3, A4, A5, and A6 have been presented for applied forces on the wheels of vehicles in various conditions, including lateral (Fy), vertical (Fz), and longitudinal (Fx) forces. Also, the results of the path considered for horizontal curves with the foreslope according to Tables A7, A8, A9, A10, A11, A12, A13, A14, and A15 have been provided.
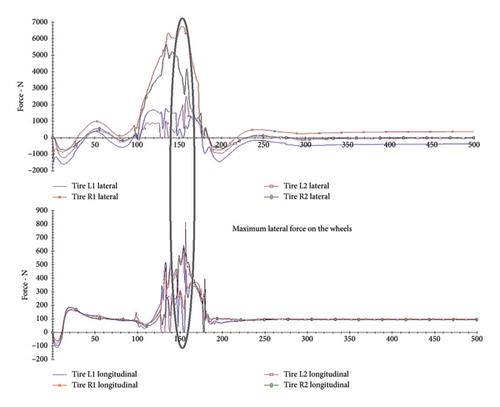
According to the results shown in Tables A1, A2, A3, A4, A5, A6, A7, A8, A9, A10, A11, A12, A13, A14, and A15, the longitudinal, lateral and vertical forces on vehicle wheels undergo many changes when passing over the foreslope. According to the graphs of lateral and vertical forces, it is revealed that when the lateral force in all wheels reaches its maximum value, the vertical force for the inner wheels is at its minimum value when the vehicle leaves the road on the foreslope, and for the outer wheels on the foreslope, it reaches its maximum value. The reason for this is that the centrifugal force causes the vertical load on the wheels to be uneven, which is a proof of a defect with the point mass model. Furthermore, if one of the wheels has a lower vertical force than the others, it is more likely that the wheel will skid than the others. This issue is shown in Figure 7.
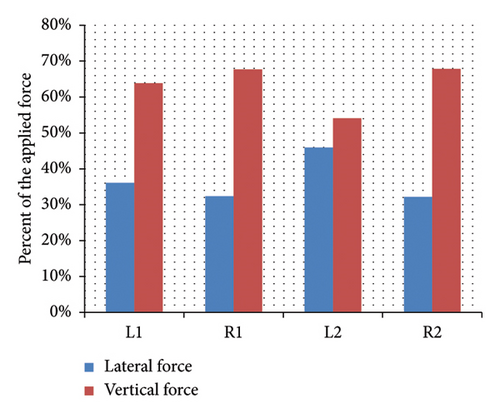
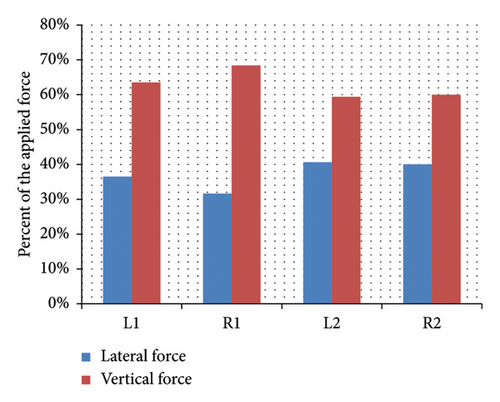
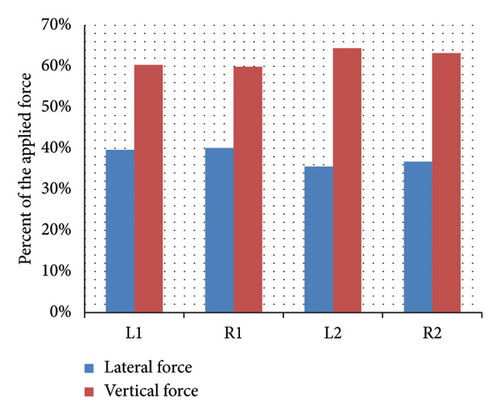
According to the distribution of the forces on the wheels of Sedans, SUVs, and trucks, as shown in Figure 8, it can be observed that the maximum lateral and vertical force is exerted on the wheels on the left side of the vehicle. According to the obtained results, 61% of the lateral forces and 52% of the vertical forces enter the left wheels of the Sedan. The maximum lateral and vertical forces are also exerted on the left wheels of the SUV. In addition, 54% of the lateral forces and 50% of the vertical forces enter the SUV vehicle’s left wheels. On the other hand, maximum lateral forces enter the left wheels and maximum vertical ones the right wheels of the truck vehicle. In addition, 59% of lateral forces are applied to the left wheels and 60% of them are exerted on the left wheels of the truck vehicles. Hence, unlike AASHTO’s assumption in which forces are distributed evenly between the wheels, they are actually distributed based on vehicle weight, rotation angle, and speed.
3.2. Side Friction Factor Results
According to the results of the simulations, the forces exerted on each of the wheels of the vehicle have been obtained for all vehicles in different defined conditions. By the use of these results and equation (1), side friction factors can be achieved for each of the defined tests. Tables A16 and A17 show the lateral and longitudinal friction factors calculated from the simulation, respectively, for the vertical and horizontal curves placed on the foreslopes in each of the simulation tests.
Using the outputs of Tables A16 and A17, results such as the comparison of side friction factors in different vehicles can be obtained at different speeds, and these data have been examined and analyzed in the following.
3.2.1. Comparison of the Side Friction Factor for Different Vehicles in Horizontal Curves With the Foreslopes
Figure 9 indicates the side friction factor changes at different speeds for Sedans, SUVs, and trucks, and Figure 10 illustrates the side friction factor changes in different driving behaviors for these vehicles in the off-road mode in horizontal curves with the foreslope.
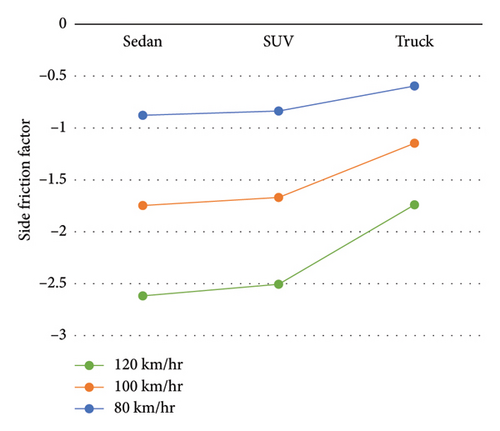
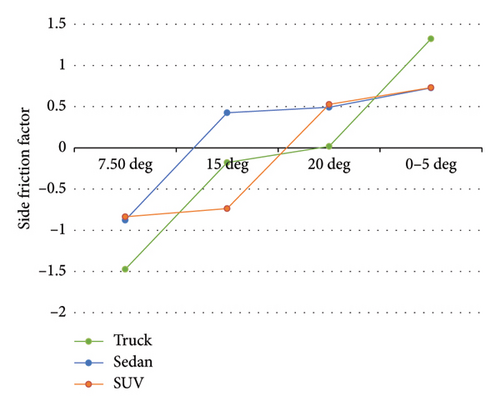
According to Figure 9, at lower speeds, the difference in side friction factor applied to vehicles is greater; however, at all speeds, the side friction factor of the truck vehicles is less than that of Sedan and SUV vehicles. The observed differences in side friction factors at lower speeds are based on the vehicle dynamics and the inherent characteristics of each vehicle type. The truck vehicles, being heavier, exert more vertical force on their wheels, resulting in lower side friction compared to Sedans and SUVs. This difference is more pronounced at lower speeds due to the reduced influence of aerodynamic forces and higher reliance on the tire–pavement interaction.
Also, in Figure 10, based on the various driving behaviors, the friction factor for vehicle departure angle of 7.50° from the road for different vehicles is reduced in the negative direction, which decreases up to the angle of 20° for the truck vehicle. It is also observed that at all speeds, Sedans and SUVs have very similar friction factors at higher departure angles. Therefore, according to Figures 9 and 10, the side friction factor as an effective parameter in ensuring vehicle safety can be improved in the truck compared to SUVs and Sedans. Also, among these three vehicles, the truck has the largest range of friction changes and is therefore more critical.
By examining the output of side friction factors in different vehicles, it is concluded that compared to Sedans and SUVs, trucks have lower side frictions since they exert more vertical force on wheels due to being heavier than the other two vehicles, and the results will be a decrease in side frictions developed between the pavement and the wheels of this vehicle. Therefore, they are less prone to skidding in all defined conditions. It should also be noted that the observed differences in side friction factors at lower speeds are based on the vehicle dynamics and the inherent characteristics of each vehicle type. This difference is more pronounced at lower speeds due to the reduced influence of aerodynamic forces and higher reliance on the tire–pavement interaction.
3.2.2. Comparison of the Side Friction Factor for Different Vehicles in Vertical Curves With the Foreslopes
Figure 11 displays the side friction factor changes at different speeds, and Figure 12 demonstrates the side friction factor changes in different driving behaviors for Sedan, SUV, and truck vehicles in off-road mode with a vertical curve over a foreslope.

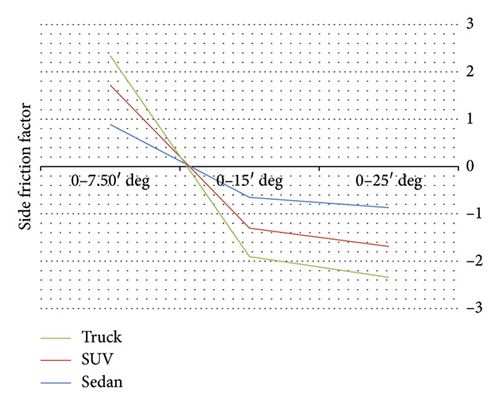
According to Figure 11, at all speeds, the side friction factor of the truck vehicles is less than that of Sedan as well as SUV vehicles. Also, in Figure 12, according to the different behaviors during driving, it is obvious that the friction factors for all vehicle types change direction between the departure angle of 7.50°–15° of the vehicle from the road and decrease in a certain way. It is also clear that at all speeds, side frictions of Sedans as well as SUVs are similar at higher departure angles. Therefore, according to Figures 11 and 12, in comparison with SUV and Sedan, trucks have improved friction factors as an important parameter in vehicle safety, and also among these three vehicles, Sedan has the largest range of friction changes and, therefore, is more critical.
3.2.3. Variations of the Side Friction Factor Based on Speed Changes and Different Driving Behaviors in Horizontal Curves
Examining the results from Figures 13, 14, and 15 and the results of the simulations on the horizontal curves with a foreslope, especially in the turns and mountainous areas with 4 modes of leaving the vehicle from the road for different vehicles, show that the greatest effect of this behavior changes for vehicles occurs in the first third of the curves. In the case of changing the driver’s behavior by 7.5°, in the event that a vehicle leaves the road, it can return to the surface of the road, but in the case of 15° and at a speed of 120, the vehicle returns to the road surface and the travel lane with a jump and lack of proper control. This problem can be solved by softening the slope of the foreslope. At an angle of 20° and 25°, light vehicles jump and then roll immediately after the most critical point of the applied forces, but for trucks, before reaching a third of the radius of the curve, the vehicle rolls without slipping or jumping.
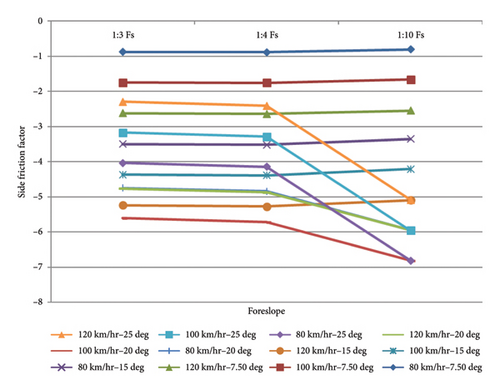
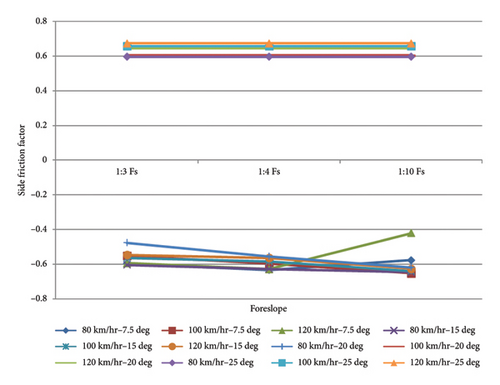
According to the amount of force exerted on the vehicles, the 20- and 25-degree off-road conditions are the most critical and worrying possible conditions for a vehicle when leaving the road, especially at high speeds.
3.2.4. Variations of the Side Friction Factor Based on Speed Changes and Different Driving Behaviors in Vertical Curves
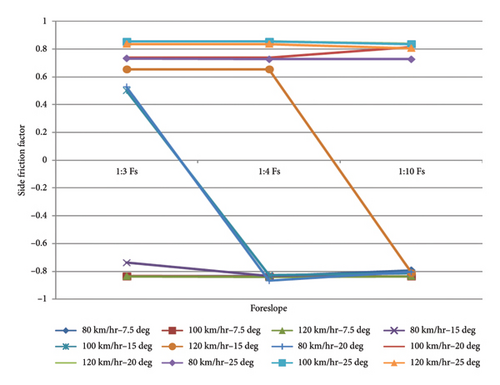
According to the investigations carried out according to the results of Figures 16, 17, and 18, at the angle of 7.5 when leaving the road, the vehicle faces constant forces applied to it, and skidding is not observed in these cases. In the case of 15 degrees of change in the drivers’ behavior, Sedan and SUV jump and turn over at 100 km/h speed, and at all three speeds, the truck rolls. In the condition of exiting the roadway at a 25-degree angle, the Sedan and SUV vehicles turn over and the truck rolls. In the case of 25°, it can be said that the Sedan and SUV vehicles, after slipping and sliding on the foreslope, turn over at the studied speeds, and this is in the form of rolling in the truck vehicle without slipping and sliding.
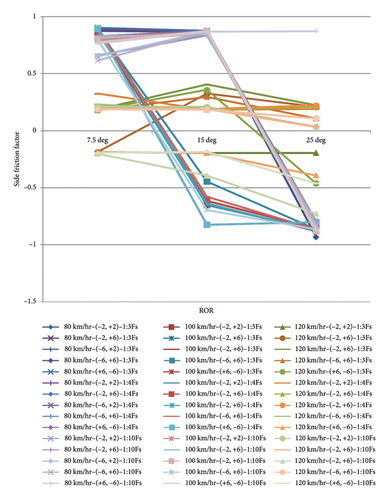
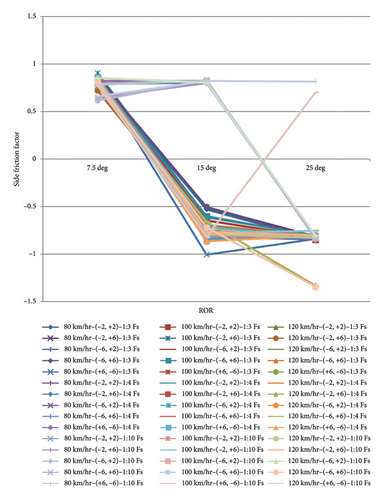
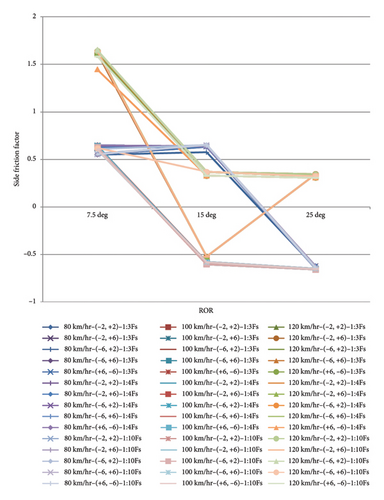
The results also show that a 15-degree departure angle from the road for driving behavior indicates a change in the direction of forces exerted on the vehicles when exiting vertical curves on the foreslopes, in which negative friction factors are observed. During the most critical and worst states of movement, the force applied to vehicle wheels changes direction, resulting in negative friction factors. This critical finding suggests that at certain angles, the forces acting on the vehicle can lead to a loss of control, emphasizing the need for careful design and management of foreslopes to enhance safety.
For a Sedan vehicle, the rolling point for a 7.5-degree departure angle from the road occurs one-third after the point of concavity or convexity of the curve. This is for an angle of 15° after the point of concavity or convexity of the curve but before one-third of the point, and for a 25° departure angle from the road before the convexity or concavity of curves, it is the place where skidding and rolling occurs for this vehicle. This pattern highlights the importance of considering vehicle departure angles in road design to prevent rollovers and skidding.
The difference between the rolling points for the SUV and Sedan vehicles is that at a 15-degree departure angle from the road, it acts like a 25-degree departure angle, that is, before the point of convexity or concavity of curves, it slips and then turns over, and due to the greater height and weight of this type of vehicle in comparison with Sedan, the intensity of this is greater and the change in the direction of forces on the vehicle is shown as a yaw moment with skidding at the rolling points. The rolling points of the truck vehicle are at the same points as for the Sedan vehicle, but the intensity of yaw moments, especially at the departure angle of 15° and 25° from the road, causes the vehicle to roll with negative friction, which is the worst case for a heavy vehicle, which has been observed many times in mountainous areas and passes.
By examining Figures 16, 17, and 18 and analyzing the results of the simulations performed on vertical curves, it can be concluded that in the case of (−6, +6) for the sag vertical curve and (+6, −6) for the crest vertical curve, the driver’s behavior is the worst and most critical condition for a vehicle that has ROR. Also, the changes in the side friction factor are very noticeable in both speed modes for different foreslopes and different modes of driving behavior. As the slope of the foreslopes becomes gentler, side friction factors change less and obtained shapes become more reasonable.
3.3. Side Friction Factor Modeling
In this section, by using the simulation outputs and SPSS software for each of the vehicles, a multiple regression model has been presented to calculate the side friction factor to enhance the safety of road geometric designs through new relationships. These relations show the change of the side friction factor (dependent variable) in terms of the speed of the vehicle, and its departure angle from the roadway and the slope of the foreslope as independent variables.
3.3.1. Side Friction Factor Modeling for Horizontal Curves
3.3.1.1. Sedan Vehicle
| Model | R | R2 | Adjusted R2 | Std. error of the estimate | Durbin–Watson |
|---|---|---|---|---|---|
| 1 | 0.659a | 0.435 | 0.418 | 0.62498 | |
| 2 | 0.716b | 0.513 | 0.483 | 0.58893 | 1.787 |
- Note: Dependent variable is fy.
- aPredictor: constant and ROR.
- bPredictor: constant, ROR, and foreslope.
A regression equation’s fit to the data is determined by the R coefficient, which is 0.659 in the case of ROR and 0.716 in the case of ROR and foreslope.
Table 3 indicates the ANOVA test results, in which, the F value is equal to 26.148 and 17.369 for modeling ROR and modeling ROR and foreslope, respectively.
| Model | Sum of squares | df | Mean square | F | Sig. | |
|---|---|---|---|---|---|---|
| 1 | Regression | 10.214 | 1 | 10.214 | 26.148 | 0.000a |
| Residual | 13.280 | 34 | 0.391 | |||
| Total | 23.494 | 35 | ||||
| 2 | Regression | 12.048 | 2 | 6.024 | 17.369 | 0.000b |
| Residual | 11.446 | 33 | 0.347 | |||
| Total | 23.494 | 35 | ||||
- aPredictor: constant and ROR.
- bPredictor: constant, ROR, and foreslope.
Also, the results related to the coefficients of the model are presented in Table 4, where B is the coefficient of regression models, std. error indicates the amount of change in the response variable per one standard deviation change in the independent variable, t indicates the amount of influence (number) and the way of influence (positive or negative sign) of each variable in the regression model, and Sig. shows the importance of each variable in the regression models, and a value less than 0.05 indicates the high importance of the desired variable.
| Model | Unstandardized coefficient | Standardized coefficient | t | Sig. | ||
|---|---|---|---|---|---|---|
| B | Std. error | Beta | ||||
| 1 | Constant | −1.500 | 0.291 | −5.150 | 0.000 | |
| ROR | 0.082 | 0.016 | 0.659 | 5.114 | 0.000 | |
| 2 | Constant | −1.273 | 0.292 | −4.366 | 0.000 | |
| ROR | 0.082 | 0.015 | 0.659 | 5.427 | 0.000 | |
| Foreslope | −0.005 | 0.002 | −0.279 | −2.300 | 0.028 | |
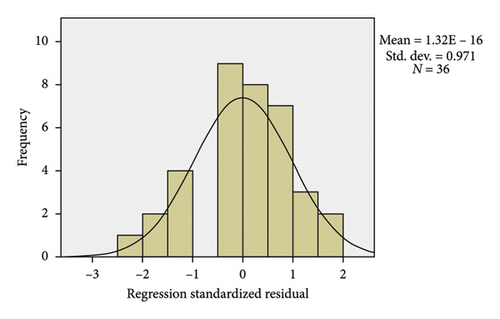
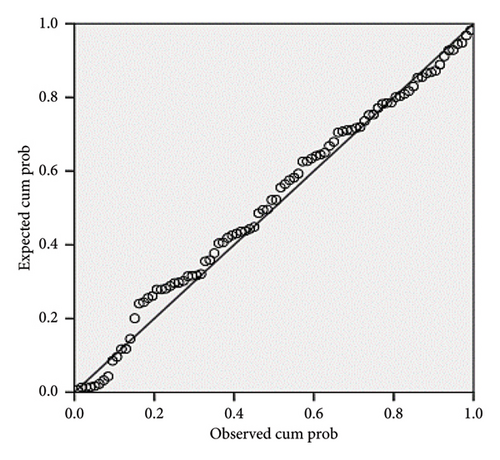
Figure 19 shows the results of the histogram diagram of the side friction factor model for Sedan vehicles in horizontal curves, which is obtained from the data achieved from the analysis of the forces applied to Sedan. Also, Figure 20 shows the correlation diagram of the side friction factor model of these vehicles, in such a way that the illustrated line shows the trend of changes in the model and the circle points represent each of the input data. According to Figure 20, the model generally has a good correlation, so the R value of this model is equal to 0.716.
3.3.1.2. SUV Vehicle
In Table 5, the R coefficient has a value of 0.718 for modeling ROR, 0.775 for modeling ROR and speed, and 0.806 for modeling ROR, speed, and foreslope.
| Model | R | R2 | Adjusted R2 | Std. error of the estimate | Durbin–Watson |
|---|---|---|---|---|---|
| 1 | 0.718a | 0.516 | 0.502 | 0.56702 | |
| 2 | 0.775b | 0.601 | 0.577 | 0.52229 | |
| 3 | 0.806c | 0.650 | 0.617 | 0.49728 | 2.398 |
- Note: Dependent variable is fy.
- aPredictor: constant and ROR.
- bPredictor: constant, ROR, and speed.
- cPredictor: constant, ROR, speed, and foreslope.
In Table 6, the results of the ANOVA test for the SUV side friction factor model are shown, in which, the F value is obtained equal to 36.223, 24.883, and 19.766, respectively, for ROR modeling, ROR and speed modeling, and ROR, speed, and foreslope modeling. Also, the results related to the coefficients of the presented model are indicated in Table 7.
| Model | Sum of squares | df | Mean square | F | Sig. | |
|---|---|---|---|---|---|---|
| 1 | Regression | 11.646 | 1 | 11.646 | 36.223 | 0.000a |
| Residual | 10.931 | 34 | 0.322 | |||
| Total | 22.578 | 35 | ||||
| 2 | Regression | 13.576 | 2 | 6.788 | 24.883 | 0.000b |
| Residual | 9.002 | 33 | 0.273 | |||
| Total | 22.578 | 35 | ||||
| 3 | Regression | 14.664 | 3 | 4.888 | 19.766 | 0.000c |
| Residual | 7.913 | 32 | 0.247 | |||
| Total | 22.578 | 35 | ||||
- aPredictor: constant and ROR.
- bPredictor: constant, ROR, and speed.
- cPredictor: constant, ROR, speed, and foreslope.
| Model | Unstandardized coefficient | Standardized coefficient | t | Sig. | ||
|---|---|---|---|---|---|---|
| B | Std. error | Beta | ||||
| 1 | Constant | −1.520 | 0.264 | −5.755 | 0.000 | |
| ROR | 0.088 | 0.015 | 0.718 | 6.019 | 0.000 | |
| 2 | Constant | −2.938 | 0.586 | −5.014 | 0.000 | |
| ROR | 0.088 | 0.013 | 0.718 | 6.534 | 0.000 | |
| Speed | 0.014 | 0.005 | 0.292 | 2.660 | 0.012 | |
| 3 | Constant | −2.763 | 0.564 | −4.899 | 0.000 | |
| ROR | 0.088 | 0.013 | 0.718 | 6.863 | 0.000 | |
| Speed | 0.014 | 0.005 | 0.292 | 2.793 | 0.009 | |
| Foreslope | −0.004 | 0.002 | −0.220 | −2.098 | 0.044 | |
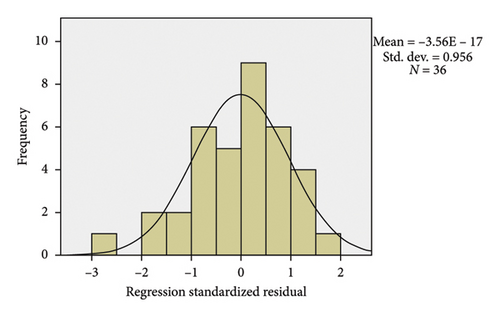
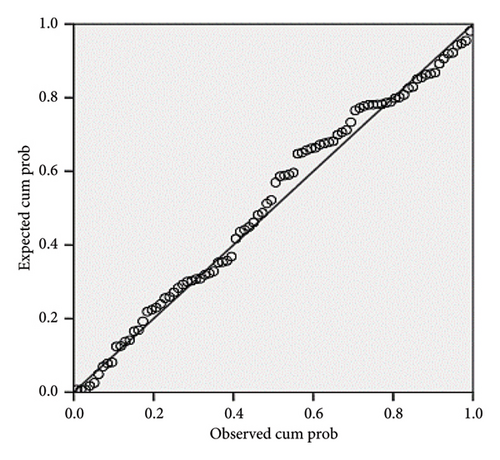
Figure 21 shows the result of the histogram diagram for the side friction factor model of the SUV in the horizontal curve. Also, Figure 22 shows the correlation diagram for this model, according to which, all the data are located around the model fit line, which indicates the validity of the model, so that the R value for this model is equal to 0.806.
3.3.1.3. Truck Vehicle
Table 8 also shows the R coefficient for the side friction factor model of truck vehicles, which has a value of 0.802 for modeling ROR and 0.833 for modeling ROR and speed.
| Model | R | R2 | Adjusted R2 | Std. error of the estimate | Durbin–Watson |
|---|---|---|---|---|---|
| 1 | 0.802a | 0.642 | 0.632 | 0.37260 | |
| 2 | 0.833b | 0.694 | 0.675 | 0.35011 | 2.564 |
- Note: Dependent variable is fy.
- aPredictor: constant and ROR.
- bPredictor: constant, ROR, and speed.
The results of the ANOVA test for the truck side friction factor model are represented in Table 9, where the F value is equal to 61.085 and 37.344 for modeling ROR and modeling ROR and speed, respectively. Also, the results related to the coefficients of the current model are presented in Table 10.
| Model | Sum of squares | df | Mean square | F | Sig. | |
|---|---|---|---|---|---|---|
| 1 | Regression | 8.480 | 1 | 8.480 | 61.085 | 0.000a |
| Residual | 4.720 | 34 | 0.139 | |||
| Total | 13.200 | 35 | ||||
| 2 | Regression | 9.155 | 2 | 4.578 | 37.344 | 0.000b |
| Residual | 4.045 | 33 | 0.123 | |||
| Total | 13.200 | 35 | ||||
- aPredictor: constant and ROR.
- bPredictor: constant, ROR, and speed.
| Model | Unstandardized coefficient | Standardized coefficient | t | Sig. | ||
|---|---|---|---|---|---|---|
| B | Std. error | Beta | ||||
| 1 | Constant | −1.346 | 0.174 | −7.756 | 0.000 | |
| ROR | 0.075 | 0.010 | 0.802 | 7.816 | 0.000 | |
| 2 | Constant | −2.185 | 0.393 | −5.562 | 0.000 | |
| ROR | 0.075 | 0.009 | 0.802 | 8.318 | 0.000 | |
| Speed | 0.008 | 0.004 | 0.226 | 2.347 | 0.025 | |
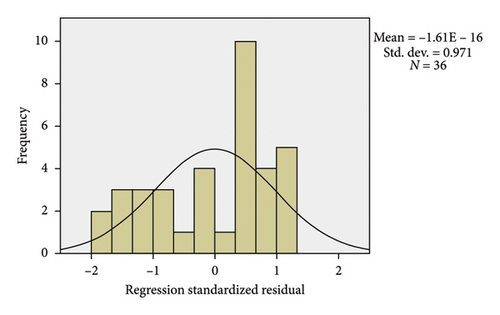
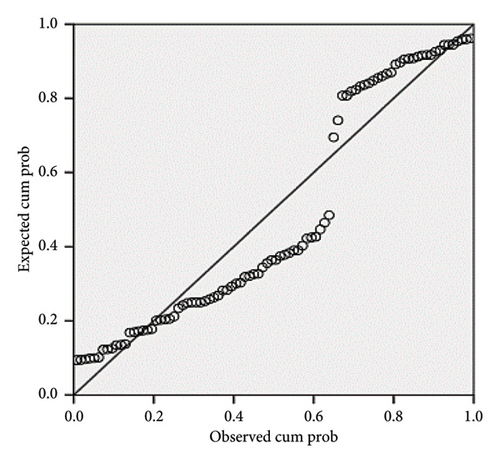
The results related to the histogram diagram of the side friction factor model of the truck vehicle over the horizontal curve are presented in Figure 23. Figure 24 also shows the correlation diagram for this model for the truck vehicle, where the model and the input data have an appropriate correlation, so that the R value of this model is equal to 0.833.
3.3.2. Side Friction Factor Modeling for Vertical Curves
3.3.2.1. Sedan Vehicle
| Model | R | R2 | Adjusted R2 | Std. error of the estimate | Durbin–Watson |
|---|---|---|---|---|---|
| 1 | 0.826a | 0.683 | 0.679 | 0.46165 | |
| 2 | 0.844b | 0.713 | 0.706 | 0.44185 | |
| 3 | 0.856c | 0.733 | 0.723 | 0.42877 | 2.319 |
- Note: Dependent variable is fy.
- aPredictor: constant and ROR.
- bPredictor: constant, ROR, and speed.
- cPredictor: constant, ROR, speed, and foreslope.
In Table 12, the results of the ANOVA test for the side friction factor model of the Sedan vehicle for the vertical curve are illustrated; in this Table 12, the value of F equals 189.563, 107.999, and 78.590, respectively, for ROR modeling, ROR and speed modeling, and ROR, speed, and foreslope modeling. Also, the results related to the coefficients of the Sedan vehicle side friction factor model for vertical curves are presented in Table 13.
| Model | Sum of squares | df | Mean square | F | Sig. | |
|---|---|---|---|---|---|---|
| 1 | Regression | 40.401 | 1 | 40.401 | 189.563 | 0.000a |
| Residual | 18.755 | 88 | 0.213 | |||
| Total | 59.155 | 89 | ||||
| 2 | Regression | 42.170 | 2 | 21.085 | 107.999 | 0.000b |
| Residual | 16.985 | 87 | 0.195 | |||
| Total | 59.155 | 89 | ||||
| 3 | Regression | 43.345 | 3 | 14.448 | 78.590 | 0.000c |
| Residual | 15.811 | 86 | 0.184 | |||
| Total | 59.155 | 89 | ||||
- aPredictor: constant and ROR.
- bPredictor: constant, ROR, and speed.
- cPredictor: constant, ROR, speed, and foreslope.
| Model | Unstandardized coefficient | Standardized coefficient | t | Sig. | ||
|---|---|---|---|---|---|---|
| B | Std. Error | Beta | ||||
| 1 | Constant | 1.610 | 0.118 | 13.643 | 0.000 | |
| ROR | −0.093 | 0.007 | −0.826 | −13.768 | 0.000 | |
| 2 | Constant | 2.872 | 0.434 | 6.615 | 0.000 | |
| ROR | −0.093 | 0.006 | −0.826 | −14.385 | 0.000 | |
| Speed | −0.014 | 0.005 | −0.173 | −3.011 | 0.003 | |
| 3 | Constant | 2.757 | 0.424 | 6.507 | 0.000 | |
| ROR | −0.093 | 0.006 | −0.826 | −14.824 | 0.000 | |
| Speed | −0.014 | 0.005 | −0.173 | −3.103 | 0.003 | |
| Foreslope | 0.003 | 0.001 | 0.141 | 2.528 | 0.013 | |
In Figure 25, the results of the histogram diagram of the side friction factor model of a Sedan vehicle are shown for vertical curves. Also, Figure 26 shows the correlation diagram of the side friction factor model of a Sedan vehicle. According to Figure 26, all the input data are located around the model line, which indicates the validity of the model, so that the R value for this model is equal to 0.856.
3.3.2.2. SUV Vehicle
| Model | R | R2 | Adjusted R2 | Std. error of the estimate | Durbin–Watson |
|---|---|---|---|---|---|
| 1 | 0.715a | 0.512 | 0.506 | 0.56167 | |
| 2 | 0.750b | 0.563 | 0.553 | 0.53456 | 2.437 |
- Note: Dependent variable is fy.
- aPredictor: constant and ROR.
- bPredictor: constant, ROR, and foreslope.
Table 15 illustrates the results of the ANOVA test for modeling of the side friction factor of SUV vehicles in vertical curves, and the F value of 92.230 and 55.988 was obtained for modeling ROR and modeling ROR and foreslope, respectively. Also, the results related to the coefficients of the SUV side friction factor model for vertical curves are represented in Table 16.
| Model | Sum of squares | df | Mean square | F | Sig. | |
|---|---|---|---|---|---|---|
| 1 | Regression | 29.096 | 1 | 29.096 | 92.230 | 0.000a |
| Residual | 27.761 | 88 | 0.315 | |||
| Total | 56.857 | 89 | ||||
| 2 | Regression | 31.997 | 2 | 15.998 | 55.988 | 0.000b |
| Residual | 24.860 | 87 | 0.286 | |||
| Total | 56.857 | 89 | ||||
- aPredictor: constant and ROR.
- bPredictor: constant, ROR, and foreslope.
| Model | Unstandardized coefficients | Standardized coefficients | t | Sig. | ||
|---|---|---|---|---|---|---|
| B | Std. error | Beta | ||||
| 1 | Constant | 1.284 | 0.144 | 8.947 | 0.000 | |
| ROR | −0.079 | 0.008 | −0.715 | −9.604 | 0.000 | |
| 2 | Constant | 1.104 | 0.148 | 7.467 | 0.000 | |
| ROR | −0.079 | 0.008 | −0.715 | −10.091 | 0.000 | |
| Foreslope | 0.004 | 0.001 | 0.226 | 3.186 | 0.002 | |
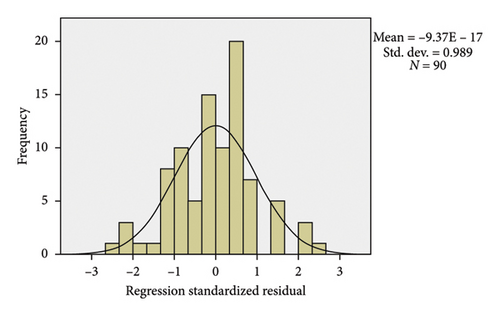
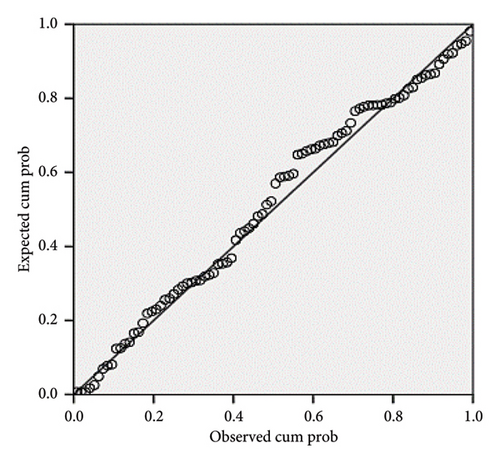
Figure 27 shows the result of the histogram diagram of the side friction factor model of the SUV vehicle for vertical curves. Figure 28 also shows the correlation diagram for this model for the SUV vehicle, in which all the data are located around the fit line, which shows the validity of the model, so that the R value for this model is equal to 0.750.
3.3.2.3. Truck Vehicle
| Model | R | R2 | Adjusted R2 | Std. error of the estimate | Durbin–Watson |
|---|---|---|---|---|---|
| 1 | 0.810a | 0.656 | 0.652 | 0.36990 | |
| 2 | 0.862b | 0.744 | 0.738 | 0.32094 | 2.821 |
- Note: Dependent variable is fy.
- aPredictor: constant and ROR.
- bPredictor: constant, ROR, and speed.
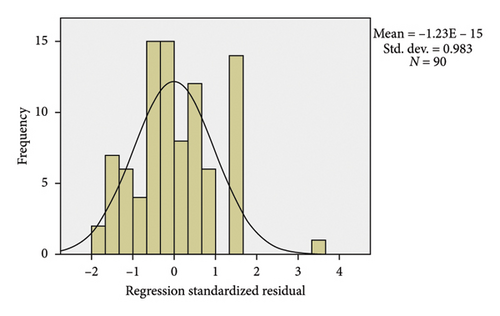
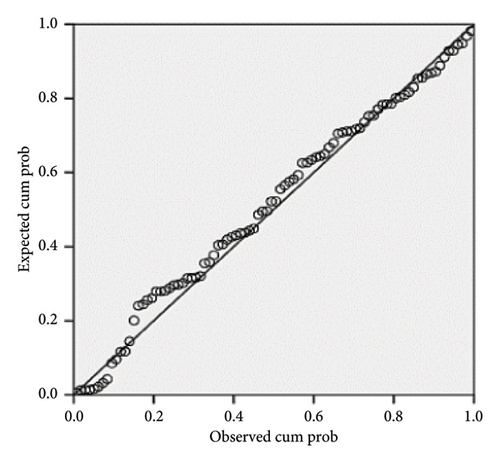
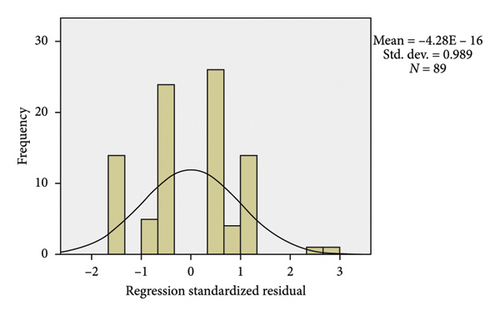
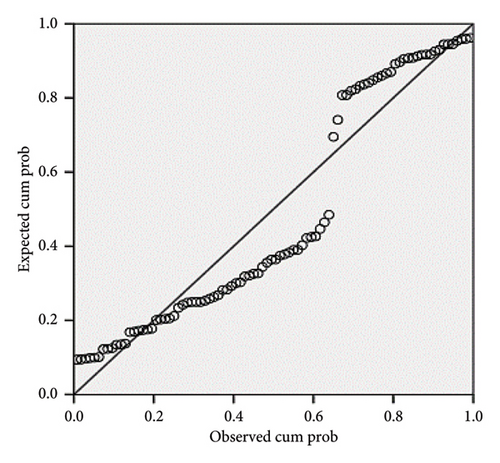
For the truck side friction factor model on vertical curves, ANOVA test results are represented in Table 18, according to which the F value is equal to 165.766 and 124.884 for modeling ROR and modeling ROR and speed, respectively. Also, the results related to the coefficients of this model are indicated in Table 19. Figure 29 shows the result of the histogram diagram of the side friction factor model for truck vehicles in vertical curves. Also, Figure 30 shows the correlation diagram for this model, which indicates the proper correlation of the data in the model according to R equal to 0.862.
| Model | Sum of squares | df | Mean square | F | Sig. | |
|---|---|---|---|---|---|---|
| 1 | Regression | 22.681 | 1 | 22.681 | 165.766 | 0.000a |
| Residual | 11.904 | 87 | 0.137 | |||
| Total | 34.585 | 88 | ||||
| 2 | Regression | 25.727 | 2 | 12.863 | 124.884 | 0.000b |
| Residual | 8.858 | 86 | 0.103 | |||
| Total | 34.585 | 88 | ||||
- aPredictor: constant and ROR.
- bPredictor: constant, ROR, and speed.
| Model | Unstandardized coefficient | Standardized coefficient | t | Sig. | ||
|---|---|---|---|---|---|---|
| B | Std. error | Beta | ||||
| 1 | Constant | 1.136 | 0.096 | 11.871 | 0.000 | |
| ROR | −0.071 | 0.005 | −0.810 | −12.875 | 0.000 | |
| 2 | Constant | 2.809 | 0.319 | 8.815 | 0.000 | |
| ROR | −0.071 | 0.005 | −0.814 | −14.910 | 0.000 | |
| Speed | −0.019 | 0.003 | −0.297 | −5.438 | 0.000 | |
4. Conclusion
- •
For horizontal curves, the first third of the beginning of the curve was found to be the most dangerous part of the horizontal curves when vehicles exit the curves. The reason for this is the sudden deviations of the vehicle and the steering angle at high speeds, i.e., 100 and 120 km/h.
- •
Examining the rolling points of vehicles in vertical curves shows that the departure angle of 15 and 25° for the vehicle and the foreslopes of 1: 3 and 1: 4 had the greatest effect on these points, in such a way, that by softening the foreslopes of 1: 4 and 1: 10, the rolling point is far away from the convexity and concavity of curves, and the vehicle will be able to return to the path of movement more, or it overturns at a higher departure angle (25°) at about one-third of the point of concavity or convexity of the vertical curve.
- •
Force distributions on each axle (46% left and 54% right) and vehicle wheels (26% L1, 27% R1, 23% L2, and 24% R2) were observed to be different from each other. AASHTO’s point mass model assumes that the forces are exerted on the wheels of vehicles in a balanced and equal manner. Also, it is possible for the rear axle to skid more if braking force is applied to the front axle, as most of the vertical force is transferred to the front axle.
- •
In the comparison between various vehicles in the simulation results, it was evident that in all defined conditions, the truck vehicle has less skidding potential at all speeds because its side friction factor is less than that of Sedans and SUVs, since the truck vehicle, being heavier than the other two vehicles, exerts a more vertical force on wheels, and as a result, the side friction factor created between the pavement and wheels of this vehicle will be reduced.
- •
Side friction factors were associated with an increment on all steeper slopes of the foreslope, which was more apparent on 1: 3 slopes. Thus, skidding will become more likely as the margin of safety (difference between side frictions and available frictions) of vehicles on these types of foreslopes decreases.
- •
Vehicles have significantly different side friction factors on their rear and front axles. In passenger vehicles, the rear axle plays a critical role, but in the truck vehicle, it takes the opposite role. This is also expected to be caused by the truck’s different suspension system compared to passenger vehicles, as well as the truck’s 6.7-ton loading that enters the rear axle of the truck. Passenger vehicles’ rear axle side friction factors were measured to be three times greater than their front axles in some cases.
- •
The result of the regression modeling of side friction factors in horizontal and vertical curves in different vehicles shows the suitable correlation in the performed models with input data and the good fit of the regression equation to the dataset, which shows the validity of the model. The significant effect of variables such as ROR, speed, and foreslope on the side friction factor prediction model was shown in these models.
- •
For future research directions, it is recommended to extend the scope of this study to include other types of curves, such as spiral curves, and other types of foreslopes, such as ditch and barrier foreslopes. Also, the simulation results can be validated with real-world data and experiments to compare the performance of the proposed models with the existing ones. Moreover, the effects of other variables, such as road surface condition, weather, driver behavior, and vehicle load, can be investigated for the safety of curves and foreslopes.
5. Contributions, Limitations, and Future Research Directions
This research makes several significant contributions to the field of road safety and vehicle dynamics. First, it enhances the understanding of how different departure angles, speeds, and foreslope slopes affect vehicle stability on curves. This detailed analysis provides crucial insights for engineers and designers aiming to improve road safety and vehicle performance. Second, the study develops multiple regression models for predicting side friction factors for different vehicle types. These models serve as valuable tools for road designers and safety engineers, offering a method to estimate side friction factors based on key variables. Lastly, the research identifies specific conditions, such as departure angles and foreslope slopes that significantly impact vehicle stability. These actionable insights can inform road design and safety measures, potentially reducing the risk of accidents.
This study primarily relies on simulations using CarSim and TruckSim, which, while advanced, may not fully capture the complexity of real-world driving conditions. The accuracy of the results is contingent upon the precision of the simulation models and the assumptions made during the simulation process. In addition, the study focuses on three types of vehicles: Sedans, SUVs, and trucks, excluding other vehicle types such as motorcycles and buses, which may limit the generalizability of the findings. Environmental factors such as weather conditions, road surface conditions, and lighting were not considered in the simulations, which could significantly influence vehicle dynamics and side friction factors. These limitations suggest that while the findings provide valuable insights, they should be interpreted with caution and validated with real-world data.
Future research should aim to broaden the scope of this study by including a wider variety of vehicle types, such as motorcycles, buses, and electric vehicles, to ensure that the findings are applicable across different vehicle categories. In addition, investigating other types of curves, such as spiral curves, and different foreslope designs, such as ditch and barrier foreslopes, would provide a more comprehensive understanding of vehicle dynamics. Incorporating environmental variables such as weather conditions, road surface conditions, and lighting in future simulations would enhance the robustness of the findings. Real-world validation of the simulation results through field experiments and data collection would also strengthen the reliability of the predictive models. Furthermore, investigating the effects of other variables, such as road surface condition, weather, driver behavior, and vehicle load, on the safety of curves and foreslopes would provide valuable insights for improving road safety.
Conflicts of Interest
The authors declare no conflicts of interest.
Author Contributions
Ali Abdi Kordani: conceptualization, project administration, and supervision. Ali Attari: methodology, data curation, and writing–original draft. Seyed Mohsen Hosseinian: methodology, investigation, writing, review, and editing.
Funding
The authors received no financial support for the research, authorship, and/or publication of this article.
Appendix A
A detailed analysis of the forces acting on the wheels of different vehicle types (Sedan, SUV, and tuck) under various conditions. Tables A1, A2, A3, A4, A5, A6, A7, A8, A9, A10, A11, A12, A13, A14, and A15 provide comprehensive data on the forces experienced by the wheels at different speeds and curve types, both vertical and horizontal. Additionally, the side and longitudinal friction factors obtained from simulations for vertical and horizontal curves on foreslopes are documented in Tables A16 and A17.
| Input | ||||||||||||
|---|---|---|---|---|---|---|---|---|---|---|---|---|
| Mu | V | Foreslope | Grade | ROR behavior (deg) | ||||||||
| 1: 3 | 1: 4 | 1: 10 | (−2, +2) | (−2, +6) | (−6, +2) | (−6, +6) | (+6, -6) | 0–7.5 | 0–15 | 0–25 | ||
| 0.9 | 80 | Yes | Yes | Yes | ||||||||
| 0.9 | 80 | Yes | Yes | Yes | ||||||||
| 0.9 | 80 | Yes | Yes | Yes | ||||||||
| 0.9 | 80 | Yes | Yes | Yes | ||||||||
| 0.9 | 80 | Yes | Yes | Yes | ||||||||
| 0.9 | 80 | Yes | Yes | Yes | ||||||||
| 0.9 | 80 | Yes | Yes | Yes | ||||||||
| 0.9 | 80 | Yes | Yes | Yes | ||||||||
| 0.9 | 80 | Yes | Yes | Yes | ||||||||
| 0.9 | 80 | Yes | Yes | Yes | ||||||||
| 0.9 | 80 | Yes | Yes | Yes | ||||||||
| 0.9 | 80 | Yes | Yes | Yes | ||||||||
| 0.9 | 80 | Yes | Yes | Yes | ||||||||
| 0.9 | 80 | Yes | Yes | Yes | ||||||||
| 0.9 | 80 | Yes | Yes | Yes | ||||||||
| 0.9 | 80 | Yes | Yes | Yes | ||||||||
| 0.9 | 80 | Yes | Yes | Yes | ||||||||
| 0.9 | 80 | Yes | Yes | Yes | ||||||||
| 0.9 | 80 | Yes | Yes | Yes | ||||||||
| 0.9 | 80 | Yes | Yes | Yes | ||||||||
| 0.9 | 80 | Yes | Yes | Yes | ||||||||
| 0.9 | 80 | Yes | Yes | Yes | ||||||||
| 0.9 | 80 | Yes | Yes | Yes | ||||||||
| 0.9 | 80 | Yes | Yes | Yes | ||||||||
| 0.9 | 80 | Yes | Yes | Yes | ||||||||
| 0.9 | 80 | Yes | Yes | Yes | ||||||||
| 0.9 | 80 | Yes | Yes | Yes | ||||||||
| 0.9 | 80 | Yes | Yes | Yes | ||||||||
| 0.9 | 80 | Yes | Yes | Yes | ||||||||
| 0.9 | 80 | Yes | Yes | Yes | ||||||||
| 0.9 | 80 | Yes | Yes | Yes | ||||||||
| 0.9 | 80 | Yes | Yes | Yes | ||||||||
| 0.9 | 80 | Yes | Yes | Yes | ||||||||
| 0.9 | 80 | Yes | Yes | Yes | ||||||||
| 0.9 | 80 | Yes | Yes | Yes | ||||||||
| 0.9 | 80 | Yes | Yes | Yes | ||||||||
| 0.9 | 80 | Yes | Yes | Yes | ||||||||
| 0.9 | 80 | Yes | Yes | Yes | ||||||||
| 0.9 | 80 | Yes | Yes | Yes | ||||||||
| 0.9 | 80 | Yes | Yes | Yes | ||||||||
| 0.9 | 80 | Yes | Yes | Yes | ||||||||
| 0.9 | 80 | Yes | Yes | Yes | ||||||||
| 0.9 | 80 | Yes | Yes | Yes | ||||||||
| 0.9 | 80 | Yes | Yes | Yes | ||||||||
| 0.9 | 80 | Yes | Yes | Yes | ||||||||
| Output | ||||||||||||
| Fy | Fz | Fx | ||||||||||
| L1 | R1 | L2 | R2 | L1 | R1 | L2 | R2 | L1 | R1 | L2 | R2 | |
| 1216.8 | 6545.6 | 1173.9 | 5733.5 | 1265.3 | 7386.5 | 1276 | 6845.2 | 345.56 | 299.37 | 365.21 | 304.14 | |
| 1548.7 | 6702.1 | 842.81 | 5617.6 | 1605.2 | 7522.1 | 936.49 | 6772.4 | −50.233 | −182.36 | −91.976 | −223.9 | |
| −6818 | −1853 | −4366 | −1607 | 7988.3 | 1911 | 5809.4 | 1842,7 | 253.98 | 369.38 | 276.79 | 377.01 | |
| 1133.2 | 6505 | 1284.6 | 5634.7 | 1236.2 | 7244.5 | 1418.2 | 6762.5 | 506.37 | 515.94 | 576.01 | 542.91 | |
| 1544.4 | 6611.4 | 934.75 | 5381.7 | 1574.7 | 7382.3 | 1063.7 | 6731.7 | 105.19 | 21.592 | 90.774 | 0 | |
| −6614 | −1177 | −4242 | −1585 | 7983 | 1263.1 | 5920.6 | 1954.1 | 330.81 | 468.51 | 389.29 | 488.25 | |
| 1433.4 | 6623.4 | 959.88 | 5868.8 | 1445.2 | 7490.9 | 975.04 | 6715.5 | −61.301 | −191.05 | −69.499 | −191.9 | |
| 1737.5 | 6683.2 | 847.28 | 5558.3 | 1794.9 | 7483.7 | 948.25 | 6748.1 | −55.918 | −184.38 | −94.026 | −224.9 | |
| −7040 | −692.8 | −5265 | −1060 | 8400.9 | 698.7 | 6418.3 | 1151.9 | −219.42 | −45.367 | −211.38 | −86.23 | |
| 1508.1 | 6445.5 | 1042.5 | 5435 | 1526.3 | 7331.3 | 1057.1 | 6450.8 | −53.601 | −178.93 | −57.679 | −173.2 | |
| 1442.3 | 6603.6 | 871.3 | 5386.4 | 1486.1 | 7369.5 | 967.86 | 6624.7 | −42.859 | −170.61 | −83.538 | −209.5 | |
| −6801 | −1473 | −5578 | −1090 | 8595 | 1499.1 | 6734.9 | 1305.4 | −222.82 | −62.985 | −207.95 | −80.97 | |
| 1607.3 | 6779 | 953.03 | 6235.6 | 1619.8 | 7722.1 | 975.72 | 6968.6 | −87.697 | −216.7 | −92.383 | −217.7 | |
| 1486.7 | 6760.5 | 823.91 | 5713.3 | 1537.6 | 7602.3 | 918.3 | 6835.7 | −66.513 | −207.2 | −111.08 | −249.7 | |
| −6291 | −1284 | −5324 | −1106 | 7075.8 | 1403.5 | 6404.3 | 1153.5 | 269.19 | 317.36 | 251.63 | 323.77 | |
| 1894.6 | 6011.1 | 1351 | 4891.4 | 2043.4 | 7200 | 1596.7 | 6532.6 | 363.58 | 270.64 | 349.82 | 271.5 | |
| 1823.5 | 6824.2 | 828.51 | 5843.2 | 1914.9 | 7695 | 931.75 | 6947 | −46.153 | −180.26 | −85.408 | −223.4 | |
| −6818 | −1853 | −4366 | −1607 | 7988.3 | 1911 | 5809.4 | 1842.7 | 253.98 | 369.38 | 276.79 | 377.01 | |
| 1778 | 6039.6 | 1362 | 4803.8 | 1934.5 | 7184.8 | 1660.2 | 6567.2 | 510.51 | 436.05 | 508.52 | 441.92 | |
| 1357.6 | 6667.5 | 1026 | 5469.9 | 1412.6 | 7466.4 | 1225.8 | 6932 | 280.23 | 242.07 | 320.25 | 240.96 | |
| −6614 | −1177 | −4242 | −1585 | 7983 | 1263.1 | 5920.6 | 1954.1 | 330.81 | 468.51 | 389.29 | 488.25 | |
| 1805.1 | 5944.4 | 1109.6 | 5193.7 | 1943.7 | 7255.4 | 1232 | 6497.4 | −186.56 | −79.121 | −199.42 | −76.5 | |
| 1825 | 6805 | 836.58 | 5788.5 | 1901.9 | 7657.4 | 946.97 | 6920.9 | −48.192 | −182.45 | −87.155 | −224.3 | |
| −7040 | −692.8 | −5265 | −1060 | 8400.9 | 698.7 | 6418.3 | 1151.9 | −219.42 | −45.367 | −211.38 | −86.23 | |
| 1779.2 | 5685 | 1147.2 | 4890.7 | 1979.7 | 7099.8 | 1290.5 | 6334.9 | −68.583 | −185.87 | −64.946 | −171.7 | |
| 1810.3 | 6731.7 | 850.38 | 5608.1 | 1875 | 7555.5 | 962.19 | 6811.1 | −39.025 | −171.08 | −75.102 | −208.9 | |
| −6801 | −1473 | −5578 | −1090 | 8595 | 1499.1 | 6734.9 | 1305.4 | −222.82 | −62.985 | −207.95 | −80.97 | |
| 2007.8 | 6045.6 | 1012.3 | 5692.8 | 2170.9 | 7524.7 | 1175.5 | 6918.7 | −104.78 | −227.75 | −99.459 | −217.8 | |
| 1865.9 | 6900.9 | 812.07 | 5887.1 | 1944.3 | 7796.1 | 919.68 | 7032.3 | −67.549 | −207.97 | −104.48 | −249.5 | |
| −6291 | −1284 | −5324 | −1106 | 7075.8 | 1403.5 | 6404.3 | 1153.5 | 269.19 | 317.36 | 251.63 | 323.77 | |
| 1907.2 | 4526.7 | 1182.5 | 4037.6 | 2501.8 | 6841.4 | 1954.2 | 6435.2 | 282.65 | 188.5 | 277.41 | 193.44 | |
| 1789.3 | 6818.7 | 1024.8 | 5627.5 | 1880.3 | 7684.5 | 1229.1 | 7131.7 | 312.78 | 221.98 | 309.31 | 207.78 | |
| −6818 | −1853 | −4366 | −1607 | 7988.3 | 1911 | 5809.4 | 1842.7 | 253.98 | 369.38 | 276.79 | 377.01 | |
| 1813.6 | 4510.9 | 1264.8 | 3890.7 | 2359.6 | 6677.9 | 2022.7 | 6402.7 | 481.31 | 395.11 | 474.46 | 399.45 | |
| 1587.7 | 6714.4 | 1090.8 | 5403.8 | 1676.9 | 7543.5 | 1369 | 7093.8 | 443.81 | 400.04 | 494.71 | 413.14 | |
| −6614 | −1177 | −4242 | −1585 | 7983 | 1263.1 | 5920.6 | 1954.1 | 330.81 | 468.51 | 389.29 | 488.25 | |
| 2002.9 | 4364.6 | 1061.7 | 4050.2 | 2679 | 6869.1 | 1792.7 | 6236.2 | −93.887 | −197.46 | −87.211 | −185 | |
| 1940.1 | 6885.9 | 851.6 | 5772.4 | 2017.7 | 7787.2 | 1001.4 | 7014.5 | −40.615 | −185.61 | −74.229 | −220.1 | |
| −7040 | −692.8 | −5265 | −1060 | 8400.9 | 698.7 | 6418.3 | 1151.9 | −219.42 | −45.367 | −211.38 | −86.23 | |
| 1992.8 | 3993.5 | 1004.1 | 3677.7 | 2750.2 | 6665.1 | 1911.7 | 6034.1 | −82.988 | −180.03 | −76.847 | −168.9 | |
| 1908.2 | 6807.2 | 853.41 | 5661 | 1976 | 7674.2 | 996.98 | 6905.8 | −30.879 | −174.31 | −60.855 | −204.6 | |
| −6801 | −1473 | −5578 | −1090 | 8595 | 1499.1 | 6734.9 | 1305.4 | −222.82 | −62.985 | −207.95 | −80.97 | |
| 2116.3 | 4580 | 1037.9 | 4432.3 | 2787.6 | 7201.5 | 1782.8 | 6527.6 | −119.44 | −226.23 | −109.92 | −211.2 | |
| 1998 | 7021.7 | 854.47 | 5970.7 | 2102 | 7973.5 | 979.43 | 7183.5 | −58.611 | −210.21 | −94.236 | −248 | |
| −6291 | −1284 | −5324 | −1106 | 7075.8 | 1403.5 | 6404.3 | 1153.5 | 269.19 | 317.36 | 251.63 | 323.77 | |
| Input | ||||||||||||
|---|---|---|---|---|---|---|---|---|---|---|---|---|
| Mu | V | Foreslope | Grade | ROR behavior (deg) | ||||||||
| 1: 3 | 1: 4 | 1: 10 | (−2, +2) | (−2, +6) | (−6, +2) | (−6, +6) | (+6, −6) | 0–7.5 | 0–15 | 0–25 | ||
| 0.9 | 100 | Yes | Yes | Yes | ||||||||
| 0.9 | 100 | Yes | Yes | Yes | ||||||||
| 0.9 | 100 | Yes | Yes | Yes | ||||||||
| 0.9 | 100 | Yes | Yes | Yes | ||||||||
| 0.9 | 100 | Yes | Yes | Yes | ||||||||
| 0.9 | 100 | Yes | Yes | Yes | ||||||||
| 0.9 | 100 | Yes | Yes | Yes | ||||||||
| 0.9 | 100 | Yes | Yes | Yes | ||||||||
| 0.9 | 100 | Yes | Yes | Yes | ||||||||
| 0.9 | 100 | Yes | Yes | Yes | ||||||||
| 0.9 | 100 | Yes | Yes | Yes | ||||||||
| 0.9 | 100 | Yes | Yes | Yes | ||||||||
| 0.9 | 100 | Yes | Yes | Yes | ||||||||
| 0.9 | 100 | Yes | Yes | Yes | ||||||||
| 0.9 | 100 | Yes | Yes | Yes | ||||||||
| 0.9 | 100 | Yes | Yes | Yes | ||||||||
| 0.9 | 100 | Yes | Yes | Yes | ||||||||
| 0.9 | 100 | Yes | Yes | Yes | ||||||||
| 0.9 | 100 | Yes | Yes | Yes | ||||||||
| 0.9 | 100 | Yes | Yes | Yes | ||||||||
| 0.9 | 100 | Yes | Yes | Yes | ||||||||
| 0.9 | 100 | Yes | Yes | Yes | ||||||||
| 0.9 | 100 | Yes | Yes | Yes | ||||||||
| 0.9 | 100 | Yes | Yes | Yes | ||||||||
| 0.9 | 100 | Yes | Yes | Yes | ||||||||
| 0.9 | 100 | Yes | Yes | Yes | ||||||||
| 0.9 | 100 | Yes | Yes | Yes | ||||||||
| 0.9 | 100 | Yes | Yes | Yes | ||||||||
| 0.9 | 100 | Yes | Yes | Yes | ||||||||
| 0.9 | 100 | Yes | Yes | Yes | ||||||||
| 0.9 | 100 | Yes | Yes | Yes | ||||||||
| 0.9 | 100 | Yes | Yes | Yes | ||||||||
| 0.9 | 100 | Yes | Yes | Yes | ||||||||
| 0.9 | 100 | Yes | Yes | Yes | ||||||||
| 0.9 | 100 | Yes | Yes | Yes | ||||||||
| 0.9 | 100 | Yes | Yes | Yes | ||||||||
| 0.9 | 100 | Yes | Yes | Yes | ||||||||
| 0.9 | 100 | Yes | Yes | Yes | ||||||||
| 0.9 | 100 | Yes | Yes | Yes | ||||||||
| 0.9 | 100 | Yes | Yes | Yes | ||||||||
| 0.9 | 100 | Yes | Yes | Yes | ||||||||
| 0.9 | 100 | Yes | Yes | Yes | ||||||||
| 0.9 | 100 | Yes | Yes | Yes | ||||||||
| 0.9 | 100 | Yes | Yes | Yes | ||||||||
| 0.9 | 100 | Yes | Yes | Yes | ||||||||
| Output | ||||||||||||
| Fy | Fz | Fx | ||||||||||
| L1 | R1 | L2 | R2 | L1 | R1 | L2 | R2 | L1 | R1 | L2 | R2 | |
| 1485 | 6568.8 | 1197.2 | 5892.2 | 1584 | 7391 | 1267.2 | 6814.9 | 353.75 | 345.16 | 367.16 | 335.1 | |
| −4397 | −1970 | −4591 | −1257 | 7131.9 | 2712.6 | 6813.8 | 2100.5 | 149.85 | 241.96 | 154.17 | 237.77 | |
| −6983 | −1781 | −6323 | −1214 | 7921.6 | 1903.3 | 7608 | 1340.7 | 332.62 | 404.56 | 3187.84 | 402.91 | |
| 1341.5 | 6459.8 | 1271.7 | 5399.7 | 1443.4 | 7220.5 | 1395.8 | 6611.9 | 410.62 | 420.32 | 469.05 | 436.58 | |
| −4207 | −2339 | −4508 | −1033 | 7165.4 | 3169.1 | 6919.7 | 2407.5 | 206.35 | 292.98 | 219.79 | 288.25 | |
| −7237 | −1948 | −6525 | −1380 | 8299.2 | 2081.6 | 7990.2 | 1559.6 | 385.55 | 466.42 | 383.82 | 475.31 | |
| 1736.5 | 6534.3 | 1006.1 | 5688.3 | 1844 | 7397.6 | 1014.2 | 6580.2 | −23.524 | −146.82 | −51.075 | −179.5 | |
| −4377 | −2526 | −4929 | −884.5 | 7441.9 | 3332.4 | 6966.6 | 2142.2 | −183.06 | −85.605 | −162.36 | −76.69 | |
| −7458 | −2163 | −6856 | −1164 | 8587.2 | 2303.7 | 7936.9 | 1228.7 | −176.23 | −21.457 | −212.71 | −59.77 | |
| 1543 | 6472.8 | 980.1 | 5540.1 | 1615.9 | 7282 | 988.61 | 6494.2 | −15.643 | −139.49 | −41.479 | −167.5 | |
| −4058 | −2720 | −4873 | −672.1 | 7691.7 | 3780.9 | 71677 | 2627.5 | −179.52 | −90.232 | −159.27 | −79.54 | |
| −7797 | −2387 | −7071 | −1362 | 9196.4 | 2505.1 | 8352.8 | 1501.9 | −187.44 | −23.614 | −210.38 | −58.29 | |
| 1746.9 | 6922.5 | 937.41 | 6378.5 | 1818.2 | 7855.2 | 952.15 | 7116.2 | −42.781 | −170.95 | −66.787 | −199.5 | |
| −5425 | −1424 | −3702 | −1357 | 6713 | 1625.4 | 4632 | 1483.8 | 32.535 | 127.68 | 51.069 | 119.27 | |
| −5291 | −1693 | −3605 | −1377 | 6353.2 | 1739.7 | 5159 | 1703 | 243.01 | 295.86 | 256.01 | 320.27 | |
| 1256.4 | 6676.7 | 1182 | 5917.2 | 1312.2 | 7513.5 | 1298.6 | 7023.1 | 370.84 | 353.06 | 408.14 | 361.46 | |
| −4397 | −1970 | −4591 | −1257 | 7131.9 | 2712.6 | 6813.8 | 2100.5 | 149.85 | 241.96 | 154.17 | 237.77 | |
| −6983 | −1781 | −6323 | −1214 | 7921.6 | 1903.3 | 7608 | 1340.7 | 332.62 | 404.56 | 318.84 | 402.91 | |
| 1060.6 | 6569.3 | 1240.2 | 5624.7 | 1136.7 | 7349.6 | 1394.4 | 6845.7 | 418.27 | 429.83 | 504.46 | 464.83 | |
| −4207 | −2339 | −4508 | −1033 | 7165.4 | 3169.1 | 6919.7 | 2407.5 | 206.35 | 292.98 | 219.79 | 288.25 | |
| −7237 | −1948 | −6525 | −1380 | 8299.2 | 2081.6 | 7990.2 | 1559.6 | 385.55 | 466.42 | 383.82 | 475.31 | |
| 1432.6 | 6761.8 | 940.72 | 6176.1 | 1448.3 | 7604.4 | 952.7 | 6890.8 | −30.416 | −159.66 | −47.119 | −172.9 | |
| −4377 | −2526 | −4929 | −884.5 | 7441.9 | 3332.4 | 6966.6 | 2142.2 | −183.06 | −85.605 | −162.36 | −76.69 | |
| −7458 | −2163 | −6856 | −1164 | 8587.2 | 2303.7 | 7946.9 | 1228.7 | −176.23 | −21.457 | −212.71 | −59.77 | |
| 1319.8 | 6652.9 | 961.89 | 5848 | 1332.5 | 7446.2 | 971.91 | 6686.7 | −22.333 | −151.13 | −38.191 | −160.6 | |
| −4058 | −2720 | −4873 | −672.1 | 7691.7 | 3780.9 | 7167.5 | 2627.5 | −179.52 | −90.232 | −159.27 | −79.54 | |
| −7797 | −2387 | −7071 | −1362 | 9196.4 | 2505.1 | 8352.8 | 1501.9 | −187.44 | −23.614 | −210.38 | −58.29 | |
| 1796.6 | 6935 | 970.37 | 6376.8 | 1817.4 | 7935 | 1004.5 | 7274 | −53.656 | −184.15 | −63.954 | −193.1 | |
| −5425 | −1424 | −3702 | −1357 | 6713 | 1625.4 | 4632 | 1483.8 | 32.535 | 127.68 | 51.069 | 119.27 | |
| −5291 | −1693 | −3605 | −1377 | 6353.2 | 1739.7 | 5159 | 1703 | 243.01 | 295.86 | 256.01 | 320.27 | |
| 1607 | 5784 | 1329.8 | 4926 | 1798 | 7151.2 | 1660.9 | 6705 | 399.69 | 310.52 | 393.62 | 317.58 | |
| 1765.5 | 6847.8 | 1024.6 | 5693.4 | 1838.8 | 7726.8 | 1232.9 | 7189 | 292.79 | 214.35 | 285.68 | 196.7 | |
| −7023 | −1279 | −5939 | −1261 | 8000 | 1320.6 | 7569.1 | 1469.2 | 170.4 | 252.52 | 180.76 | 289.55 | |
| 1876.3 | 5882.1 | 1429.6 | 4682.3 | 1489 | 6971.2 | 1718.7 | 6570 | 525.67 | 443.75 | 513.69 | 448.49 | |
| 1629.2 | 6741.8 | 1098.7 | 5561 | 1726 | 7575 | 1350.5 | 7157.3 | 430.3 | 383.91 | 460.05 | 389.81 | |
| −7237 | −1948 | −6525 | −1380 | 8299.2 | 2081.6 | 7990.2 | 1559.6 | 385.55 | 466.42 | 383.82 | 475.31 | |
| 1923.2 | 5736 | 1046.6 | 5312.7 | 2153.5 | 7264.4 | 1241.6 | 6697.8 | −54.763 | −176.39 | −52.986 | −167.6 | |
| 1891.5 | 6911.1 | 869.56 | 5857 | 1962.8 | 7817.3 | 1026.9 | 7121.3 | −14.906 | −153.76 | −57.571 | −197.1 | |
| −7458 | −2163 | −6856 | −1164 | 8587.2 | 2302.7 | 7936.9 | 1228.7 | −176.23 | −21.457 | −212.71 | −59.77 | |
| 1860.6 | 5582.4 | 1051.3 | 5065.8 | 2111.3 | 7090.5 | 1234.9 | 6519.3 | −46.003 | −166.4 | −44.172 | −157.1 | |
| 1830.7 | 6837.6 | 859.29 | 581.42 | 1902.3 | 7706.7 | 999.79 | 7009 | −7.2747 | −142.26 | −50.038 | −186.9 | |
| −7797 | −2387 | −7071 | −1362 | 9196.4 | 2505.1 | 8352.8 | 1501.9 | −187.44 | −23.614 | −210.38 | −58.29 | |
| 2155.8 | 5718.3 | 1060.4 | 5420.2 | 2448 | 7647.3 | 1428.9 | 7023.2 | −76.161 | −197.78 | −73.089 | −187.2 | |
| 1892 | 6999.7 | 857.51 | 6103.4 | 2006 | 7959.5 | 950.25 | 7227.2 | −24.122 | −166.55 | −69.59 | −218.5 | |
| 1081.6 | 7092.1 | 263.29 | 7462.1 | 1362.3 | 9269.8 | 270.62 | 8643.8 | 0 | −21.56 | −55.026 | −291.9 | |
| Input | ||||||||||||
|---|---|---|---|---|---|---|---|---|---|---|---|---|
| Mu | V | Foreslope | Grade | ROR behavior (deg) | ||||||||
| 1: 3 | 1: 4 | 1: 10 | (−2, +2) | (−2, +6) | (−6, +2) | (−6, +6) | (+6, −6) | 0–7.5 | 0–15 | 0–25 | ||
| 0.9 | 80 | Yes | Yes | Yes | ||||||||
| 0.9 | 80 | Yes | Yes | Yes | ||||||||
| 0.9 | 80 | Yes | Yes | Yes | ||||||||
| 0.9 | 80 | Yes | Yes | Yes | ||||||||
| 0.9 | 80 | Yes | Yes | Yes | ||||||||
| 0.9 | 80 | Yes | Yes | Yes | ||||||||
| 0.9 | 80 | Yes | Yes | Yes | ||||||||
| 0.9 | 80 | Yes | Yes | Yes | ||||||||
| 0.9 | 80 | Yes | Yes | Yes | ||||||||
| 0.9 | 80 | Yes | Yes | Yes | ||||||||
| 0.9 | 80 | Yes | Yes | Yes | ||||||||
| 0.9 | 80 | Yes | Yes | Yes | ||||||||
| 0.9 | 80 | Yes | Yes | Yes | ||||||||
| 0.9 | 80 | Yes | Yes | Yes | ||||||||
| 0.9 | 80 | Yes | Yes | Yes | ||||||||
| 0.9 | 80 | Yes | Yes | Yes | ||||||||
| 0.9 | 80 | Yes | Yes | Yes | ||||||||
| 0.9 | 80 | Yes | Yes | Yes | ||||||||
| 0.9 | 80 | Yes | Yes | Yes | ||||||||
| 0.9 | 80 | Yes | Yes | Yes | ||||||||
| 0.9 | 80 | Yes | Yes | Yes | ||||||||
| 0.9 | 80 | Yes | Yes | Yes | ||||||||
| 0.9 | 80 | Yes | Yes | Yes | ||||||||
| 0.9 | 80 | Yes | Yes | Yes | ||||||||
| 0.9 | 80 | Yes | Yes | Yes | ||||||||
| 0.9 | 80 | Yes | Yes | Yes | ||||||||
| 0.9 | 80 | Yes | Yes | Yes | ||||||||
| 0.9 | 80 | Yes | Yes | Yes | ||||||||
| 0.9 | 80 | Yes | Yes | Yes | ||||||||
| 0.9 | 80 | Yes | Yes | Yes | ||||||||
| 0.9 | 80 | Yes | Yes | Yes | ||||||||
| 0.9 | 80 | Yes | Yes | Yes | ||||||||
| 0.9 | 80 | Yes | Yes | Yes | ||||||||
| 0.9 | 80 | Yes | Yes | Yes | ||||||||
| 0.9 | 80 | Yes | Yes | Yes | ||||||||
| 0.9 | 80 | Yes | Yes | Yes | ||||||||
| 0.9 | 80 | Yes | Yes | Yes | ||||||||
| 0.9 | 80 | Yes | Yes | Yes | ||||||||
| 0.9 | 80 | Yes | Yes | Yes | ||||||||
| 0.9 | 80 | Yes | Yes | Yes | ||||||||
| 0.9 | 80 | Yes | Yes | Yes | ||||||||
| 0.9 | 80 | Yes | Yes | Yes | ||||||||
| 0.9 | 80 | Yes | Yes | Yes | ||||||||
| 0.9 | 80 | Yes | Yes | Yes | ||||||||
| 0.9 | 80 | Yes | Yes | Yes | ||||||||
| Output | ||||||||||||
| Fy | Fz | Fx | ||||||||||
| L1 | R1 | L2 | R2 | L1 | R1 | L2 | R2 | L1 | R1 | L2 | R2 | |
| 1323.1 | 6765.4 | 244.46 | 6003.2 | 1756.8 | 7756.5 | 389.66 | 7212.6 | 648.57 | 684.34 | 253.77 | 369.26 | |
| −3865.7 | −2054 | −2885.2 | −1035 | 7478.3 | 3258.5 | 6036.3 | 1948.4 | 98.151 | 175.24 | 81.446 | 153.51 | |
| −7314.6 | −679.72 | −5749 | −486.34 | 8613.2 | 957.14 | 6771.8 | 664.51 | 507.93 | 429.8 | 513.73 | 331.76 | |
| 1301 | 6629.3 | 277.84 | 5656 | 1733.6 | 7613.3 | 461.92 | 7047.6 | 677.91 | 722.98 | 314.57 | 435.44 | |
| −3793.9 | −2125.4 | −2849 | −1097 | 7659.3 | 3444.2 | 6242.3 | 2151.3 | 192.04 | 266.26 | 172.03 | 241.02 | |
| −7301.9 | −755.68 | −5644.6 | −491.07 | 8785.6 | 1063.5 | 6847.2 | 704.35 | 591.9 | 515.29 | 569.91 | 391.08 | |
| 1588.9 | 7035 | 2.9022 | 6157.2 | 1922.6 | 8062.8 | 4.2217 | 7004.6 | −70.396 | −186.18 | −0.2472 | −155.35 | |
| −4043 | −2259 | −3076 | −1057 | 7987.7 | 3536.5 | 6216.5 | 1906 | −188.97 | −101.76 | −182.48 | −93.972 | |
| −7736.7 | −979.46 | −5805.7 | −308.12 | 9341.9 | 1235.5 | 6572.8 | 371.21 | −174.1 | −17.462 | −206.67 | −33.61 | |
| 1626.2 | 6853.1 | 24.526 | 5998.5 | 1918.8 | 7947 | 29.72 | 6902.1 | −56.323 | −169.57 | −3.3766 | −146.69 | |
| −3892.6 | −2378 | −2979.9 | −1119.1 | 8253.5 | 3842.3 | 6408.8 | 2119.5 | −187.39 | −102.71 | −180.68 | 94.001 | |
| −7761.2 | −1079 | −6044.3 | −464.41 | 9558.3 | 1316 | 6921.9 | 547.95 | −172.62 | −17.459 | −204.64 | −42.439 | |
| 1654.2 | 7178.1 | 26.175 | 6329.5 | 2018.1 | 8303.4 | 32.865 | 7218.1 | −97.15 | −220.96 | −4.9984 | −177.61 | |
| −4094.9 | −1784 | −3447 | −532.15 | 6414.6 | 2578.1 | 54.88.1 | 799.45 | 148.31 | 231.35 | 85.244 | 147.86 | |
| −6461.7 | −1187.5 | −6021.2 | −41.955 | 7469.6 | 1675 | 7101.1 | 69.505 | 652 | 598.36 | 254.08 | 46.157 | |
| 1596.4 | 6396.3 | 395.6 | 5555.7 | 1956.2 | 7794.8 | 562.06 | 7174.5 | 570.94 | 528.4 | 290.43 | 310.16 | |
| 1670.3 | 7198.5 | 115.95 | 5451.5 | 2116.3 | 8324.3 | 140.71 | 7000.3 | −6.2841 | −132.56 | −27.555 | −208.66 | |
| −7314.6 | −679.72 | −5749 | −486.34 | 8613.2 | 957.14 | 6771.8 | 664.51 | 507.93 | 429.8 | 513.73 | 331.76 | |
| 1475.2 | 6348 | 410.19 | 5452 | 1874.6 | 7645.1 | 644.51 | 7128.4 | 714.53 | 704.19 | 401.95 | 462.81 | |
| 1425.8 | 6988.7 | 292.61 | 5270 | 1877.5 | 8006 | 434.83 | 7117.6 | 489.28 | 498.93 | 237.85 | 277.2 | |
| −7302 | −755.67 | −5644.6 | −491.07 | 8785.6 | 1063.5 | 6847.2 | 704.35 | 591.9 | 515.29 | 569.91 | 391.08 | |
| 1835.5 | 6453.1 | 183.85 | 5760.4 | 2152 | 8032.4 | 216.8 | 6977.3 | −73.725 | −193.11 | −25.75 | −164.92 | |
| 1666.5 | 7177.6 | 119.48 | 5412 | 2100 | 8288.8 | 145.61 | 6975.7 | −15.877 | −144.18 | −29.649 | −218.1 | |
| −7737 | −979.46 | −5805.7 | −308.12 | 9341.9 | 1235.5 | 6572.8 | 371.21 | −174.1 | −17.462 | −206.67 | −33.61 | |
| 1866.4 | 6084.3 | 268.88 | 5350.3 | 2213 | 7834.3 | 322.85 | 6764.9 | −56.825 | −170.56 | −30.9 | −157.08 | |
| 1607 | 7129.5 | 107.27 | 5430.1 | 2050.4 | 8195.5 | 129.63 | 6902.5 | −2.4463 | −126.2 | −25.156 | −205.91 | |
| −7761.2 | −1079 | −6044.3 | −464.41 | 9558.3 | 1316 | 6921.9 | 547.95 | −172.62 | −17.459 | −204.64 | −42.439 | |
| 1908.2 | 6668.9 | 171.81 | 6062.6 | 2226.5 | 8320.4 | 202.68 | 7241.4 | −105.61 | −231.29 | −29.234 | −181.65 | |
| 1696.5 | 7263.7 | 87.644 | 5572.1 | 2165.7 | 8449.5 | 106.85 | 7087.5 | −37.275 | −175.93 | −26.368 | −237.52 | |
| −6462 | −1188 | −6021 | −41.955 | 7469.6 | 1675 | 7101.1 | 69.505 | 652 | 598.36 | 254.08 | 46.157 | |
| 1935.8 | 4821 | 773.74 | 4133 | 2608.6 | 7487.7 | 1160.8 | 6700.1 | 408.44 | 326.46 | 308.98 | 249.38 | |
| 1488 | 7152.1 | 274.81 | 5627.9 | 1969.4 | 8255.3 | 399.98 | 7355.9 | 509.91 | 499.79 | 219.25 | 249.45 | |
| −7314.6 | −679.72 | −5749 | −486.34 | 8613.2 | 957.14 | 6771.8 | 664.51 | 507.93 | 429.8 | 513.73 | 331.76 | |
| 1837.9 | 4834.7 | 776.07 | 4050.9 | 2487.7 | 7337.7 | 1222.2 | 6660.3 | 5592.7 | 487.38 | 439.95 | 395.87 | |
| 1446.7 | 7072.3 | 315.73 | 5352.6 | 1919.7 | 8120.1 | 495.49 | 7266.3 | 577.52 | 585.08 | 302.22 | 352.81 | |
| −7302 | −755.68 | −5644.6 | −491.07 | 8785.6 | 1063.5 | 6847.2 | 704.35 | 591.9 | 515.29 | 569.91 | 391.08 | |
| 2083.5 | 4686.7 | 663 | 4113.3 | 2834.7 | 7595.4 | 934.31 | 7449 | −79.434 | −182.7 | −62.869 | −171.15 | |
| 1679.4 | 7256 | 98.511 | 5765.9 | 2162.3 | 8438.4 | 117.53 | 7135.6 | −0.6191 | −139.87 | −22.124 | −218.08 | |
| −7736.7 | −979.46 | −5805.7 | −308.12 | 9341.9 | 1235.5 | 6572.8 | 371.21 | −174.1 | −17.462 | −206.67 | −33.61 | |
| 2040.2 | 4358.7 | 710.87 | 3741.7 | 2896.2 | 7382.8 | 1060.4 | 6238.8 | −67.065 | −164.14 | −56.563 | −156.72 | |
| 1735.9 | 7204.2 | 125.64 | 5804.8 | 2191.4 | 8333.1 | 150.54 | 7107.6 | −53.438 | −158.91 | −31.716 | −169.24 | |
| −7761.2 | −1079 | −6044.3 | −464.41 | 9558.3 | 1316 | 6921.9 | 547.95 | −172.62 | −17.459 | −204.64 | −42.439 | |
| 2184 | 4947.7 | 667.45 | 4442.3 | 2918.6 | 7942.2 | 910.39 | 6768.7 | −105.61 | −215.28 | −78.012 | −195.59 | |
| 1778.6 | 7380.1 | 90.016 | 5869.4 | 2262 | 8668.4 | 108.09 | 7303.1 | −26.444 | −175.93 | −23.795 | −238.38 | |
| 1630.3 | 7201.3 | 114.22 | 5375.2 | 2129.3 | 8347.6 | 140.44 | 6964.1 | −7.88 | −154.96 | −33.786 | −253.71 | |
| Input | ||||||||||||
|---|---|---|---|---|---|---|---|---|---|---|---|---|
| Mu | V | Foreslope | Grade | ROR behavior (deg) | ||||||||
| 1: 3 | 1: 4 | 1: 10 | (−2, +2) | (−2, +6) | (−6, +2) | (−6, +6) | (+6, −6) | 0–7.5 | 0–15 | 0–25 | ||
| 0.9 | 100 | Yes | Yes | Yes | ||||||||
| 0.9 | 100 | Yes | Yes | Yes | ||||||||
| 0.9 | 100 | Yes | Yes | Yes | ||||||||
| 0.9 | 100 | Yes | Yes | Yes | ||||||||
| 0.9 | 100 | Yes | Yes | Yes | ||||||||
| 0.9 | 100 | Yes | Yes | Yes | ||||||||
| 0.9 | 100 | Yes | Yes | Yes | ||||||||
| 0.9 | 100 | Yes | Yes | Yes | ||||||||
| 0.9 | 100 | Yes | Yes | Yes | ||||||||
| 0.9 | 100 | Yes | Yes | Yes | ||||||||
| 0.9 | 100 | Yes | Yes | Yes | ||||||||
| 0.9 | 100 | Yes | Yes | Yes | ||||||||
| 0.9 | 100 | Yes | Yes | Yes | ||||||||
| 0.9 | 100 | Yes | Yes | Yes | ||||||||
| 0.9 | 100 | Yes | Yes | Yes | ||||||||
| 0.9 | 100 | Yes | Yes | Yes | ||||||||
| 0.9 | 100 | Yes | Yes | Yes | ||||||||
| 0.9 | 100 | Yes | Yes | Yes | ||||||||
| 0.9 | 100 | Yes | Yes | Yes | ||||||||
| 0.9 | 100 | Yes | Yes | Yes | ||||||||
| 0.9 | 100 | Yes | Yes | Yes | ||||||||
| 0.9 | 100 | Yes | Yes | Yes | ||||||||
| 0.9 | 100 | Yes | Yes | Yes | ||||||||
| 0.9 | 100 | Yes | Yes | Yes | ||||||||
| 0.9 | 100 | Yes | Yes | Yes | ||||||||
| 0.9 | 100 | Yes | Yes | Yes | ||||||||
| 0.9 | 100 | Yes | Yes | Yes | ||||||||
| 0.9 | 100 | Yes | Yes | Yes | ||||||||
| 0.9 | 100 | Yes | Yes | Yes | ||||||||
| 0.9 | 100 | Yes | Yes | Yes | ||||||||
| 0.9 | 100 | Yes | Yes | Yes | ||||||||
| 0.9 | 100 | Yes | Yes | Yes | ||||||||
| 0.9 | 100 | Yes | Yes | Yes | ||||||||
| 0.9 | 100 | Yes | Yes | Yes | ||||||||
| 0.9 | 100 | Yes | Yes | Yes | ||||||||
| 0.9 | 100 | Yes | Yes | Yes | ||||||||
| 0.9 | 100 | Yes | Yes | Yes | ||||||||
| 0.9 | 100 | Yes | Yes | Yes | ||||||||
| 0.9 | 100 | Yes | Yes | Yes | ||||||||
| 0.9 | 100 | Yes | Yes | Yes | ||||||||
| 0.9 | 100 | Yes | Yes | Yes | ||||||||
| 0.9 | 100 | Yes | Yes | Yes | ||||||||
| 0.9 | 100 | Yes | Yes | Yes | ||||||||
| 0.9 | 100 | Yes | Yes | Yes | ||||||||
| 0.9 | 100 | Yes | Yes | Yes | ||||||||
| Output | ||||||||||||
| Fy | Fz | Fx | ||||||||||
| L1 | R1 | L2 | R2 | L1 | R1 | L2 | R2 | L1 | R1 | L2 | R2 | |
| 1413.2 | 6854 | 202.27 | 5603.5 | 1800.6 | 7848.7 | 284.87 | 7019.4 | 477.55 | 498.78 | 148.71 | 231.68 | |
| −4997.7 | −2021 | −4767 | −864.78 | 7953.8 | 2763.4 | 7484.1 | 1219.2 | 307.36 | 392.25 | 220.09 | 278.88 | |
| −7333 | −1439 | −6966 | −282.21 | 8699.7 | 2013 | 8393.5 | 406.92 | 674.78 | 612.29 | 357.16 | 226.21 | |
| 6699.7 | 237.4 | 5378 | 1733.6 | 7672.2 | 360.67 | 6924.8 | 548.01 | 602.87 | 214.57 | 344.31 | 0 | |
| −4780.3 | −2176 | −4565 | −1053 | 8182.4 | 3081.9 | 7702.2 | 1557.6 | 344.81 | 430.6 | 270.78 | 338.82 | |
| −7613 | −1603 | −7015 | −384.3 | 9139.9 | 2188.5 | 8764 | 547.5 | 703.65 | 666.81 | 406.62 | 299.88 | |
| 1585.8 | 6997.7 | 26.626 | 5612.2 | 1924.3 | 8022.3 | 31.308 | 6857.6 | −14.689 | −127.73 | −3.6952 | −168.96 | |
| −5057.7 | −2338 | −4985 | −822.91 | 8610.2 | 3167.2 | 7593.7 | 1097 | −177.24 | −65.709 | −167 | −48.112 | |
| −7849.7 | −1845 | −7201.8 | −145.51 | 9561.9 | 2395.3 | 8520.1 | 174.14 | −118.81 | 0 | −223.51 | −18.216 | |
| 1559.3 | 6851.7 | 41.625 | 5483.4 | 1891.4 | 7843.9 | 48.944 | 6653.1 | −8.3195 | −116.6 | −5.8805 | −158.54 | |
| −4784.6 | −2537 | −4750 | −1054 | 8918 | 3563.3 | 7870.7 | 1482.2 | −172.82 | −64.942 | −168.83 | −54.038 | |
| −8149 | −2116 | −7325 | −228.14 | 10097 | 2621.2 | 8901.8 | 269.96 | −127.35 | 0 | −225.14 | −23.111 | |
| 1681.7 | 7266.5 | 73.53 | 6202.2 | 2107.8 | 8455.3 | 87.145 | 7284.3 | −34.345 | −153.55 | −13.424 | −188.54 | |
| −5623 | −765.01 | −4591 | −255.48 | 7073.7 | 966.37 | 5485.7 | 315.39 | 216.31 | 229.87 | 150.89 | 83.607 | |
| −5911 | −1139 | −4335 | −428.4 | 6717 | 1422.9 | 5735.1 | 604.4 | 392.76 | 384.53 | 274.01 | 260.73 | |
| 1391.7 | 6893.2 | 235.12 | 5984.2 | 1799.4 | 7912.1 | 344.31 | 7269.9 | 580.74 | 618.26 | 198.94 | 315.06 | |
| −4997.7 | −2021 | −4767 | −864.8 | 7953.8 | 2763.4 | 7484.1 | 1219.2 | 307.36 | 392.25 | 220.09 | 278.88 | |
| −7333 | −1439 | −6966 | −282.2 | 8699.7 | 2013 | 8393.5 | 406.92 | 674.78 | 612.29 | 357.16 | 226.21 | |
| 1287.8 | 6691.4 | 279.51 | 5752.7 | 1717 | 7685 | 447.51 | 7171.4 | 666.66 | 744.63 | 292.73 | 453.94 | |
| −4780.2 | −2176 | −4565 | −1053 | 8182.4 | 3081.9 | 7702.2 | 1557.6 | 344.81 | 430.6 | 270.78 | 338.82 | |
| −7613 | −1603 | −7015 | −384.3 | 9139.9 | 2188.5 | 7664 | 547.5 | 703.65 | 666.81 | 406.62 | 299.88 | |
| 1560.6 | 7090.5 | 28.206 | 6218.9 | 1936.3 | 8120.1 | 34.526 | 7101.5 | −18.369 | −132.23 | −3.109 | −159.3 | |
| −5058 | −2238 | −4985 | −822.9 | 8610.2 | 3167.2 | 7593.7 | 1097 | −177.24 | −65.709 | −167 | −48.112 | |
| −7849.7 | −1845 | −7201.8 | −145.5 | 9561.9 | 2395.3 | 8520.1 | 174.14 | −118.81 | 0 | −223.51 | −18.216 | |
| 1534 | 6997.4 | 0 | 6141.9 | 1895.2 | 8004.2 | 0 | 6983.9 | −13.195 | −122.53 | 0 | −144.98 | |
| −4785 | −2537 | −4750 | −1054 | 8918 | 3563.3 | 7870.7 | 1482.2 | −172.82 | −64.942 | −168.83 | −54.038 | |
| −8149 | −2116 | −7325 | −228.1 | 10097 | 2621.2 | 8901.8 | 269.96 | −127.35 | 0 | −225.14 | −23.111 | |
| 1727.1 | 7293 | 60.638 | 6462.3 | 2107 | 8528.4 | 72.574 | 7447.5 | −41.579 | −165.7 | −8.1564 | −175.56 | |
| −5623 | −7765 | −4591 | −255.48 | 7073.7 | 966.37 | 5485.7 | 316.39 | 216.31 | 229.87 | 150.89 | 83.607 | |
| −5911 | −1139 | −4335 | −428.42 | 6717 | 1422.9 | 5735.1 | 604.4 | 392.76 | 384.53 | 274.01 | 260.73 | |
| 1688 | 6192.9 | 481.27 | 5480.3 | 2080.4 | 7855.1 | 664.84 | 7256.7 | 566.61 | 519.27 | 301.57 | 316.48 | |
| −7779.8 | −1108.8 | −6934.7 | 0 | 9637.7 | 1739.8 | 8113.9 | 0 | 889.71 | 760.81 | 271.82 | 0 | |
| 1366.5 | 7864.4 | 0 | 4661.6 | 1868.3 | 9603.5 | 0 | 7850.3 | 0 | −42.65 | 0 | −281.44 | |
| 1519.3 | 6130.3 | 498.24 | 5357.8 | 1949.5 | 7624.8 | 764.68 | 7186.4 | 751.94 | 743.08 | 449.34 | 511.43 | |
| −7173 | −792.97 | −7020.5 | 0 | 8958.2 | 1990.4 | 8341.1 | 0 | 1696.9 | 1395.5 | 705.82 | 0 | |
| 1529.1 | 7620.5 | 35.118 | 5069.6 | 2057.4 | 9154.6 | 42.939 | 7651.3 | 0 | 0 | −189.63 | −2.7066 | |
| 1895 | 6218.6 | 274.21 | 5652.8 | 2253.6 | 8038.5 | 325.18 | 7038.3 | −40.073 | −160.72 | −19.778 | −151.56 | |
| 1681.9 | 7262.9 | 121.92 | 5631.8 | 2127.6 | 8445.1 | 145.84 | 7192 | 0 | −98.498 | −18.948 | −207.46 | |
| −7850 | −1845 | −7202 | −145.5 | 9561.9 | 2395.3 | 8520.1 | 174.14 | −118.81 | 0 | −223.51 | −18.216 | |
| 1872.8 | 5942 | 313.67 | 5372.8 | 2254 | 7825.5 | 376.67 | 6830.6 | −30.81 | −146.45 | −19.203 | −143.02 | |
| 1628.8 | 7197.6 | 114.94 | 5593.4 | 2096 | 8320.8 | 137.01 | 7090.5 | 0 | −86.804 | −16.569 | −197.9 | |
| −8149 | −2116 | −7325 | −228.1 | 10097 | 2621.2 | 8901.8 | 269.96 | −127.35 | 0 | −225.14 | −23.111 | |
| 2079.4 | 6287.5 | 341.6 | 5838.2 | 2457.5 | 8411.3 | 406.43 | 7355.4 | −63.167 | −188.09 | −30.142 | −168.42 | |
| −7842.3 | −1035 | −6771 | 0 | 9688.5 | 1559.2 | 7792.1 | 0 | 686.59 | 615.64 | 176.41 | 0 | |
| 1456.3 | 7742.6 | 0 | 4311.8 | 2048.3 | 9535 | 0 | 7594 | 0 | −23.714 | 0 | −310.44 | |
| Input | ||||||||||||
|---|---|---|---|---|---|---|---|---|---|---|---|---|
| Mu | V | Foreslope | Grade | ROR behavior (deg) | ||||||||
| 1: 3 | 1: 4 | 1: 10 | (−2, +2) | (−2, +6) | (−6, +2) | (−6, +6) | (+6, −6) | 0–7.5 | 0–15 | 0–25 | ||
| 0.9 | 80 | Yes | Yes | Yes | ||||||||
| 0.9 | 80 | Yes | Yes | Yes | ||||||||
| 0.9 | 80 | Yes | Yes | Yes | ||||||||
| 0.9 | 80 | Yes | Yes | Yes | ||||||||
| 0.9 | 80 | Yes | Yes | Yes | ||||||||
| 0.9 | 80 | Yes | Yes | Yes | ||||||||
| 0.9 | 80 | Yes | Yes | Yes | ||||||||
| 0.9 | 80 | Yes | Yes | Yes | ||||||||
| 0.9 | 80 | Yes | Yes | Yes | ||||||||
| 0.9 | 80 | Yes | Yes | Yes | ||||||||
| 0.9 | 80 | Yes | Yes | Yes | ||||||||
| 0.9 | 80 | Yes | Yes | Yes | ||||||||
| 0.9 | 80 | Yes | Yes | Yes | ||||||||
| 0.9 | 80 | Yes | Yes | Yes | ||||||||
| 0.9 | 80 | Yes | Yes | Yes | ||||||||
| 0.9 | 80 | Yes | Yes | Yes | ||||||||
| 0.9 | 80 | Yes | Yes | Yes | ||||||||
| 0.9 | 80 | Yes | Yes | Yes | ||||||||
| 0.9 | 80 | Yes | Yes | Yes | ||||||||
| 0.9 | 80 | Yes | Yes | Yes | ||||||||
| 0.9 | 80 | Yes | Yes | Yes | ||||||||
| 0.9 | 80 | Yes | Yes | Yes | ||||||||
| 0.9 | 80 | Yes | Yes | Yes | ||||||||
| 0.9 | 80 | Yes | Yes | Yes | ||||||||
| 0.9 | 80 | Yes | Yes | Yes | ||||||||
| 0.9 | 80 | Yes | Yes | Yes | ||||||||
| 0.9 | 80 | Yes | Yes | Yes | ||||||||
| 0.9 | 80 | Yes | Yes | Yes | ||||||||
| 0.9 | 80 | Yes | Yes | Yes | ||||||||
| 0.9 | 80 | Yes | Yes | Yes | ||||||||
| 0.9 | 80 | Yes | Yes | Yes | ||||||||
| 0.9 | 80 | Yes | Yes | Yes | ||||||||
| 0.9 | 80 | Yes | Yes | Yes | ||||||||
| 0.9 | 80 | Yes | Yes | Yes | ||||||||
| 0.9 | 80 | Yes | Yes | Yes | ||||||||
| 0.9 | 80 | Yes | Yes | Yes | ||||||||
| 0.9 | 80 | Yes | Yes | Yes | ||||||||
| 0.9 | 80 | Yes | Yes | Yes | ||||||||
| 0.9 | 80 | Yes | Yes | Yes | ||||||||
| 0.9 | 80 | Yes | Yes | Yes | ||||||||
| 0.9 | 80 | Yes | Yes | Yes | ||||||||
| 0.9 | 80 | Yes | Yes | Yes | ||||||||
| 0.9 | 80 | Yes | Yes | Yes | ||||||||
| 0.9 | 80 | Yes | Yes | Yes | ||||||||
| 0.9 | 80 | Yes | Yes | Yes | ||||||||
| Output | ||||||||||||
| Fy | Fz | Fx | ||||||||||
| L1 | R1 | L2 | R2 | L1 | R1 | L2 | R2 | L1 | R1 | L2 | R2 | |
| 0 | 41362 | 0 | 49168 | 0 | 53153 | 0 | 86385 | 0 | 0 | 0 | 794.27 | |
| 0 | 40192 | 0 | 46034 | 0 | 51980 | 0 | 83122 | 0 | 0 | 0 | −1394.2 | |
| −41563 | 0 | −54289 | 0 | 54362 | 0 | 93232 | 0 | 0 | 0 | 639.91 | 0 | |
| 0 | 40793 | 0 | 47618 | 0 | 51653 | 0 | 84626 | 0 | 0 | 0 | 850.78 | |
| 0 | 39298 | 0 | 44913 | 0 | 49890 | 0 | 82656 | 0 | 21657 | 0 | 888.45 | |
| −42602 | 0 | −55556 | 0 | 57700 | 0 | 99896 | 0 | −610.88 | 0 | 0 | 0 | |
| 5674.2 | 23295 | 10977 | 47352 | 6318.8 | 48231 | 18247 | 85455 | −9.4414 | −487.56 | −316.66 | −896.95 | |
| 0 | 43804 | 0 | 58650 | 0 | 60003 | 0 | 118000 | 0 | 0 | 0 | −2382.3 | |
| −46243 | 0 | −62255 | 0 | 61422 | 0 | 107430 | 0 | −125.64 | 0 | −2279.3 | 0 | |
| 6350.1 | 21681 | 11072 | 47520 | 7218.8 | 47223 | 18353 | 83810 | 0 | −417.46 | −188.78 | −726.42 | |
| 0 | 41987 | 0 | 46705 | 0 | 53987 | 0 | 85684 | 0 | 0 | 0 | −1443.4 | |
| −46161 | 0 | −64969 | 0 | 62006 | 0 | 111680 | 0 | −255.84 | 0 | −2113 | 0 | |
| 0 | 41173 | 0 | 51958 | 0 | 53152 | 0 | 90200 | 0 | 0 | 0 | 401.56 | |
| 0 | 36764 | 0 | 50482 | 0 | 52486 | 0 | 83626 | 0 | 0 | 0 | 788.01 | |
| −34329 | 0 | −46344 | 0 | 46890 | 0 | 79237 | 0 | 0 | 0 | 948.65 | 0 | |
| 0 | 38002 | 0 | 51749 | 0 | 50930 | 0 | 89606 | 0 | −631.75 | 0 | 0 | |
| 0 | 37228 | 0 | 49980 | 0 | 50476 | 0 | 85032 | 0 | 298.07 | 0 | 1038.1 | |
| −41563 | 0 | −54289 | 0 | 54362 | 0 | 93232 | 0 | 0 | 0 | 639.91 | 0 | |
| 0 | 36176 | 0 | 50624 | 0 | 50306 | 0 | 88813 | 0 | −772.46 | 0 | 0 | |
| 0 | 37178 | 0 | 49185 | 0 | 51013 | 0 | 85009 | 0 | 332.02 | 0 | 964.12 | |
| −42602 | 0 | −55556 | 0 | 57700 | 0 | 99896 | 0 | −610.88 | 0 | 0 | 0 | |
| 0 | 42349 | 0 | 51149 | 0 | 55620 | 0 | 89225 | 0 | −374.61 | 0 | −1637.5 | |
| 0 | 39637 | 0 | 48549 | 0 | 52538 | 0 | 85392 | 0 | 0 | 0 | −1368.1 | |
| −46243 | 0 | −62255 | 0 | 61422 | 0 | 107430 | 0 | −125.64 | 0 | −2279.3 | 0 | |
| 0 | 40211 | 0 | 49587 | 0 | 52897 | 0 | 85966 | 0 | −439.75 | 0 | −1348.7 | |
| 0 | 38855 | 0 | 48420 | 0 | 51549 | 0 | 85222 | 0 | 0 | 0 | −1285.6 | |
| −46161 | 0 | −64969 | 0 | 62006 | 0 | 111680 | 0 | −255.84 | 0 | −2113 | 0 | |
| 0 | 34364 | 0 | 52442 | 0 | 50544 | 0 | 90163 | 0 | −1083.2 | 0 | 0 | |
| 0 | 38860 | 0 | 53033 | 0 | 55457 | 0 | 86365 | 0 | 150.02 | 0 | 789.64 | |
| −34329 | 0 | −46344 | 0 | 46890 | 0 | 79237 | 0 | 0 | 0 | 948.65 | 0 | |
| 0 | 20793 | 0 | 46179 | 0 | 41511 | 1969.7 | 75908 | 0 | 0 | 1602.6 | 1535.7 | |
| 0 | 41212 | 0 | 53713 | 0 | 56011 | 0 | 90139 | 0 | 78.753 | 0 | 777.87 | |
| −41563 | 0 | −54389 | 0 | 54362 | 0 | 93232 | 0 | 0 | 0 | 639.91 | 0 | |
| 0 | 20978 | 2906.8 | 42142 | 0 | 42388 | 4595.5 | 72411 | 0 | 0 | 2458.5 | 1727.1 | |
| 0 | 40898 | 0 | 52376 | 0 | 54852 | 0 | 88500 | 0 | 86.413 | 0 | 951.99 | |
| −42602 | 0 | −55556 | 0 | 57700 | 0 | 99896 | 0 | −610.88 | 0 | 0 | 0 | |
| 0 | 24726 | 0 | 50654 | 0 | 44204 | 0 | 79576 | 0 | −737.98 | 0 | −835.96 | |
| 0 | 41232 | 0 | 53433 | 0 | 56670 | 0 | 88581 | 0 | 0 | 0 | −1311.8 | |
| −46243 | 0 | −62255 | 0 | 61422 | 0 | 107430 | 0 | −125.64 | 0 | −2279.3 | 0 | |
| 0 | 20830 | 322.63 | 47973 | |||||||||
| 0 | 40778 | 0 | 52186 | 0 | 55142 | 0 | 86860 | 0 | 0 | 0 | −1132.2 | |
| −46161 | 0 | −64969 | 0 | 62006 | 0 | 111680 | 0 | −255.84 | 0 | −2113 | 0 | |
| 0 | 22809 | 0 | 41577 | 0 | 45409 | 5869 | 73332 | 0 | 0 | 2096.8 | 1388.2 | |
| 0 | 42795 | 0 | 54638 | 0 | 58203 | 0 | 91958 | 0 | 0 | 0 | 444.36 | |
| −34329 | 0 | −46344 | 0 | 46890 | 0 | 79237 | 0 | 0 | 0 | 948.65 | 0 | |
| Input | ||||||||||||
|---|---|---|---|---|---|---|---|---|---|---|---|---|
| Mu | V | Foreslope | Grade | ROR behavior (deg) | ||||||||
| 1: 3 | 1: 4 | 1: 10 | (−2, +2) | (−2, +6) | (−6, +2) | (−6, +6) | (+6, −6) | 0–7.5 | 0–15 | 0–25 | ||
| 0.9 | 100 | Yes | Yes | Yes | ||||||||
| 0.9 | 100 | Yes | Yes | Yes | ||||||||
| 0.9 | 100 | Yes | Yes | Yes | ||||||||
| 0.9 | 100 | Yes | Yes | Yes | ||||||||
| 0.9 | 100 | Yes | Yes | Yes | ||||||||
| 0.9 | 100 | Yes | Yes | Yes | ||||||||
| 0.9 | 100 | Yes | Yes | Yes | ||||||||
| 0.9 | 100 | Yes | Yes | Yes | ||||||||
| 0.9 | 100 | Yes | Yes | Yes | ||||||||
| 0.9 | 100 | Yes | Yes | Yes | ||||||||
| 0.9 | 100 | Yes | Yes | Yes | ||||||||
| 0.9 | 100 | Yes | Yes | Yes | ||||||||
| 0.9 | 100 | Yes | Yes | Yes | ||||||||
| 0.9 | 100 | Yes | Yes | Yes | ||||||||
| 0.9 | 100 | Yes | Yes | Yes | ||||||||
| 0.9 | 100 | Yes | Yes | Yes | ||||||||
| 0.9 | 100 | Yes | Yes | Yes | ||||||||
| 0.9 | 100 | Yes | Yes | Yes | ||||||||
| 0.9 | 100 | Yes | Yes | Yes | ||||||||
| 0.9 | 100 | Yes | Yes | Yes | ||||||||
| 0.9 | 100 | Yes | Yes | Yes | ||||||||
| 0.9 | 100 | Yes | Yes | Yes | ||||||||
| 0.9 | 100 | Yes | Yes | Yes | ||||||||
| 0.9 | 100 | Yes | Yes | Yes | ||||||||
| 0.9 | 100 | Yes | Yes | Yes | ||||||||
| 0.9 | 100 | Yes | Yes | Yes | ||||||||
| 0.9 | 100 | Yes | Yes | Yes | ||||||||
| 0.9 | 100 | Yes | Yes | Yes | ||||||||
| 0.9 | 100 | Yes | Yes | Yes | ||||||||
| 0.9 | 100 | Yes | Yes | Yes | ||||||||
| 0.9 | 100 | Yes | Yes | Yes | ||||||||
| 0.9 | 100 | Yes | Yes | Yes | ||||||||
| 0.9 | 100 | Yes | Yes | Yes | ||||||||
| 0.9 | 100 | Yes | Yes | Yes | ||||||||
| 0.9 | 100 | Yes | Yes | Yes | ||||||||
| 0.9 | 100 | Yes | Yes | Yes | ||||||||
| 0.9 | 100 | Yes | Yes | Yes | ||||||||
| 0.9 | 100 | Yes | Yes | Yes | ||||||||
| 0.9 | 100 | Yes | Yes | Yes | ||||||||
| 0.9 | 100 | Yes | Yes | Yes | ||||||||
| 0.9 | 100 | Yes | Yes | Yes | ||||||||
| 0.9 | 100 | Yes | Yes | Yes | ||||||||
| 0.9 | 100 | Yes | Yes | Yes | ||||||||
| 0.9 | 100 | Yes | Yes | Yes | ||||||||
| 0.9 | 100 | Yes | Yes | Yes | ||||||||
| Output | ||||||||||||
| Fy | Fz | Fx | ||||||||||
| L1 | R1 | L2 | R2 | L1 | R1 | L2 | R2 | L1 | R1 | L2 | R2 | |
| 4927.5 | 31621 | 10480 | 49934 | 5155.2 | 48475 | 17288 | 85192 | 121.51 | 0 | 5745.1 | 2158.8 | |
| −24854 | 0 | −54110 | 0 | 46409 | 0 | 85206 | 0 | 0 | 0 | 1022.4 | 0 | |
| −45242 | 0 | −61238 | 0 | 59633 | 0 | 103704 | 0 | 206 | 0 | −89.448 | 0 | |
| 5963.6 | 29281 | 9670.9 | 49759 | 6405.5 | 47189 | 16869 | 83872 | 168.52 | 0 | 6825.8 | 2295.4 | |
| −24360 | 0 | −51293 | −2170.7 | 47181 | 0 | 84549 | 3317.8 | 0 | 0 | 1405.9 | 2090.4 | |
| −45746 | 0 | −65745 | 0 | 60232 | 0 | 110950 | 0 | 124.89 | 0 | 72.179 | 0 | |
| 2779.7 | 35793 | 9889.1 | 51007 | 2847.9 | 51991 | 14988 | 87308 | 0 | −409.25 | −109.17 | −939.77 | |
| −27083 | 0 | −57390 | 0 | 49862 | 0 | 90179 | 0 | −1072.2 | 0 | −1177.6 | 0 | |
| −47206 | 0 | −69601 | 0 | 62928 | 0 | 114590 | 0 | 0 | 0 | −2163.2 | 0 | |
| 2892.1 | 34316 | 10318 | 50489 | 2980.7 | 51594 | 15891 | 86463 | 0 | −409.41 | 0 | −778.64 | |
| −27575 | 0 | −54250 | −2252.6 | 52162 | 0 | 89136 | 2988.7 | −941.18 | 0 | −1026.5 | 0 | |
| −48491 | 0 | −71854 | 0 | 65058 | 0 | 119150 | 0 | 0 | 0 | −2102.7 | 0 | |
| 0 | 46785 | 0 | 32849 | 0 | 62652 | 0 | 77004 | 0 | 0 | 0 | −1486 | |
| −19137 | 0 | −47076 | 0 | 41197 | 0 | 71974 | 0 | 0 | 0 | 1222.7 | 0 | |
| −38764 | 0 | −50532 | 0 | 48268 | 0 | 83250 | 0 | 32.432 | 0 | 842.51 | 0 | |
| 0 | 41719 | 0 | 45994 | 0 | 53197 | 0 | 85379 | 0 | 0 | 0 | 538.42 | |
| −24854 | 0 | −54110 | 0 | 46409 | 0 | 85206 | 0 | 0 | 0 | 1022.4 | 0 | |
| −45242 | 0 | −61238 | 0 | 59633 | 0 | 103704 | 0 | 206 | 0 | −89.448 | 0 | |
| 0 | 40179 | 0 | 46080 | 0 | 50536 | 0 | 83449 | 0 | 4.4253 | 0 | 628.3 | |
| −24360 | 0 | −51293 | −2170.7 | 47181 | 0 | 84549 | 3317.8 | 0 | 0 | 1405.9 | 2090.4 | |
| −45746 | 0 | −65745 | 0 | 60232 | 0 | 110950 | 0 | 124.89 | 0 | 72.179 | 0 | |
| 0 | 40105 | 0 | 49895 | 0 | 50376 | 0 | 88314 | 0 | 0 | 0 | −1238.6 | |
| −27083 | 0 | −57390 | 0 | 49862 | 0 | 90179 | 0 | −1072.2 | 0 | −1177.6 | 0 | |
| −47206 | 0 | −69601 | 0 | 62928 | 0 | 114590 | 0 | 0 | 0 | −2163.2 | 0 | |
| 0 | 40207 | 0 | 46205 | 0 | 50610 | 0 | 84698 | 0 | −14.255 | 0 | −1140.3 | |
| −27575 | 0 | −54250 | −2252.6 | 52162 | 0 | 89136 | 2988.7 | −941.18 | 0 | −1026.5 | 0 | |
| −48491 | 0 | −71854 | 0 | 65058 | 0 | 119150 | 0 | 0 | 0 | −2102.7 | 0 | |
| 0 | 43700 | 0 | 54859 | 0 | 57422 | 0 | 95557 | 0 | −388.48 | 0 | 0 | |
| −19137 | 0 | −47076 | 0 | 41197 | 0 | 71974 | 0 | 0 | 0 | 1222.7 | 0 | |
| −38764 | 0 | −50532 | 0 | 48268 | 0 | 83250 | 0 | 32.432 | 0 | 842.51 | 0 | |
| 0 | 31245 | 0 | 54372 | 0 | 49608 | 0 | 90021 | 0 | −1091.6 | 0 | 0 | |
| −24854 | 0 | −54110 | 0 | 46409 | 0 | 85206 | 0 | 0 | 0 | 1022.4 | 0 | |
| −45242 | 0 | −61238 | 0 | 59633 | 0 | 103704 | 0 | 206 | 0 | −89.448 | 0 | |
| 0 | 28735 | 0 | 52631 | 0 | 47376 | 0 | 87411 | 0 | −1014.1 | 0 | 0 | |
| −24360 | 0 | −51293 | −2170.7 | 47181 | 0 | 84549 | 3317.8 | 0 | 0 | 1405.9 | 2090.4 | |
| −45746 | 0 | 65745 | 0 | 60232 | 0 | 110950 | 0 | 124.89 | 0 | 72.179 | 0 | |
| 0 | 34208 | 0 | 54332 | 0 | 51592 | 0 | 88969 | 0 | −1054.3 | 0 | −1397.4 | |
| −27083 | 0 | −57390 | 0 | 49862 | 0 | 90179 | 0 | −1072.2 | 0 | −1177.6 | 0 | |
| −47206 | 0 | −69601 | 0 | 62928 | 0 | 114590 | 0 | 0 | 0 | −2163.2 | 0 | |
| 0 | 30688 | 0 | 53232 | 0 | 49744 | 0 | 88174 | 0 | −1132 | 0 | 0 | |
| −27575 | 0 | −54250 | −2252.6 | 52162 | 0 | 89136 | 2988.7 | −941.18 | 0 | −1026.5 | 0 | |
| −48491 | 0 | −71854 | 0 | 65058 | 0 | 119150 | 0 | 0 | 0 | −2102.7 | 0 | |
| 0 | 26758 | 0 | 53581 | 0 | 46021 | 0 | 86715 | 0 | −1018.5 | 0 | 0 | |
| 0 | 41320 | 0 | 55619 | 0 | 58037 | 0 | 91827 | 0 | 15.948 | 0 | 535.91 | |
| −38764 | 0 | −50532 | 0 | 48268 | 0 | 83250 | 0 | 32.432 | 0 | 842.51 | 0 | |
| Input | |||||||||||
|---|---|---|---|---|---|---|---|---|---|---|---|
| Mu | R | V | Foreslope | ROR behavior (deg) | |||||||
| 1: 3 | 1: 4 | 1: 10 | 0–7.5 | 0–15 | 0–20 | 0–25 | |||||
| 0.9 | 230 | 80 | Yes | Yes | |||||||
| 0.9 | 230 | 80 | Yes | Yes | |||||||
| 0.9 | 230 | 80 | Yes | Yes | |||||||
| 0.9 | 230 | 80 | Yes | Yes | |||||||
| 0.9 | 230 | 80 | Yes | Yes | |||||||
| 0.9 | 230 | 80 | Yes | Yes | |||||||
| 0.9 | 230 | 80 | Yes | Yes | |||||||
| 0.9 | 230 | 80 | Yes | Yes | |||||||
| 0.9 | 230 | 80 | Yes | Yes | |||||||
| 0.9 | 230 | 80 | Yes | Yes | |||||||
| 0.9 | 230 | 80 | Yes | Yes | |||||||
| 0.9 | 230 | 80 | Yes | Yes | |||||||
| Output | |||||||||||
| Fy | Fz | Fx | |||||||||
| L1 | R1 | L2 | R2 | L1 | R1 | L2 | R2 | L1 | R1 | L2 | R2 |
| −6421.4 | −1478.3 | −5014.9 | −1169.9 | 7121.6 | 1523.3 | 6214.6 | 1192.7 | 101.34 | 184.45 | 80.713 | 163.15 |
| 152.2 | 9348.4 | 12.894 | 6014 | 7925.8 | 18453 | 1488.9 | 8595.4 | 7324.3 | 3083.4 | 1291.7 | 1965.9 |
| 0 | 7293.4 | 0 | 655.5 | 0 | 8390.6 | 0 | 7732.5 | 0 | −24.066 | 0 | −69.362 |
| 1907.7 | 4990.1 | 1222 | 4833.6 | 2301.1 | 7113.6 | 1672.1 | 6711.6 | 213.09 | 97.635 | 204.86 | 102.13 |
| −6573.4 | −1416.4 | −5389.7 | −1165.8 | 7329.4 | 1450 | 6513.6 | 1217.1 | 166.34 | 251.39 | 155.93 | 237.18 |
| 2531.1 | 5572.5 | 3234 | 6792.6 | 2825.6 | 7713.7 | 3826.2 | 7677.2 | −92.977 | −237.7 | 17.308 | −298.92 |
| 434.15 | 8547.5 | 428.6 | 5972.8 | 7548.8 | 12786 | 6462.1 | 8780.8 | 6923.9 | 2992.9 | 5802.5 | 2293.3 |
| 1907.7 | 4990.1 | 1222 | 4833.6 | 2301.1 | 7113.6 | 1672.1 | 6711.6 | 213.09 | 97.635 | 204.86 | 102.13 |
| −5845.2 | −1971.1 | −4899.8 | −1303.1 | 7244.9 | 2125.5 | 6549.5 | 1555.8 | 179.45 | 290.71 | 180.91 | 275.79 |
| −6786.6 | −1479.8 | −57360 | −978.45 | 7631.9 | 1539.6 | 7014.7 | 1109.9 | 106.59 | 194.45 | 87.681 | 195.66 |
| −6805.4 | −1797.2 | −5592.8 | −876.68 | 7665 | 1896.2 | 6951.8 | 1038.3 | 40.749 | 153.36 | 7.9435 | 122.99 |
| −6908.1 | −1855.9 | −5823.1 | −830.02 | 7818.4 | 1971.7 | 7037.6 | 960.08 | −189.68 | −40.984 | −235.53 | −84.753 |
| Input | |||||||||||
|---|---|---|---|---|---|---|---|---|---|---|---|
| Mu | R | V | Foreslope | ROR behavior (deg) | |||||||
| 1: 3 | 1: 4 | 1: 10 | 0–7.5 | 0–15 | 0–20 | 0–25 | |||||
| 0.9 | 395 | 100 | Yes | Yes | |||||||
| 0.9 | 395 | 100 | Yes | Yes | |||||||
| 0.9 | 395 | 100 | Yes | Yes | |||||||
| 0.9 | 395 | 100 | Yes | ||||||||
| 0.9 | 395 | 100 | Yes | Yes | |||||||
| 0.9 | 395 | 100 | Yes | Yes | |||||||
| 0.9 | 395 | 100 | Yes | Yes | |||||||
| 0.9 | 395 | 100 | Yes | ||||||||
| 0.9 | 395 | 100 | Yes | Yes | |||||||
| 0.9 | 395 | 100 | Yes | Yes | |||||||
| 0.9 | 395 | 100 | Yes | Yes | |||||||
| 0.9 | 395 | 100 | Yes | ||||||||
| Output | |||||||||||
| Fy | Fz | Fx | |||||||||
| L1 | R1 | L2 | R2 | L1 | R1 | L2 | R2 | L1 | R1 | L2 | R2 |
| −6418.2 | −1325.3 | −4936.4 | −1153.4 | 7099.5 | 1345.9 | 6252.3 | 1210.1 | 85.056 | 161.2 | 71.413 | 150.14 |
| 500.77 | 8170.1 | 295.01 | 6052.5 | 4902.5 | 14950 | 3672.6 | 7846.5 | 4692.3 | 3240.7 | 3320.5 | 2545.2 |
| −7291.2 | −1107.7 | −7087.1 | −521.99 | 8634.7 | 1120.6 | 8320.7 | 550.64 | −199.32 | −70.203 | −189.39 | −68.688 |
| 1367.1 | 6881.2 | 1749.3 | 4452.6 | 1423.4 | 7786.8 | 1904.5 | 5738.4 | 360.85 | 288.44 | 408.48 | 324.55 |
| −6590.4 | −1239.8 | −5620.7 | −1109.1 | 7354.1 | 1271 | 6694 | 1172.3 | 181.87 | 234.74 | 173.46 | 239.53 |
| −6571.6 | −1216.5 | −5201.6 | −1048.7 | 7345.8 | 1255.7 | 6482.3 | 1152.2 | −148.53 | −21.784 | −194.47 | −72.899 |
| −6636.2 | −1151.5 | −5472.8 | −930.59 | 7417.9 | 1173.7 | 6624.1 | 1010.8 | −165.02 | −32.683 | −200.77 | −75.71 |
| 1367.1 | 6881.2 | 1749.3 | 4452.6 | 1423.4 | 7786.8 | 1904.5 | 5738.4 | 360.85 | 288.44 | 408.48 | 324.55 |
| −6528.5 | −1484 | −5699.2 | −1163.6 | 7520.8 | 1533.3 | 6931.9 | 1309.4 | 268.85 | 341.94 | 268.01 | 342.07 |
| −6831 | −1608.5 | −5799.8 | −964.8 | 7697.4 | 1672.7 | 7117.2 | 1103 | 128.61 | 203.69 | 101.42 | 195.58 |
| −6791.1 | −1786.5 | −5648.9 | −921.21 | 7659.5 | 1884.9 | 6973.2 | 1086.9 | 43.73 | 145.2 | 0 | 11.01 |
| 1367.1 | 6881.2 | 1749.3 | 4452.6 | 1423.4 | 7786.8 | 1904.5 | 5738.4 | 360.85 | 288.44 | 408.48 | 324.55 |
| Input | |||||||||||
|---|---|---|---|---|---|---|---|---|---|---|---|
| Mu | R | V | Foreslope | ROR behavior (deg) | |||||||
| 1: 3 | 1: 4 | 1: 10 | 0–7.5 | 0–15 | 0–20 | 0–25 | |||||
| 0.9 | 667 | 120 | Yes | Yes | |||||||
| 0.9 | 667 | 120 | Yes | Yes | |||||||
| 0.9 | 667 | 120 | Yes | Yes | |||||||
| 0.9 | 667 | 120 | Yes | Yes | |||||||
| 0.9 | 667 | 120 | Yes | Yes | |||||||
| 0.9 | 667 | 120 | Yes | Yes | |||||||
| 0.9 | 667 | 120 | Yes | Yes | |||||||
| 0.9 | 667 | 120 | Yes | Yes | |||||||
| 0.9 | 667 | 120 | Yes | Yes | |||||||
| 0.9 | 667 | 120 | Yes | Yes | |||||||
| 0.9 | 667 | 120 | Yes | Yes | |||||||
| 0.9 | 667 | 120 | Yes | Yes | |||||||
| Output | |||||||||||
| Fy | Fz | Fx | |||||||||
| L1 | R1 | L2 | R2 | L1 | R1 | L2 | R2 | L1 | R1 | L2 | R2 |
| −6427 | −1432.5 | −4954.7 | −1206.3 | 7115.8 | 1462.2 | 6257.7 | 1266.5 | 140.86 | 201.1 | 125.72 | 190.9 |
| 1861.2 | 4877 | 683.17 | 4331.4 | 2590.8 | 7579.3 | 988.17 | 6804.9 | 367.81 | 290.93 | 234.41 | 194.02 |
| 1210.3 | 6631.4 | 1532.6 | 4265.7 | 1266.1 | 7590.6 | 1717.5 | 5594.6 | 363.79 | 292.54 | 405.98 | 334.21 |
| 1113.1 | 6696.9 | 1132.1 | 6075.3 | 1175.9 | 7507.2 | 1242.5 | 7160.4 | 297.99 | 306.76 | 370.34 | 312.58 |
| −6608.5 | −1270.3 | −5731.4 | −1123.4 | 7379.4 | 1310.1 | 6765 | 1191.2 | 231.53 | 256.04 | 222.41 | 270.24 |
| −6588 | −1169.7 | −5263.9 | −938.69 | 7348.6 | 1187.3 | 6619.3 | 1078.5 | −140.45 | −13.915 | −182.77 | −59.503 |
| 1210.3 | 6631.4 | 1532.6 | 4265.7 | 1266.1 | 7590.6 | 1717.5 | 5594.6 | 363.79 | 292.54 | 405.98 | 334.21 |
| 1113.1 | 6696.9 | 1132.1 | 6075.3 | 1175.9 | 7507.2 | 1242.5 | 7160.4 | 297.99 | 306.76 | 370.34 | 312.58 |
| −6747.1 | −1486.8 | −6031.4 | −1218.3 | 7589.2 | 1540.2 | 7094.3 | 1321.3 | 345.53 | 369.17 | 343.91 | 385.44 |
| −6817.2 | −1700.2 | −5711.9 | −963.98 | 7676.9 | 1753.6 | 7108.6 | 1142.1 | 131.61 | 211.68 | 102.7 | 191.71 |
| 1704.7 | 6838.6 | 906.96 | 5748.1 | 1754.7 | 7704.5 | 1053.5 | 7070.4 | 87.532 | 0 | 53.097 | 0 |
| 1555.8 | 7539 | 564.37 | 6854.9 | 1612.4 | 8706.8 | 598.02 | 8061.7 | 138.39 | 21.575 | 80.1 | −21.264 |
| Input | |||||||||||
|---|---|---|---|---|---|---|---|---|---|---|---|
| Mu | R | V | Foreslope | ROR behavior (deg) | |||||||
| 1: 3 | 1: 4 | 1: 10 | 0–7.5 | 0–15 | 0–20 | 0–25 | |||||
| 0.9 | 230 | 80 | Yes | Yes | |||||||
| 0.9 | 230 | 80 | Yes | Yes | |||||||
| 0.9 | 230 | 80 | Yes | Yes | |||||||
| 0.9 | 230 | 80 | Yes | Yes | |||||||
| 0.9 | 230 | 80 | Yes | Yes | |||||||
| 0.9 | 230 | 80 | Yes | Yes | |||||||
| 0.9 | 230 | 80 | Yes | Yes | |||||||
| 0.9 | 230 | 80 | Yes | Yes | |||||||
| 0.9 | 230 | 80 | Yes | Yes | |||||||
| 0.9 | 230 | 80 | Yes | Yes | |||||||
| 0.9 | 230 | 80 | Yes | Yes | |||||||
| 0.9 | 230 | 80 | Yes | Yes | |||||||
| Output | |||||||||||
| Fy | Fz | Fx | |||||||||
| L1 | R1 | L2 | R2 | L1 | R1 | L2 | R2 | L1 | R1 | L2 | R2 |
| −6589.1 | −1411.4 | −5312.8 | −128.15 | 7535.9 | 1745.6 | 6625.2 | 169.79 | 331.05 | 352.01 | 104.93 | 72.507 |
| −4673.3 | −2950.3 | −6891.5 | −2322.5 | 6600.8 | 3679.6 | 9647.8 | 2949.5 | −157.32 | −114.5 | −266.92 | −180.2 |
| 2006 | 3550.2 | 766.09 | 2770.4 | 3311.5 | 6940.6 | 1391.9 | 5573.3 | 181.88 | 97.553 | 150.53 | 73.651 |
| 981.44 | 5788.8 | 581.5 | 4327.1 | 1269.4 | 8126.6 | 781.17 | 5793.6 | 349.32 | 271.61 | 240.13 | 226.69 |
| −6695.2 | −1433.8 | −5637.1 | −213.32 | 7682.5 | 1794.8 | 7003.6 | 296.55 | 449.21 | 461.9 | 200.84 | 150.88 |
| −6974.4 | −1562 | −5373.4 | −140.72 | 8004.7 | 2023.9 | 6666.3 | 172.02 | −148.15 | −27.58 | −216.63 | −43.908 |
| −7111.8 | −1538.9 | −6034 | 0 | 8169.8 | 1882.3 | 6894.4 | 0 | −209.23 | −88.399 | −174.93 | 0 |
| 981.44 | 5788.8 | 581.5 | 4327.1 | 1269.4 | 8126.6 | 781.17 | 5893.6 | 349,32 | 271.61 | 240.13 | 226.69 |
| −6331.4 | −1713.7 | −5556 | −376.96 | 7847 | 2076.8 | 7200.4 | 522.66 | 460.64 | 527.87 | 240.26 | 251.23 |
| −7148.6 | −1543.5 | −5599.4 | −233.25 | 8246 | 1989.1 | 7334.8 | 314.73 | 374.55 | 406.02 | 143.88 | 137.13 |
| −7154.9 | −1592.5 | −5232.1 | −213.38 | 8250.5 | 2072.3 | 7042 | 286.98 | 314.46 | 356.38 | 83.622 | 112.22 |
| 1673.5 | 7263 | 168.1 | 5337.6 | 2173.7 | 8451.5 | 204.67 | 7134.1 | 144.02 | 36.674 | 4.0835 | 0 |
| Input | |||||||||||
|---|---|---|---|---|---|---|---|---|---|---|---|
| Mu | R | V | Foreslope | ROR behavior (deg) | |||||||
| 1: 3 | 1: 4 | 1: 10 | 0–7.5 | 0–15 | 0–20 | 0–25 | |||||
| 0.9 | 395 | 100 | Yes | Yes | |||||||
| 0.9 | 395 | 100 | Yes | Yes | |||||||
| 0.9 | 395 | 100 | Yes | Yes | |||||||
| 0.9 | 395 | 100 | Yes | Yes | |||||||
| 0.9 | 395 | 100 | Yes | Yes | |||||||
| 0.9 | 395 | 100 | Yes | Yes | |||||||
| 0.9 | 395 | 100 | Yes | Yes | |||||||
| 0.9 | 395 | 100 | Yes | Yes | |||||||
| 0.9 | 395 | 100 | Yes | Yes | |||||||
| 0.9 | 395 | 100 | Yes | Yes | |||||||
| 0.9 | 395 | 100 | Yes | Yes | |||||||
| 0.9 | 395 | 100 | Yes | Yes | |||||||
| Output | |||||||||||
| Fy | Fz | Fx | |||||||||
| L1 | R1 | L2 | R2 | L1 | R1 | L2 | R2 | L1 | R1 | L2 | R2 |
| −6520.6 | −1373.7 | −5360 | −176.87 | 7453.5 | 1702.8 | 6716.3 | 235.06 | 385.9 | 378.27 | 161.67 | 100.04 |
| 1705.5 | 3393.7 | 974.16 | 3130.2 | 3213.1 | 7056.7 | 1743.6 | 6344.9 | 223.03 | 155.03 | 189.14 | 127.82 |
| 933.57 | 5763.9 | 450.21 | 4396.7 | 1232 | 7956.6 | 614.77 | 5839.7 | 381.66 | 342.9 | 225.21 | 263.88 |
| 474.45 | 7183.6 | 253.1 | 5476.6 | 711.5 | 8339.9 | 374.15 | 6257.5 | 340.87 | 564.69 | 215.54 | 527.23 |
| −6690.7 | −1372.9 | −5746.3 | −202.89 | 7653.6 | 1756.1 | 7039.2 | 281.85 | 498.32 | 475.25 | 226.39 | 144.78 |
| −7116.7 | −1530.6 | −5346.9 | 0 | 8171.7 | 1933.7 | 6798 | 0 | −115.82 | 0 | −194.13 | 0 |
| 933.57 | 5763.9 | 450.21 | 4396.7 | 1232 | 7956.6 | 614.77 | 5839.7 | 381.66 | 342.9 | 225.21 | 263.88 |
| 474.45 | 7183.6 | 253.1 | 5476.6 | 711.5 | 8339.9 | 374.15 | 6257.5 | 340.87 | 564.69 | 215.54 | 527.23 |
| −6870.1 | −1473.9 | −6232 | −240.68 | 7980.9 | 1861.7 | 7536.6 | 350.28 | 636.31 | 626.86 | 310.5 | 200.53 |
| −7125.2 | −1503.5 | −5556.4 | −232 | 8195.8 | 1950.2 | 7305.3 | 314.89 | 412.89 | 414.47 | 166.14 | 138.51 |
| 1493.7 | 7123.4 | 193.57 | 5523.6 | 1942.2 | 8201.8 | 245.91 | 7191.9 | 311.3 | 280.99 | 75.258 | 50.875 |
| −7241 | −1618.1 | −5879.4 | −58.517 | 8410.9 | 2062 | 7163 | 69.062 | −120.38 | 0 | −207.9 | −10.098 |
| Input | |||||||||||
|---|---|---|---|---|---|---|---|---|---|---|---|
| Mu | R | V | Foreslope | ROR behavior (deg) | |||||||
| 1: 3 | 1: 4 | 1: 10 | 0–7.5 | 0–15 | 0–20 | 0–25 | |||||
| 0.9 | 667 | 120 | Yes | Yes | |||||||
| 0.9 | 667 | 120 | Yes | Yes | |||||||
| 0.9 | 667 | 120 | Yes | Yes | |||||||
| 0.9 | 667 | 120 | Yes | Yes | |||||||
| 0.9 | 667 | 120 | Yes | Yes | |||||||
| 0.9 | 667 | 120 | Yes | Yes | |||||||
| 0.9 | 667 | 120 | Yes | Yes | |||||||
| 0.9 | 667 | 120 | Yes | Yes | |||||||
| 0.9 | 667 | 120 | Yes | Yes | |||||||
| 0.9 | 667 | 120 | Yes | Yes | |||||||
| 0.9 | 667 | 120 | Yes | Yes | |||||||
| 0.9 | 667 | 120 | Yes | Yes | |||||||
| Output | |||||||||||
| Fy | Fz | Fx | |||||||||
| L1 | R1 | L2 | R2 | L1 | R1 | L2 | R2 | L1 | R1 | L2 | R2 |
| −6518.5 | −1339.3 | −5457.3 | −191.68 | 7443.7 | 1685.7 | 6780.4 | 255.38 | 429.52 | 396.74 | 189.12 | 111.86 |
| 1861.2 | 4877 | 683.17 | 4331.4 | 2590.8 | 7579.3 | 988.17 | 6804.9 | 367.81 | 290.93 | 234.41 | 194.02 |
| 505.51 | 7076.9 | 170.91 | 5425.5 | 720.42 | 8178.9 | 251.78 | 6247.4 | 358.83 | 601.97 | 145.76 | 484.16 |
| 1318.2 | 7141 | 243.14 | 6623.3 | 1776.5 | 8274.2 | 336.83 | 7951.1 | 529.67 | 611.31 | 173.96 | 319.99 |
| −6710.6 | −1368.4 | −5756.6 | −187.96 | 7677.8 | 1746 | 7052.7 | 255.12 | 498.64 | 445.43 | 226.53 | 122.74 |
| 1861.2 | 4877 | 683.17 | 4331.4 | 2590.8 | 7579.3 | 988.17 | 6804.9 | 367.81 | 290.93 | 234.41 | 194.02 |
| 505.51 | 7076.9 | 170.91 | 5425.5 | 720.42 | 8178.9 | 251.78 | 6247.4 | 358.83 | 601.97 | 145.76 | 484.16 |
| 1318.2 | 7141 | 243.14 | 6623.3 | 1776.5 | 8274.2 | 336.83 | 7951.1 | 529.67 | 611.31 | 173.96 | 319.99 |
| −6902.7 | −1333.6 | −6498.7 | −212.68 | 7926.2 | 1794 | 7624.5 | 324.32 | 771.14 | 674.72 | 395.39 | 196.92 |
| −7092 | −1495.9 | −5484.5 | −243.26 | 8136.3 | 1917.8 | 7295.1 | 328.57 | 417.4 | 403.52 | 178.35 | 136.23 |
| 1508.5 | 7187.1 | 13.003 | 6116 | 1888.3 | 8377 | 16.513 | 7431.8 | 408.14 | 397.28 | 5123.1 | 70.901 |
| 1700.7 | 7245.3 | 187.75 | 5258.3 | 2135.2 | 8414.3 | 232.41 | 7082.3 | 30.544 | −89.131 | −30.45 | −219.29 |
| Input | |||||||||||
|---|---|---|---|---|---|---|---|---|---|---|---|
| Mu | R | V | Foreslope | ROR behavior (deg) | |||||||
| 1: 3 | 1: 4 | 1: 10 | 0–7.5 | 0–15 | 0–20 | 0–25 | |||||
| 0.9 | 230 | 80 | Yes | Yes | |||||||
| 0.9 | 230 | 80 | Yes | Yes | |||||||
| 0.9 | 230 | 80 | Yes | Yes | |||||||
| 0.9 | 230 | 80 | Yes | Yes | |||||||
| 0.9 | 230 | 80 | Yes | Yes | |||||||
| 0.9 | 230 | 80 | Yes | Yes | |||||||
| 0.9 | 230 | 80 | Yes | Yes | |||||||
| 0.9 | 230 | 80 | Yes | Yes | |||||||
| 0.9 | 230 | 80 | Yes | Yes | |||||||
| 0.9 | 230 | 80 | Yes | Yes | |||||||
| 0.9 | 230 | 80 | Yes | Yes | |||||||
| 0.9 | 230 | 80 | Yes | Yes | |||||||
| Output | |||||||||||
| Fy | Fz | Fx | |||||||||
| L1 | R1 | L2 | R2 | L1 | R1 | L2 | R2 | L1 | R1 | L2 | R2 |
| −26173 | 0 | −43965 | 0 | 40499 | 0 | 77312 | 0 | −890.88 | 0 | 422.61 | 0 |
| −30126 | 0 | −50899 | 0 | 54895 | 0 | 79312 | 0 | −1085.4 | 0 | −1157.7 | 0 |
| −66749 | 0 | −28246 | 0 | 97649 | 0 | 102090 | 0 | −638.21 | 0 | −2780.6 | 0 |
| 0 | 25857 | 0 | 52669 | 0 | 45496 | 0 | 86391 | 0 | −1183.8 | 0 | 0 |
| −35360 | 0 | −46102 | 0 | 47688 | 0 | 81188 | 0 | −638.77 | 0 | 851.48 | 0 |
| −27194 | 0 | −49582 | −4533.5 | 44329 | 0 | 79373 | 6159.6 | −517.25 | 0 | −861.2 | −218.25 |
| −47888 | 0 | −35343 | 0 | 67652 | 0 | 82418 | 0 | −953.3 | 0 | −1546.1 | 0 |
| 0 | 25857 | 0 | 52669 | 0 | 45496 | 0 | 86391 | 0 | −1183.8 | 0 | 0 |
| −23709 | 0 | −42659 | −1738 | 42256 | 0 | 73042 | 2836.4 | −609.1 | 0 | 1521.1 | 1791.6 |
| −40477 | 0 | −51768 | 0 | 54595 | 0 | 88396 | 0 | 187.23 | 0 | 769.08 | 0 |
| −32323 | 0 | −50879 | 0 | 47620 | 0 | 87125 | 0 | −903.35 | 0 | −793.63 | 0 |
| 0 | 25875 | 0 | 52669 | 0 | 45496 | 0 | 86391 | 0 | −1183.8 | 0 | 0 |
| Input | |||||||||||
|---|---|---|---|---|---|---|---|---|---|---|---|
| Mu | R | V | Foreslope | ROR behavior (deg) | |||||||
| 1: 3 | 1: 4 | 1: 10 | 0–7.5 | 0–15 | 0–20 | 0–25 | |||||
| 0.9 | 395 | 100 | Yes | Yes | |||||||
| 0.9 | 395 | 100 | Yes | Yes | |||||||
| 0.9 | 395 | 100 | Yes | Yes | |||||||
| 0.9 | 395 | 100 | Yes | Yes | |||||||
| 0.9 | 395 | 100 | Yes | Yes | |||||||
| 0.9 | 395 | 100 | Yes | Yes | |||||||
| 0.9 | 395 | 100 | Yes | Yes | |||||||
| 0.9 | 395 | 100 | Yes | Yes | |||||||
| 0.9 | 395 | 100 | Yes | Yes | |||||||
| 0.9 | 395 | 100 | Yes | Yes | |||||||
| 0.9 | 395 | 100 | Yes | Yes | |||||||
| 0.9 | 395 | 100 | Yes | Yes | |||||||
| Output | |||||||||||
| Fy | Fz | Fx | |||||||||
| L1 | R1 | L2 | R2 | L1 | R1 | L2 | R2 | L1 | R1 | L2 | R2 |
| −29191 | 0 | −43476 | 0 | 50665 | 0 | 81075 | 0 | −2147 | 0 | −1510.3 | 0 |
| −57915 | 0 | −75597 | 0 | 81820 | 0 | 155210 | 0 | −580.18 | 0 | −4020.9 | 0 |
| 0 | 27111 | 0 | 54977 | 0 | 48395 | 0 | 87815 | 0 | −1167.7 | 0 | −701.46 |
| 0 | 43618 | 0 | 56444 | 0 | 57574 | 0 | 94730 | 0 | −329.65 | 0 | −210.85 |
| −28562 | 0 | −51555 | 0 | 48686 | 0 | 85601 | 0 | −1114.9 | 0 | 603.17 | 0 |
| −38465 | 0 | −45324 | 0 | 55538 | 0 | 88078 | 0 | −1112 | 0 | −380.19 | 0 |
| 0 | 27111 | 0 | 54977 | 0 | 48395 | 0 | 87815 | 0 | −1167.7 | 0 | −701.46 |
| 0 | 43618 | 0 | 56444 | 0 | 57574 | 0 | 94730 | 0 | −329.65 | 0 | −210.85 |
| −40411 | 0 | −53987 | 0 | 53339 | 0 | 91733 | 0 | −502.77 | 0 | 413.49 | 0 |
| −40828 | 0 | −50655 | 0 | 53209 | 0 | 90127 | 0 | 306.57 | 0 | 428.37 | 0 |
| 0 | 27111 | 0 | 54977 | 0 | 48395 | 0 | 87815 | 0 | −1167.7 | 0 | −701.46 |
| 0 | 43618 | 0 | 56444 | 0 | 57574 | 0 | 94730 | 0 | −329.65 | 0 | −210.85 |
| Input | |||||||||||
|---|---|---|---|---|---|---|---|---|---|---|---|
| Mu | R | V | Foreslope | ROR behavior (deg) | |||||||
| 1: 3 | 1: 4 | 1: 10 | 0–7.5 | 0–15 | 0–20 | 0–25 | |||||
| 0.9 | 667 | 120 | Yes | Yes | |||||||
| 0.9 | 667 | 120 | Yes | Yes | |||||||
| 0.9 | 667 | 120 | Yes | Yes | |||||||
| 0.9 | 667 | 120 | Yes | Yes | |||||||
| 0.9 | 667 | 120 | Yes | Yes | |||||||
| 0.9 | 667 | 120 | Yes | Yes | |||||||
| 0.9 | 667 | 120 | Yes | Yes | |||||||
| 0.9 | 667 | 120 | Yes | Yes | |||||||
| 0.9 | 667 | 120 | Yes | Yes | |||||||
| 0.9 | 667 | 120 | Yes | Yes | |||||||
| 0.9 | 667 | 120 | Yes | Yes | |||||||
| 0.9 | 667 | 120 | Yes | Yes | |||||||
| Output | |||||||||||
| Fy | Fz | Fx | |||||||||
| L1 | R1 | L2 | R2 | L1 | R1 | L2 | R2 | L1 | R1 | L2 | R2 |
| −31764 | 0 | −51765 | 0 | 52012 | 0 | 88892 | 0 | −1682.2 | 0 | −614.83 | 0 |
| −67400 | 0 | −170430 | 0 | 98139 | 0 | 270780 | 0 | 0 | 0 | −1265.7 | 0 |
| 0 | 41537 | 0 | 59075 | 0 | 58367 | 0 | 97445 | 0 | 998.08 | 0 | −163.3 |
| 0 | 44325 | 0 | 61362 | 0 | 58506 | 0 | 98406 | 0 | 248.48 | 0 | 111.13 |
| −27675 | 0 | −54280 | −6509.4 | 44742 | 0 | 86081 | 10010 | −575.2 | 0 | 1660 | 5590 |
| −52732 | 0 | −90591 | 0 | 80475 | 0 | 174310 | 0 | −1426.2 | 0 | −3130.4 | 0 |
| 0 | 41537 | 0 | 59075 | 0 | 58367 | 0 | 97445 | 0 | −998.08 | 0 | −163.3 |
| 0 | 44325 | 0 | 61362 | 0 | 58506 | 0 | 98406 | 0 | 248.48 | 0 | 0+ |
| −16162 | −3368.5 | −26691 | −8345.1 | 39912 | 7318.2 | 64708 | 17897 | −507.07 | −96.435 | 1504.5 | 2092.6 |
| −30068 | 0 | −55477 | 0 | 48031 | 0 | 88904 | 0 | −1153.5 | 0 | 0 | 0 |
| 0 | 41537 | 0 | 59075 | 0 | 58367 | 0 | 97445 | 0 | −998.08 | 0 | −163.3 |
| 0 | 44325 | 0 | 61362 | 0 | 58506 | 0 | 98406 | 0 | 248.48 | 0 | 111.13 |
| Input | |||||||||||
|---|---|---|---|---|---|---|---|---|---|---|---|
| Foreslope | Grade | ROR behavior (deg) | |||||||||
| 1: 3 | 1: 4 | 1: 10 | (−2, +2) | (−2, +6) | (−6, +2) | (−6, +6) | (+6, − 6) | 0–7.5 | 0–15 | 0–25 | |
| Yes | Yes | Yes | |||||||||
| Yes | Yes | Yes | |||||||||
| Yes | Yes | Yes | |||||||||
| Yes | Yes | Yes | |||||||||
| Yes | Yes | Yes | |||||||||
| Yes | Yes | Yes | |||||||||
| Yes | Yes | Yes | |||||||||
| Yes | Yes | Yes | |||||||||
| Yes | Yes | Yes | |||||||||
| Yes | Yes | Yes | |||||||||
| Yes | Yes | Yes | |||||||||
| Yes | Yes | Yes | |||||||||
| Yes | Yes | Yes | |||||||||
| Yes | Yes | Yes | |||||||||
| Yes | Yes | Yes | |||||||||
| Yes | Yes | Yes | |||||||||
| Yes | Yes | Yes | |||||||||
| Yes | Yes | Yes | |||||||||
| Yes | Yes | Yes | |||||||||
| Yes | Yes | Yes | |||||||||
| Yes | Yes | Yes | |||||||||
| Yes | Yes | Yes | |||||||||
| Yes | Yes | Yes | |||||||||
| Yes | Yes | Yes | |||||||||
| Yes | Yes | Yes | |||||||||
| Yes | Yes | Yes | |||||||||
| Yes | Yes | Yes | |||||||||
| Yes | Yes | Yes | |||||||||
| Yes | Yes | Yes | |||||||||
| Yes | Yes | Yes | |||||||||
| Yes | Yes | Yes | |||||||||
| Yes | Yes | Yes | |||||||||
| Yes | Yes | Yes | |||||||||
| Yes | Yes | Yes | |||||||||
| Yes | Yes | Yes | |||||||||
| Yes | Yes | Yes | |||||||||
| Yes | Yes | Yes | |||||||||
| Yes | Yes | Yes | |||||||||
| Yes | Yes | Yes | |||||||||
| Yes | Yes | Yes | |||||||||
| Yes | Yes | Yes | |||||||||
| Yes | Yes | Yes | |||||||||
| Yes | Yes | Yes | |||||||||
| Yes | Yes | Yes | |||||||||
| Yes | Yes | Yes | |||||||||
| Output | |||||||||||
| Speed 80 km/h | Speed 100 km/h | ||||||||||
| Sedan | SUV | Truck | Sedan | SUV | Truck | ||||||
| fy | fx | fy | fx | fy | fx | fy | fx | fy | fx | fy | fx |
| 0.874608 | 0.078356 | 0.837609 | 0.114278 | 0.64878 | 0.00569 | 0.88779 | 0.08215 | 0.83009 | 0.08003 | 0.62112 | 0.05141 |
| 0.873784 | −0.032577 | −0.525593 | 0.027153 | 0.63823 | −0.01032 | −0.65115 | 0.04178 | −0.65140 | 0.06172 | −0.59996 | 0.00777 |
| −0.932190 | 0.081302 | −0.836711 | 0.104854 | −0.64943 | 0.00434 | −0.86832 | 0.23053 | −0.82100 | 0.09586 | −0.65190 | 0.00071 |
| 0.873726 | 0.128514 | 0.822484 | 0.127601 | 0.64875 | 0.00624 | 0.86811 | 0.10416 | 0.90604 | 0.07492 | 0.61343 | 0.06019 |
| 0.863891 | 0.012986 | −0.505988 | 0.044691 | 0.63533 | 0.17010 | −0.61474 | 0.05124 | −0.61266 | 0.06748 | −0.57627 | 0.02589 |
| −0.795383 | 0.097942 | −0.815673 | 0.118856 | −0.62285 | −0.00388 | −0.85745 | 0.08585 | −0.80501 | 0.10063 | −0.65130 | 0.00115 |
| 0.895278 | −0.030901 | 0.869942 | −0.024253 | 0.55164 | −0.01081 | 0.88888 | −0.02381 | 0.84478 | −0.01871 | 0.63302 | −0.00928 |
| 0.873421 | −0.032944 | −0.531132 | −0.028869 | 0.57557 | −0.01338 | −0.63957 | −0.02554 | −0.64508 | −0.02238 | −0.60320 | −0.01607 |
| −0.843251 | −0.033737 | −0.846391 | −0.024646 | −0.64256 | −0.01424 | −0.87957 | −0.02344 | −0.82522 | −0.01746 | −0.65800 | −0.01219 |
| 0.881800 | −0.028313 | 0.863355 | −0.022381 | 0.55313 | −0.00851 | 0.88739 | −0.02223 | 0.84783 | −0.01760 | 0.62458 | −0.00757 |
| 0.869617 | −0.030795 | −0.502790 | −0.018268 | 0.63501 | −0.01033 | −0.14366 | −0.00593 | −0.60115 | −0.02110 | −0.58271 | −0.01364 |
| −0.823964 | −0.031692 | −0.836719 | −0.023830 | −0.63983 | −0.01364 | −0.86364 | −0.02225 | −0.81399 | −0.01716 | −0.65331 | −0.01141 |
| 0.901002 | −0.035548 | 0.864305 | −0.028494 | 0.64967 | 0.00280 | 0.90100 | −0.02706 | 0.84886 | −0.02174 | 0.57022 | −0.01064 |
| 0.875133 | −0.037556 | −1.006729 | 0.062577 | 0.64099 | 0.00579 | −0.82386 | 0.02287 | −0.81167 | 0.04918 | −0.58507 | 0.01080 |
| −0.873356 | 0.072453 | −0.840464 | 0.095039 | −0.63962 | 0.00752 | −0.80013 | 0.07457 | −0.81588 | 0.09061 | −0.67896 | 0.00665 |
| 0.814386 | 0.072270 | 0.797366 | 0.097207 | 0.63863 | −0.00450 | 0.87665 | 0.08710 | 0.83715 | 0.09887 | 0.63296 | 0.00389 |
| 0.875962 | −0.030604 | 0.821099433 | −0.021332 | 0.64356 | 0.00986 | −0.65115 | 0.04178 | −0.65140 | 0.06172 | −0.59996 | 0.00777 |
| −0.834320 | 0.072766 | −0.836711 | 0.104854 | −0.64943 | 0.00434 | −0.86829 | 0.07771 | −0.82100 | 0.09586 | −0.65190 | 0.00071 |
| 0.806112 | 0.109357 | 0.791401 | 0.132049 | 0.62393 | −0.00555 | 0.86658 | 0.10865 | 0.82319 | 0.12678 | 0.64380 | 0.00472 |
| 0.852331 | 0.063598 | 0.801626 | 0.086216 | 0.63492 | 0.00953 | −0.61475 | 0.05124 | −0.61266 | 0.06748 | −0.57627 | 0.02589 |
| −0.795371 | 0.097942 | −0.815678 | 0.118856 | −0.62285 | −0.00388 | −0.85748 | 0.08585 | −0.85033 | 0.10629 | −0.65130 | 0.00115 |
| 0.830126 | −0.031993 | 0.818991 | −0.026325 | 0.64550 | −0.01389 | 0.90619 | −0.02427 | 0.86656 | −0.01821 | 0.64893 | −0.00893 |
| 0.875361 | −0.031108 | 0.820987 | −0.023289 | 0.63935 | −0.00992 | −0.63956 | −0.02554 | −0.64021 | −0.02238 | −0.60320 | −0.01607 |
| −0.843251 | −0.033737 | −0.846409 | −0.024646 | −0.64256 | −0.01424 | −0.87913 | −0.02343 | −0.82522 | −0.01746 | −0.65800 | −0.01219 |
| 0.808271 | −0.029396 | 0.791936 | −0.024240 | 0.64667 | −0.01288 | 0.89933 | −0.02264 | 0.86910 | −0.01663 | 0.63863 | −0.00853 |
| 0.871928 | −0.028721 | 0.826128 | −0.020819 | 0.63811 | −0.00940 | −0.57943 | −0.02391 | −0.60117 | −0.02110 | −0.58271 | −0.01364 |
| −0.823969 | −0.031692 | −0.836719 | −0.023830 | −0.63983 | −0.01364 | −0.86365 | −0.02225 | −0.81399 | −0.01716 | −0.65331 | −0.01141 |
| 0.829604 | −0.036527 | 0.823274 | −0.030447 | 0.61693 | −0.00770 | 0.89173 | −0.02744 | 0.85611 | −0.02154 | 0.64426 | −0.00254 |
| 0.874159 | −0.035582 | 0.820904 | −0.026788 | 0.64795 | 0.00663 | −0.82386 | 0.02287 | −1.31732 | 0.04917 | −0.58507 | 0.01080 |
| −0.873356 | 0.072453 | −0.840501 | 0.095039 | −0.63962 | 0.00752 | −0.80015 | 0.07457 | −0.81588 | 0.09061 | −0.67896 | 0.00665 |
| 0.657207 | 0.053122 | 0.649518 | 0.072019 | 0.56096 | 0.02629 | 0.78814 | 0.08209 | 0.77518 | 0.09542 | 0.61317 | −0.00782 |
| 0.851313 | 0.058678 | 0.808806 | 0.082222 | 0.64950 | 0.00586 | 0.85233 | 0.05501 | −0.81181 | 0.09863 | −0.59996 | 0.00777 |
| −0.834320 | 0.072766 | −0.836711 | 0.104854 | −0.65011 | 0.00434 | −0.84436 | 0.04865 | 0.71900 | −0.01677 | −0.65190 | 0.00071 |
| 0.657393 | 0.100231 | 0.649403 | 0.390554 | 0.55301 | 0.03506 | 0.82813 | 0.11533 | 0.77063 | 0.14013 | 0.60366 | −0.00752 |
| 0.836765 | 0.099060 | 0.796969 | 0.102104 | 0.65066 | 0.00724 | 0.84400 | 0.09344 | −0.77692 | 0.19690 | −0.57627 | 0.02589 |
| −0.795383 | 0.097942 | −0.815679 | 0.118856 | −0.62285 | −0.00388 | −0.85748 | 0.08585 | 0.75395 | −0.01017 | 0.11683 | 0.00115 |
| 0.653092 | −0.032059 | 0.613737 | −0.026372 | 0.60898 | −0.01272 | 0.80764 | −0.02603 | 0.79525 | −0.02108 | 0.62990 | −0.01744 |
| 0.866964 | −0.029211 | 0.828943 | −0.021322 | 0.65173 | −0.00903 | 0.86618 | −0.02361 | 0.82066 | −0.01814 | −0.60320 | −0.01607 |
| −0.843251 | −0.033737 | −0.846391 | −0.024646 | −0.64256 | −0.01424 | −0.87961 | −0.02344 | −0.82525 | −0.01746 | −0.65800 | −0.01219 |
| 0.614482 | −0.029303 | 0.617325 | −0.025286 | 0.58870 | −0.00985 | 0.79972 | −0.02440 | 0.78102 | −0.01964 | 0.60848 | −0.00821 |
| 0.867648 | −0.026812 | 0.836239 | −0.023241 | 0.65467 | −0.00797 | 0.57380 | −0.02194 | 0.82376 | −0.01707 | −0.58271 | −0.01364 |
| −0.823964 | −0.031692 | −0.836719 | −0.023830 | −0.63983 | −0.01364 | −0.86365 | −0.02225 | −0.81399 | −0.01716 | −0.65331 | −0.01141 |
| 0.664854 | −0.036436 | 0.660276 | −0.032065 | 0.51670 | 0.02797 | 0.77395 | −0.02880 | 0.78079 | −0.02414 | 0.60525 | −0.00767 |
| 0.868762 | −0.033504 | 0.824253 | −0.025327 | 0.64886 | 0.00296 | 0.87376 | −0.02639 | −0.82187 | 0.07766 | 0.64685 | 0.00368 |
| −0.873331 | 0.072453 | 0.814553 | −0.025614 | −0.63962 | 0.00752 | 0.81340 | −0.01885 | 0.70452 | −0.01742 | −0.67896 | 0.00665 |
| Input | Output | ||||||||||||||
|---|---|---|---|---|---|---|---|---|---|---|---|---|---|---|---|
| Mu | R | V | Foreslope | ROR behavior (deg) | Sedan | SUV | Truck | ||||||||
| 1: 3 | 1: 4 | 1: 10 | 0–7.5 | 0–15 | 0–20 | 0–25 | fy | fx | fy | fx | fy | fx | |||
| 0.9 | 230 | 80 | Yes | Yes | −0.87742 | 0.03300 | −0.83609 | 0.05353 | −0.59534 | −0.00397 | |||||
| 0.9 | 230 | 80 | Yes | Yes | 0.42584 | 0.37477 | −0.73598 | −0.03143 | −0.60373 | −0.01671 | |||||
| 0.9 | 230 | 80 | Yes | Yes | 0.49301 | −0.00579 | 0.52811 | 0.02925 | −0.47560 | −0.01712 | |||||
| 0.9 | 230 | 80 | Yes | Yes | 0.72778 | 0.03471 | 0.73126 | 0.06811 | 0.59540 | −0.00898 | |||||
| 0.9 | 230 | 80 | Yes | Yes | −0.88099 | 0.04911 | −0.83323 | 0.07527 | −0.63210 | 0.00165 | |||||
| 0.9 | 230 | 80 | Yes | Yes | 0.82250 | −0.02778 | −0.83302 | −0.02587 | −0.62612 | −0.01230 | |||||
| 0.9 | 230 | 80 | Yes | Yes | 0.43238 | 0.50629 | −0.86653 | −0.02789 | −0.55461 | −0.01665 | |||||
| 0.9 | 230 | 80 | Yes | Yes | 0.72778 | 0.03471 | 0.72671 | 0.04594 | 0.59540 | −0.00898 | |||||
| 0.9 | 230 | 80 | Yes | Yes | −0.80221 | 0.05304 | −0.79210 | 0.08387 | −0.57651 | 0.02289 | |||||
| 0.9 | 230 | 80 | Yes | Yes | −3.85086 | 0.03379 | −0.81513 | 0.05935 | −0.64511 | 0.00669 | |||||
| 0.9 | 230 | 80 | Yes | Yes | −0.85874 | 0.01852 | −0.80405 | 0.04910 | −0.61748 | −0.01259 | |||||
| 0.9 | 230 | 80 | Yes | Yes | 0.00000 | −0.03097 | 0.72671 | 0.04595 | 0.59554 | −0.00898 | |||||
| 0.9 | 395 | 100 | Yes | Yes | −0.86959 | 0.02941 | −0.83384 | 0.06369 | −0.55159 | −0.02776 | |||||
| 0.9 | 395 | 100 | Yes | Yes | 0.47873 | 0.43985 | 0.50133 | 0.03786 | −0.56327 | −0.01941 | |||||
| 0.9 | 395 | 100 | Yes | Yes | −0.85941 | −0.02833 | 0.73799 | 0.07758 | 0.60266 | −0.01372 | |||||
| 0.9 | 395 | 100 | Yes | Yes | 0.85742 | 0.08202 | 0.85364 | 0.10510 | 0.65699 | −0.00355 | |||||
| 0.9 | 395 | 100 | Yes | Yes | −0.88288 | 0.05031 | −0.83755 | 0.08038 | −0.59661 | −0.00381 | |||||
| 0.9 | 395 | 100 | Yes | Yes | −0.86465 | −0.02696 | −0.82789 | −0.01834 | −0.58342 | −0.01039 | |||||
| 0.9 | 395 | 100 | Yes | Yes | −0.87456 | −0.02922 | 0.73799 | 0.07758 | 0.60266 | −0.01372 | |||||
| 0.9 | 395 | 100 | Yes | Yes | 0.85742 | 0.08202 | 0.85364 | 0.10510 | 0.65699 | −0.00355 | |||||
| 0.9 | 395 | 100 | Yes | Yes | −0.86007 | 0.07059 | −0.83571 | 0.10007 | −0.65070 | −0.00062 | |||||
| 0.9 | 395 | 100 | Yes | Yes | −0.86435 | 0.03578 | −0.81149 | 0.06372 | −0.63824 | 0.00513 | |||||
| 0.9 | 395 | 100 | Yes | Yes | −0.86045 | 0.01136 | 0.81529 | 0.04086 | 0.60266 | −0.01372 | |||||
| 0.9 | 395 | 100 | Yes | Yes | 0.85742 | 0.08202 | −0.83576 | −0.01911 | 0.65699 | −0.00355 | |||||
| 0.9 | 667 | 120 | Yes | Yes | −0.87072 | 0.04090 | −0.83555 | 0.06973 | −0.59281 | −0.01630 | |||||
| 0.9 | 667 | 120 | Yes | Yes | 0.65427 | 0.06052 | 0.65427 | 0.06052 | −0.64467 | −0.00343 | |||||
| 0.9 | 667 | 120 | Yes | Yes | 0.84360 | 0.08637 | 0.85585 | 0.10330 | 0.64573 | 0.00536 | |||||
| 0.9 | 667 | 120 | Yes | Yes | 0.87893 | 0.07536 | 0.83570 | 0.08915 | 0.67354 | 0.00229 | |||||
| 0.9 | 667 | 120 | Yes | Yes | −0.88513 | 0.05889 | −0.83815 | 0.07730 | −0.62815 | 0.04740 | |||||
| 0.9 | 667 | 120 | Yes | Yes | −0.85996 | −0.02443 | 0.65427 | 0.06052 | −0.56253 | −0.01788 | |||||
| 0.9 | 667 | 120 | Yes | Yes | 0.84360 | 0.08637 | 0.85585 | 0.10330 | 0.64573 | −0.00745 | |||||
| 0.9 | 667 | 120 | Yes | Yes | 0.87893 | 0.07536 | 0.83570 | 0.08915 | 0.67354 | 0.00158 | |||||
| 0.9 | 667 | 120 | Yes | Yes | −0.88251 | 0.08231 | −0.84598 | 0.11535 | −0.42028 | 0.02306 | |||||
| 0.9 | 667 | 120 | Yes | Yes | −0.85929 | 0.03607 | −0.80981 | 0.06423 | −0.62471 | −0.00842 | |||||
| 0.9 | 667 | 120 | Yes | Yes | 0.86437 | 0.00800 | 0.83690 | 0.33869 | 0.64573 | −0.00745 | |||||
| 0.9 | 667 | 120 | Yes | Yes | 0.87013 | 0.01153 | 0.80564 | −0.01726 | 0.67354 | 0.00229 | |||||
Open Research
Data Availability Statement
The datasets generated during and/or analyzed during the current study are available from the corresponding author upon reasonable request.


