Vehicle Collision Warning Based on Combination of the YOLO Algorithm and the Kalman Filter in the Driving Assistance System
Abstract
Vehicle forward collision warning based on machine vision can help to reduce the incidence of traffic accidents. Many researchers have studied this topic in recent years. However, most of the existing studies only focus on one stage of the process such as vehicle detection and distance measurement. It will face many issues in practical application. To solve these problems, we propose a framework for forward collision warning. This study applies the YOLO algorithm to detect the vehicle and uses the Kalman filter to track the vehicle. The monocular vision distance measuring method is used to estimate the distance and travel speed. Finally, we adopt the time to collision (TTC) to decide whether to trigger the warning process. In the speed measurement stage, we design an appropriate time interval to calculate the relative speed of the front vehicle. In the collision warning segment, a TTC threshold is set by considering not only vehicle safety guarantees but also avoiding hard barking that would make drivers uncomfortable. Furthermore, we set a warning area to filter the false warning when the car overtakes and meets. Experiments with real traffic scenes demonstrate that the performance of the proposed model is good to make accurate collision prediction and warning.
1. Introduction
The collision warning system can help drivers to realize danger and reduce the accidents. Many researches have been proposed to study the collision warning system in recent years [1]. Compared with other commonly used expensive sensing systems, such as laser radar and high-precision GPS, the collision warning system based on the vision sensor system has the advantage of lower cost and quick reaction. It is able to provide richer information of the vehicle, pedestrian, and road [2–4]. Therefore, the collision warning system based on the visual sensor is becoming a valuable part in the driver assistance system.
Vehicle forward collision warning based on machine vision is composed of vehicle detection, vehicle tracking, distance estimation, relative speed estimation, and collision warning. However, the forward collision warning system involves multiple complex modules; most of the existing papers only focus on one single stage such as object detection or tracking process [5–7]. Thus, it is necessary to propose the whole collision warning model. Also, most of them only focus on improving the accuracy of object detection, vehicle tracking, or distance measurement and do not combine these technologies with traffic-related scenes and knowledge. Thus, they cannot be directly applied to traffic scenes. Furthermore, there are also several issues, for example jitter of the bounding box which makes the distance and speed measurement results unstable, and the range of warning cannot be reasonably identified, which leads to lots of false alarm.
To solve the above-mentioned problems, this study proposes a forward collision warning model. The model has the following five components:
(1) YOLOv5s is used to detect the vehicles in front and get the specific positions of front vehicles. (2) The Kalman filter is used to track the vehicle and obtain the successive positions of the vehicle. For the vehicles missed in the vehicle detection segment in some frames, the Kalman filter is used to predict and fill their positions. (3) Using the monocular vision distance measuring method to measure the distance between front vehicles and the following vehicle. The speed is calculated as the division of the distance difference over the time interval between two frames. (4) Time to collision (TTC) is used to judge whether the vehicle triggers warning. If the distance and speed between the front vehicle and following vehicle reach the threshold, the warning is triggered. (5) Judge whether the vehicle is within the warning range set in advance. The specific steps to set the warning range will be showed in following sections.
The structure of the remaining sections of this paper is as follows: In Section 2, we review the relevant literature, focusing on the related works related to the techniques used in this paper and summarizing the contributions of these studies. Section 3 presents the forward collision warning model we propose, which includes the main processes of object detection, object tracking, distance and speed measurement, TTC calculation, and region of interest (ROI) region division. Section 4 shows the experimental results. Section 5 summarizes the work presented in this paper, analyzes its limitations, and outlines future work plans.
2. Literature Review
2.1. Object Detection
Object detection is a fundamental component of machine vision-based forward collision warning. The accuracy of object detection significantly affects the performance of other components. When object detection is used for forward collision warning, both the accuracy and efficiency of the algorithm need to be considered. This paper reviews deep learning-based object detection algorithms and selects suitable detection algorithms. Research on object detection is generally divided into two main types: two-stage and one-stage methods.
Two-stage algorithms first generate candidate regions and then classify and regress these regions. Girshick et al. introduced an R-CNN-based algorithm that employs selective search to generate candidate objects, extracts their features via a neural network, and classifies them using an SVM [8]. Later, Girshick proposed fast R-CNN, addressing slow detection speed and high memory consumption by optimizing candidate object processing and incorporating a loss function for classification considering multitasks [9]. He et al. improved R-CNN with SSP-Net by integrating a pyramid pooling method [10]. Further advancements came from Lin et al. and Ren et al., who developed faster and mask R-CNN, enhancing both accuracy and efficiency [11, 12].
The R-CNN methods are suitable for tasks that require more precise vehicle classification or vehicle detection tasks with less emphasis on speed. When there are many small objects in the task, R-CNN algorithms usually perform better. In addition, the mask R-CNN can segment the precise contours of vehicles, enabling more accurate vehicle detection [13–15].
One-stage object detection is an algorithm framework that directly transforms the object detection task into an end-to-end regression problem. Redmon et al. proposed a one-stage object detection network and named it YOLO [16]. The core idea of the YOLO algorithm is to turn object detection into a regression problem by using the whole image as the input of the network and going through just one neural network. In the further studies, Redmon and Farhadi proposed YOLOv2 and YOLOv3 [17, 18]. They are more powerful than the first generation of the YOLO algorithm, with greater improvements in the network structure and loss function, capable of multiscale prediction, and capable of multilabel classification. Other researchers proposed YOLOv4 and YOLOv5 [19]. They further improved the algorithm’s speed and accuracy, among which the YOLOv5 algorithm contains five different versions with different detection accuracies and detection speeds. YOLOv7 and YOLOv8 have been introduced in recent years [20, 21], but their high parameter counts make them unsuitable for devices with ordinary computing power.
The biggest advantage of the YOLO series algorithms is their high detection speed. These algorithms are typically used in real-time object detection systems and can be easily deployed on hardware systems, making them suitable for real-time vehicle detection in onboard video systems [22, 23].
2.2. Distance Measurement
Machine vision distance measurement algorithms are generally classified into monocular and binocular vision methods [24, 25].
The monocular vision distance measurement algorithm pushes the distance from the front object to the camera through the camera imaging principle and the corresponding geometric relationship. In 2003, Stein et al. proposed a method based on the monocular camera for distance measurement, and the error is about 10% at 90 m and is about 5% at 50 m [26]. However, the above-mentioned method has certain limitations; for example, it assumes that the camera is placed at an angle of 0, but in practice, the camera is placed at a certain tilt angle. Later scholars proposed distance estimation methods considering the camera angle problem on this basis. For example, Park and Hwang proposed a monocular vision distance measurement method based on the vanishing point principle [27]. This method considers the camera’s angle and uses the position of the vanishing point in the visual range as a reference to measure the camera’s bias angle for more accurate distance measurement.
In binocular distance measurement, two cameras separated by a certain distance are set up to shoot the same object, and the distance of the object is measured by calculating the parallax of the two images. The object’s distance is inversely related to parallax—greater distance results in smaller parallax, while closer objects have larger parallax. This measurement can be performed without needing a vanishing point or reference [28, 29]. Therefore, the binocular vision algorithm is more flexible and has better universality, and it can measure distance based on parallax for any type of objects.
2.3. TTC
Collision warning algorithms can be divided into two categories: space-headway-based algorithm and time-headway-based algorithm. The space-headway-based algorithm mainly sets the warning conditions by judging the safe distance of vehicles. The time-headway-based algorithm calculates the collision time of two vehicles traveling at the current state by calculating the relative distance and relative speed of the vehicles [30, 31] and triggers a warning when their quotient is less than a certain threshold value. This method is also known as the TTC method i.e. time to collision [32, 33], which represents the time required for a collision between two vehicles traveling a certain distance at the current speed. A warning is triggered if the TTC value falls below a predefined threshold.
Many studies have been performed on the threshold setting of TTC. Traditionally, the threshold value is set as a fixed constant, usually ranging from 0 to 5, but more and more studies show that the determination of the threshold value is influenced by many factors, and the optimal threshold value is determined differently for different road conditions and vehicle types as well as different driving behaviors. The National Highway Traffic Safety Administration has conducted statistics on drivers’ emergency braking characteristics [34]. The survey in [35] is based on the empirical data of 125 drivers in normal driving, and 98% of the drivers will not exceed –2.17 m/s2. When the deceleration speed reaches –3-4 m/s2, it will cause human discomfort, and the correspondence between the deceleration speed and TTC is calculated. In the works [36], indicators were set for each driving style and risk level. The works in [37] calculates the collision time of two vehicles under different conditions based on the speed and distance of the vehicles while driving and gives the formula for the TTC threshold.
3. Methodology
3.1. Vehicle Detection
We chose YOLOv5s as the object detector mainly because the model balances detection accuracy and speed. Compared to YOLOv3 and YOLOv4, YOLOv5s achieves faster detection while maintaining accuracy. Compared to YOLOv7 and YOLOv8, YOLOv5s has faster inference speed and a smaller model size, making it more suitable for real-time vehicle detection. The feature extractor of YOLOv5s is shown in Figure 1.
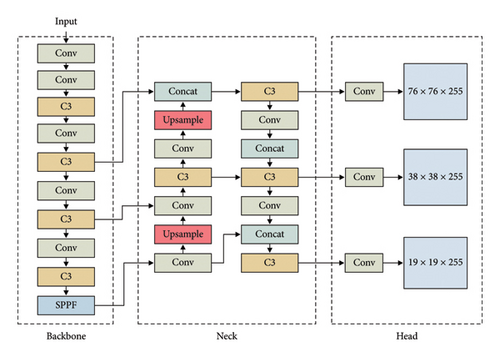
The backbone network of YOLOv5s is designed based on the cross stage partial network (CSPNet). The main function of the backbone network is to extract basic visual features of the image, such as edges, textures, and shapes. Through gradual down-sampling, it generates feature representations at different scales.
The neck network employs a top-down and bottom-up feature fusion method. It uses up-sampling layers to enlarge low-resolution feature maps and then fuses the enlarged feature maps with the backbone feature maps of the same size. Additionally, down-sampling operations are used to reduce the size of high-resolution features and fuse them with features of the same size, forming enhanced feature representations. The main function of the neck network is feature fusion, which strengthens the feature representation. Through this feature fusion network, more deep information from the image can be extracted, improving the detection capability for small objects. Furthermore, it alleviates the feature scale problem, addressing the differences in feature representation of objects at different scales.
The head network is responsible for the final prediction generation. It includes three detection branches corresponding to feature maps of three different scales used for detecting small, medium, and large-sized objects, respectively. The main function of the head network is to locate the objects, generate predicted bounding boxes, and predict the class of the objects within those boxes.
3.2. Vehicle Tracking
3.3. Measurement of Distance and Speed
The monocular vision method estimates the distance between the object and the camera according to the pinhole camera geometry and built-in parameters of the camera, such as focal length. The method is illustrated in Figure 2.
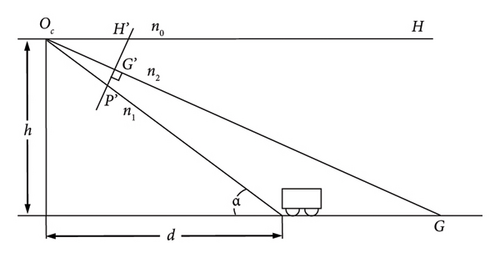
In the above formula, the meaning of αy is worth attention. In the geometric relationship given in Figure 2, H′, P′, and G′ represent the points on the imaging plane in the camera, rather than the points shown on the screen. Therefore, we should know the ratio of the image on the screen (measured by the number of pixels) to the image on the real imaging plane in the camera μ. The ratio μ is hard to get, but we can get the ratio of μ to the focal length αy. The method to calculate αy is introduced as follows:
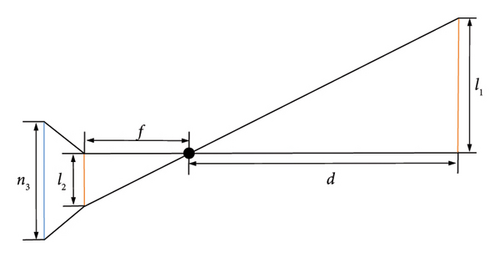
After measurement, we can calculate that the value of αy is about 0.000976 in the experiment of this study.
This can increase the speed measurement interval and reduce the noise and at the same time can ensure the speed measurement every 1/29 s, so as to avoid the situation where the vehicle speed changes sharply within 1 s and is ignored by the detector.
3.4. TTC Threshold Setting
The TTC method is a space-headway-based algorithm, and it can only evaluate the distance between two vehicles and cannot consider the speed of vehicles. Therefore, misjudgment may occur in some driving scenes where two vehicles are close. For example, when the road is crowded or the vehicle enters the intersection, the rear vehicle will follow the front vehicle at low speed but close distance. In that case, although the two vehicles are close, the relative speed is not high or even zero, and there is no danger of collision. Therefore, the TTC algorithm (time-headway-based) is adopted in this study. Taking the relative speed into account, the early warning conditions can be set more accurately, the misjudgment can be reduced, and the level of trust of drivers to the collision warning can be increased.
Many works have studied on the threshold setting of TTC. The traditional threshold is set as a fixed value, usually ranging from 0 to 5. However, more and more studies show that the threshold is affected by many factors, and the threshold determined by different road conditions, vehicle types, and different driving behaviors are varied [35–37]. For example, the USA national highway traffic safety administration made statistics on the emergency braking characteristics of drivers. They find the relationship between average deceleration and maximum deceleration. According to the empirical data of 125 drivers in daily driving, results in [35] shows that 98% of drivers’ driving deceleration will not exceed −2.17 m/s2, and when the deceleration reaches −3∼−4 m/s2, it will cause discomfort to the human body.
Considering different driver reaction times and different road conditions, the threshold value is usually set between 2.0 and 6.0.
Combined with the above literature and related research, we set the threshold as 3.0, set the speed direction of the front vehicle close to this vehicle as positive, and the speed direction far from this vehicle as negative. If the TTC is greater than 0 and less than 3, the speed and distance relationship of the vehicle meets the condition of triggering the warning.
3.5. Range of Collision Warning
The overtaking behavior of vehicles traveling in the same direction and the meeting behavior of vehicles traveling in the opposite direction are common, but in these behaviors, two vehicles are in different lanes and there is no risk of collision. If we only use the speed and the distance to determine whether to trigger the warning, these two behaviors will be considered as triggering the warning because at this time the distance between the two vehicles is close and the relative speed is high.
So, we set the ROI (range of collision warning) area based on the location of the vehicle in the video. When the front vehicle is in the area, if its speed and distance meet the warning trigger threshold, the warning will be triggered, and if the vehicle is not in the ROI area, the warning will not be triggered. The specific methods are shown in the following.
Firstly, set the ROI area according to the position of the camera and the location of the lane in the video. Referring to the location of the lane in the video to set the ROI area can make it closer to the actual range. We set a triangle area, and the vertex in the front of the triangle is located at the vanishing point of the lane.
Then, to make sure that the range of ROI is more universal, we selected different videos and marked the ROI areas, ultimately determining an ROI area suitable for most road conditions, as shown in Figure 4.
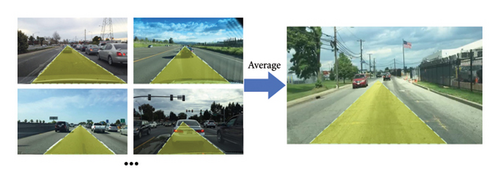
According to the relationship between the bottom edge of the vehicle and the two boundary lines of the ROI region, the vehicle is considered to be within the ROI region when its position satisfies one of the four cases in Figure 5.
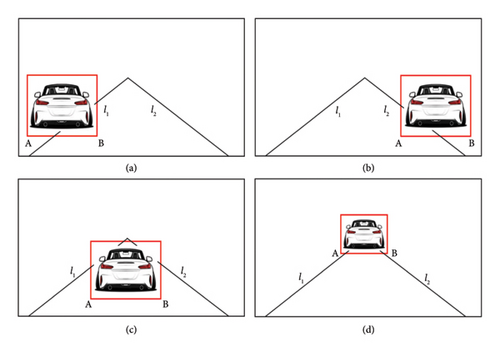
In Figure 5, A is the lower left corner of the detection box, B is the lower right corner of the detection box, l1 is the left line of the ROI, and l2 is the right line of the ROI. In Figure 5(a), the front vehicle crosses the left lane. In Figure 5(b), the front vehicle crosses the right lane. In Figure 5(c), the front vehicle is between the right lane and the left lane. In Figure 5(d), the front vehicle crosses both the right lane and the left lane.
- (1)
Detect the positions of the vehicles ahead, and obtain the trajectories of the vehicles.
- (2)
Measure the distance of the vehicle ahead, and calculate the real-time speed.
- (3)
Calculate the TTC according to the speed and the distance between the front vehicle and the following vehicle.
- (4)
The computed TTC value is compared to the predefined threshold, and if the TTC value is greater than 0 and less than 3 and the vehicle is within the set ROI range, the warning is triggered.
4. Experiments and Discussion
In this section, we trained the model using images from the Berkeley DeepDrive 100K (BDD100K) and Dense Adverse Weather Narbus (DAWN) datasets. BDD100K [39] includes 1000 videos and 10,000 pictures recorded by different on-board cameras. DAWN is a dataset specifically designed for autonomous driving research under adverse weather conditions. This dataset focuses on collecting driving scene data under harsh weather conditions such as fog, rain, and snow and includes vehicle image data from different time periods within these harsh weather conditions.
The image data from BDD100K and DAWN were used to train and test the vehicle detector. It is worth noting that the DAWN dataset only contains images, without videos. Although BDD100K includes both images and videos, it lacks data under harsh weather conditions. Therefore, we searched for in-car video under adverse weather conditions from the internet to test the performance of the object tracker. In the distance and speed measurement section, as parameters such as camera height need to be obtained, we recorded in-car videos using our own equipment to measure the vehicle’s distance and speed. Meanwhile, to demonstrate that our model can be applied to most driving scenarios, we selected multiple in-car videos from BDD100K to test the warning model’s performance.
4.1. Vehicle Detection
Several in-vehicle video images from the datasets BDD100K and DAWN are selected to train and test the vehicle detection results, including many images under different weather and road conditions. This paper chooses about 1500 different images in the two datasets which include about 12,000 vehicles to train the model, and the test results are shown in Figure 6. To ensure the robustness of the model, the dataset includes pictures of vehicles under various weather and lighting conditions.
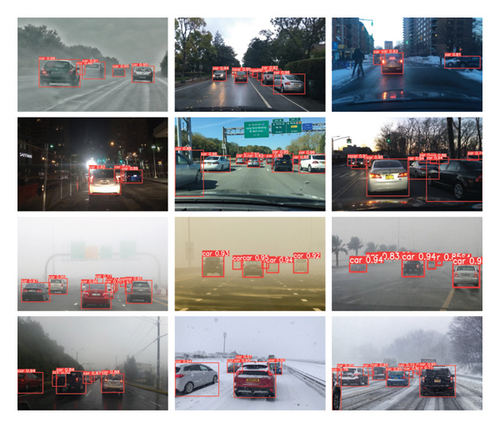
The boxes in Figure 6 mark the position of different vehicles in the video, the upper left corner of the box is the type of the object detected, and the number on the right is the confidence level of the object.
As shown in Figure 6, most of the vehicles on the road are detected, and the positions of the detection boxes are accurate. There may be a small jitter in the bounding box in the video, but it does not have a great impact on the subsequent work. The performance of the detector is tested on the datasets.
We used approximately 300 images including 2500 vehicles to test the mAP of object detection, and the accuracy of the detector reached 87.4%. The inference speed on the NVIDIA 2080 Ti∗2 GPU reaches 9.8 ms per image or 102 fps. This speed is sufficient for real-time vehicle detection and warning systems. As can be seen from Figure 6, vehicle detection still performs well under adverse weather conditions. Most of the missed detection cases are caused by the vehicle covered by another vehicle, or the vehicle is too far away from the host vehicle. The priority in the collision warning is the vehicle that is directly close to the host vehicle. It is considered that the vehicles covered by others and distant vehicles do not have much impact on the safety of the host car. So even though the mAP is not perfect, it is good enough for the collision warning model.
4.2. Vehicle Tracking
The vehicle is tracked using the Kalman filtering method, and the results obtained are shown in Figure 7. The top-left corner of the box displays the vehicle’s ID, with different vehicles represented by different IDs. To evaluate the performance of the tracker in various scenarios, we select vehicle-mounted video data under different weather conditions for testing.
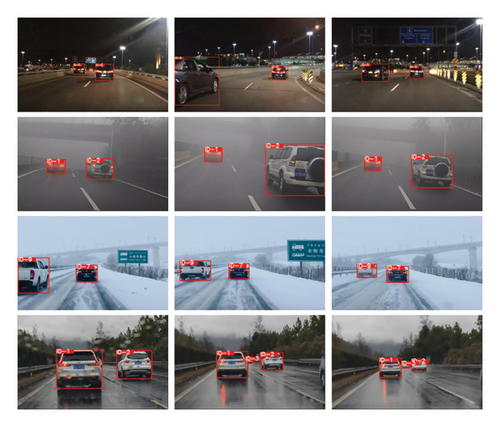
From Figure 7, it can be seen that different vehicles are assigned different IDs, and the ID of the same vehicle remains consistent across different frames, which proves that the tracker has effectively tracked the vehicles. It is worth noting that the tracker still performed well in adverse weather conditions, which demonstrates its strong robustness. In addition, the problem of vehicle position loss that appeared in the vehicle detection session is solved in this session. The Kalman filter automatically predicts the vehicle position in the current frame, which achieves the effect of supplementing the vehicle position information. It can also be regarded as a smoothing process, so the vehicle tracking boxes become stable and continuous, which is beneficial to the next analysis.
4.3. Distance and Speed Measurement
For the distance measurement, we fix the phone on a tripod and place it on the car for video acquisition, and in this experiment, the height of the camera is 1.25 m. We detect vehicles in the video using YOLOv5, track them by the Kalman filter, and measure their distance. The obtained results are shown in Figure 8.
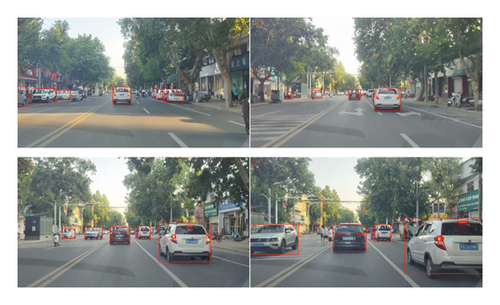
In Figure 8, the distance measurement results are labeled in the upper left corner of the vehicle detection boxes. The speed of the vehicle was calculated using the distance between different frames and the time difference, and the measurement results of the vehicle’s distance and speed are shown in Figure 9 (we just show three vehicles to make the result clear to see).
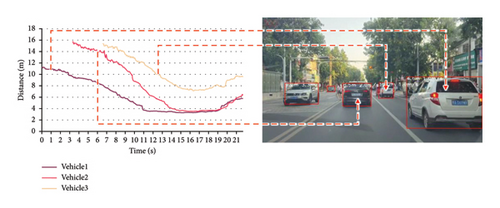
The purple line represents the distance of vehicle 1, the pink line represents the distance of vehicle 2, and the yellow line represents the speed of vehicle 3 which is in front of the vehicle 2. The first one to enter the video is vehicle 1, and after a few seconds, the black vehicle (vehicle 2) enters the video, and after a few seconds, another white vehicle (vehicle 3) enters the view.
The detection results may be affected by the detection box jitter, camera angle changes, and changes in the road surface slope, which results in a certain error, but on roads where the slope changes are not very frequent, this error is relatively small and does not affect the accuracy of the vehicle warning too much.
The vehicle’s speed is calculated from its distance using equation (18), with results presented in Figure 10.
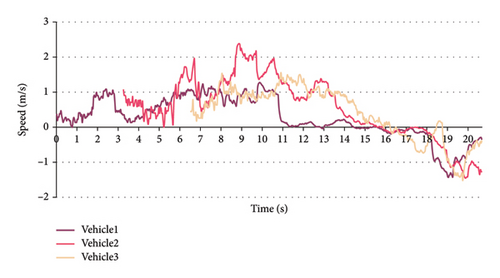
The purple line represents the white vehicle 1, the red line represents the vehicle 2, and the yellow line represents the vehicle 3. The speed direction of the front vehicle approaching the host vehicle is taken as positive direction which is greater than 0, and the speed direction of the front vehicle moving away from the host vehicle is taken as reverse direction.
The real-time velocity of the vehicle obtained from Figure 10 is mostly located between −2 and −1.5 m/s (a negative speed indicates that the front vehicle is moving away from the host vehicle), which is consistent with the results obtained in Figure 9. The intersection point with x-axis of the velocity curves in Figure 10 also corresponds to the inflection points of the distance curves in Figure 9.
4.4. Forward Collision Warning
- (1)
The position of the vehicle ahead is detected, and the trajectory of the vehicle is obtained according to the object tracking algorithm.
- (2)
Measure the distance of the front vehicle, and calculate the speed according to equation (18).
- (3)
Calculate the TTC value according to equation (19).
- (4)
The calculated value of TTC is compared with the set threshold (set to 3.0 in this paper), and if the TTC is greater than 0 and less than 3 and the vehicle is within the set ROI range, the warning is triggered.
We recorded the in-car video on the road. When the vehicle in front stopped at the intersection due to the red light, the host car approached the front vehicle at a certain speed and finally stopped when the distance from the vehicle in front was close to observe whether the warning information was given. Figure 11 displays the front vehicle’s distance, speed, and the issued warning signals throughout the process.

The speed and distance information of the front vehicle is recorded in Figure 11. The front vehicle is close to the host vehicle at about 11 s, and its speed is about 1.5 m/s, which satisfies the warning condition, and the front vehicle is in the ROI area, so the warning is triggered. “Alarm: impending collision” appears in the upper left corner of the video. After 11 s, as the front vehicle and host vehicle gradually slow down and finally stop, the relative speed of the two cars decreases continuously and finally becomes 0, so there is no danger of collision and the warning is removed.
The ratio of distance and speed over time is shown in Figure 12. Alarm is triggered when the ratio is between 0 and 3.
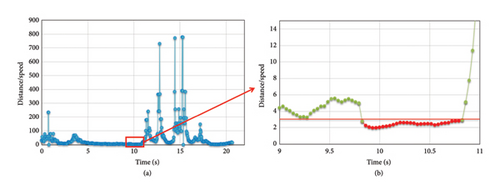
Figure 12(b) shows the ratio between 9 and 11 s. The TTC threshold is set to 3 (the red line in the figure). When the ratio of distance and speed is under the line, the alarm will be triggered.
To evaluate our model’s performance in various scenarios, we selected different in-vehicle videos in BDD100K for testing, with results shown in Figure 13. The camera parameters are estimates, but they are within an acceptable margin of error. Figure 13 displays the speed and distance of the vehicle ahead and marks the ROI area. If a warning is triggered, the alert message “Alarm: impending collision” will appear in the upper left corner of the image; otherwise, no warning message is displayed.
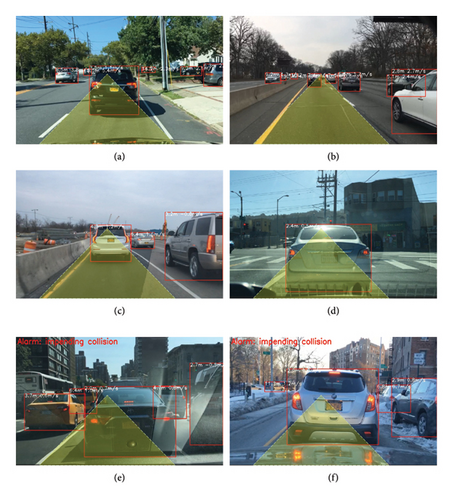
In Figures 13(e) and 13(f), the relative distance and speed of the vehicle ahead meet the warning trigger conditions, and the vehicle is within the ROI area; therefore, the warning is activated. In Figures 13(a), 13(b), 13(c), and 13(d), none of the vehicles satisfy the warning trigger conditions. In Figure 13(d), although the vehicle is at a close distance and within the ROI area, the relative speed is low, only 0.5 m/s, thus no warning is triggered. It is worth noting that the overtaking behavior of the vehicles in the adjacent lane does not trigger the warning, as shown in Figure 13(b). The vehicle on the right has a relative distance and speed of 2.8 m and 2.7 m/s, respectively, which would be sufficient to trigger a warning, but since this vehicle is outside the ROI area, no warning is activated. That proves that the setting of the ROI area is effective in excluding false alarms.
From the above results, we can see that the vehicle warning model makes an accurate judgment on the behavior of the vehicle in front and determines whether to trigger the warning by the speed, the distance, and the position of the front vehicle. The model will make a warning when the speed and distance meet the threshold, and it successfully excludes overtaking and meeting situations in adjacent lanes to avoid false alarms.
5. Conclusion and Future Work
In this study, we proposed a machine vision-based forward collision warning model, which contains vehicle detection, vehicle tracking, distance measurement, speed measurement, TTC threshold setting, and ROI setting. It is noteworthy that in the speed measurement stage, we find the appropriate time interval to calculate the speed. In the warning stage, we find the appropriate TTC threshold to guarantee the safety and ensure that the driver is comfortable during driving. What is more, we set the ROI area to filter out false warning when the car overtakes and meets, which is rarely considered in most other papers. In the experiment stage, we test the performance of the model. The primary conclusions are as follows: (1) The performance of the vehicle detector and vehicle tracker is good enough to detect and track the front vehicle rapidly and accurately. (2) In the distance and speed measurement stage, the result is roughly accurate but unstable because the measurement result is easily affected by the camera angle, road slope, and the tracking boxes. Because the speed measurement is based on the distance measurement, the result is also affected by same reasons. (3) In the warning stage, the model can make an alarm at right time and filter out false warning when the car overtakes and meets.
There are still some limitations in current study: (1) In the distance measurement stage, the jitter of the vehicle tracking boxes and the error of the camera angle will bring some error, which also affects the accuracy of speed measurement. This is mainly because distance measurement relies on the position of tracking boxes and jitter affects their position, leading to inaccuracies in distance calculation. Additionally, this paper assumes that the camera is mounted horizontally, so camera tilt also causes distance calculation errors. However, these errors are acceptable—the jitter of the tracking boxes and the tilt of the camera only introduce minor errors. The closer the front vehicle is, the smaller the error. In collision warning, we focus primarily on vehicles that are in close proximity. Therefore, in our tests, even if there are small errors in distance and speed measurements, the model can still give correct warnings. (2) In some videos, the deviation of the camera placement will cause the ROI region to be not so accurate. Additionally, when the vehicle is turning, the ROI region may become inaccurate, which can cause some false alarms, but it almost never causes missed alarms. Although false alarms are safer than missed alarms, they are also unacceptable for drivers; therefore, in our future work, we will address the issue of false alarms.
Disclosure
All authors confirm that any persons involved in the research or manuscript preparation are all listed as an author, and all authors confirm that any third-party services involved in the research or manuscript preparation have been acknowledged.
Conflicts of Interest
The authors declare no conflicts of interest.
Author Contributions
Guihua Miao: conceptualization, methodology, writing – original draft preparation, and writing – review and editing. Weihe Wang and Jinjun Tang: methodology, writing – review and editing, visualization, and data curation. Fang Li: data curation and writing – review and editing. Yunyi Liang: conceptualization and methodology.
Funding
This research was funded in part by the National Natural Science Foundation of China (no. 52172310).
Acknowledgments
This research was funded in part by the National Natural Science Foundation of China (no. 52172310).
Open Research
Data Availability Statement
The data that support the findings of this study are available from the corresponding author upon reasonable request.


