Conversion of Shrimp Aquaculture Waste Into Nutritious Floc Using Taro Flour With Varied C/N Ratios: A Sustainable Approach for Aquafeed Production
Abstract
Waste management is a critical challenge in the aquaculture industry, particularly in the cultivation of Pacific white shrimp (Penaeus vannamei). This study explores the potential of converting shrimp aquaculture waste into a nutritious floc biomass by incorporating taro flour as a carbon source at varying carbon-to-nitrogen (C/N) ratios. A completely randomized design was employed, with treatments consisting of five different C/N ratios (control, 12, 15, 18, and 21) and four replicates per treatment. The results revealed that the different C/N ratios significantly influenced floc formation time, floc volume, floc biomass, floc size, and the floc’s crude protein content (p < 0.05). The treatment with the highest C/N ratio (21) demonstrated the most efficient floc formation, achieving a floc volume of 247.5 ml/L, a biomass of 34.21 g/L, and a floc size of 339 µm within 4 days. Furthermore, the crude protein content in the floc increased from 18.37% in the waste to 39.75%. The floc composition predominantly included Bacillus spp., Chlorella sp., and Alona sp. across all treatments, while at the highest a C/N ratio (T4), unique featured microorganisms including Melosira sp., Paramecium sp., and Chroococcus sp. were observed. These findings suggest that shrimp aquaculture waste can be effectively transformed into a highly nutritious material, with the potential to be developed as a sustainable protein source for aquafeed.
1. Introduction
The rapid growth of the aquaculture industry, particularly the farming of Pacific white shrimp (Penaeus vannamei), has intensified waste management challenges, posing environmental and economic concerns [1]. Shrimp aquaculture waste primarily consists of uneaten feed, feces, and metabolic byproducts [2]. If not properly managed, these wastes can lead to water pollution, disease outbreaks, and reduced production efficiency. In Indonesia, shrimp farms generate an estimated 3.89 tons of solid waste annually, rich in nitrogen (N) and phosphorus (P), which are often discharged into open waters, contributing to eutrophication and ecosystem degradation [3–5].
Despite their environmental risks, these wastes still contain valuable nutrients, particularly nitrogen and phosphorus [6, 7]. Researchers have therefore recommended recovering and reusing these nutrients within aquaculture systems. Traditional strategies such as improving feed efficiency and waste removal, often fall short in fully addressing waste utilization [8]. Biofloc technology (BFT) offers a promising alternative by adjusting the carbon-to-nitrogen (C/N) ratio to stimulate microbial growth that converts waste into nutrient-rich biomass [9]. Biofloc contains proteins, lipids, carbohydrates, essential amino and fatty acids, antioxidants, and vitamins, all of which support growth, immunity, survival, and reproduction in cultured species [10, 11].
However, BFT is not without challenges. Excessive biofloc accumulation can lead to high total suspended solids (TSSs) and nitrate buildup, potentially disrupting shrimp metabolism and increasing mortality [12]. Inconsistent nitrogen cycling and reduced microbial activity can also result in the accumulation of ammonia, nitrite, and nitrate, compromising system health [13]. Maintaining optimal conditions for both microbes and shrimp within the same environment is a significant hurdle [14].
To overcome these limitations, this study proposes a bioreactor system that processes shrimp aquaculture waste in a separate compartment, enabling controlled biofloc production without disturbing the culture environment. Using taro flour as a carbon source, biofloc was generated at varying C/N ratios. The study evaluated floc formation time, biomass yield, particle size, protein content, and microbial composition. By converting waste into a protein-rich resource, this method offers a sustainable, environmentally friendly, and cost-effective solution for aquafeed production and waste management.
2. Materials and Methods
2.1. Experimental Setup
The experiment was conducted in a completely randomized design, featuring five treatments with four replications each: T0 (control) with no taro flour added, resulting in a C/N ratio of ~1.18; T1 with taro flour to achieve a C/N ratio of 12; T2 with taro flour to achieve a C/N ratio of 15; T3 with taro flour to achieve a C/N ratio of 18; and T4 with taro flour to achieve a C/N ratio of 21. This design allowed for clear comparisons of the effects of different C/N ratios on biofloc formation. The study was conducted over a period of ~14 days since ammonia decomposition by nitrifying bacteria requires ~14 days to be completed [15].
2.2. Collection of Shrimp Aquaculture Waste
Shrimp aquaculture waste and floc starter were collected following the protocol of Shahidul Islam et al. [16], with minor adjustments. In brief, shrimp aquaculture waste was collected by siphoning pond sediment from a shrimp pond after 60 days of culture. Approximately 20 kg of sediment was collected and sun-dried for about 72 h. The dried sediment was then ground into a fine powder. Rearing water from a shrimp pond was used as a floc starter. Specifically, two liters of shrimp rearing water were collected using a sterile bottle, dipped ~30 cm below the water surface. The bottle was tightly sealed and placed in a cool box with ice cubes inside to maintain a low temperature.
2.3. Protein and Nitrogen Analysis
The shrimp aquaculture waste sediment was analyzed to assess its protein and nitrogen content. This analysis was conducted to compare the protein levels of the sediment before and after treatment. The nitrogen analysis aimed to measure the nitrogen content in the waste sediment, which helps determine the required carbohydrate sources for different C/N ratios. The results showed that the shrimp aquaculture waste sediment contained ~18.37% protein and ~2.94% nitrogen.
2.4. Calculation of Taro Flour Requirements
Taro flour was prepared following the method outlined by Rostianti et al. [17], with some modifications. Firstly, 2 kg of fresh taro was washed, peeled, and cut into small pieces before being soaked in water. The taro was then dried in an oven at a temperature of 50–60°C for 6 h. After drying, the taro was ground into flour. The carbohydrate content of the taro flour was analyzed, revealing a carbohydrate content of ~70.6%.
The nitrogen source used was shrimp farming wastewater sediment, while taro flour served as the carbohydrate source. The calculations were performed in grams. Based on these calculations, the amount of taro flour required was 0 g for T0, 27.953 g for T1, 36.026 g for T2, 44.270 g for T3, and 53.151 g for T4.
2.5. Converting Shrimp Aquaculture Waste Into Biofloc
Biofloc production began with the preparation of 3-l glass jars, each equipped with an aeration stone. In each jar, 2 l of seawater, 50 g of shrimp aquaculture waste sediment, and 100 ml of shrimp aquaculture wastewater were added and homogenized to serve as the inoculant for initiating a floc formation. Taro flour was then added to the culture medium according to the calculated amounts for each treatment.
2.6. Observed Parameters
2.6.1. Floc Formation Time
Floc formation was monitored during the first 7 days, as Jamal and Putra [18] indicated that floc can develop within this period, necessitating continuous observation. The time of floc formation was recorded based on when the floc first appeared. Indicators of floc formation were identified through microscopic observations.
2.6.2. Floc Volume and Biomass
Floc volume was measured every 7 days over a 14-day period. To determine the dry weight of the floc, a sample of 0.75 g of floc sediment from the volume measurements was analyzed using a moisture analyzer. The percentage of dry weight obtained from the analysis was then multiplied by the weight of the floc sample (0.75 g) to calculate the floc biomass.
2.6.3. Floc Size and Composition
Floc size was monitored every 7 days over a 14-day period. The size was determined by measuring the diameter of the floc. Observations were conducted under a microscope with a magnification of 400×, and the diameter measurements were recorded using the ImageJ application. Floc size was monitored every 7 days for 14 days, with the composition of the floc analyzed to identify the organisms present.
The composition was observed microscopically at a magnification of 400×. Phytoplankton and zooplankton were identified based on their morphological characteristics, using identification guides such as Tomas [20] for marine phytoplankton, Hasle et al. [21] for diatoms and dinoflagellates, Biggs and Kilroy [22] for periphyton in New Zealand, and Velasquez [23] for phytoplankton. Bacteria within the floc were identified based on their morphological characteristics through a Gram stain test. Bacterial morphology was observed under a microscope with a magnification of 1000×. Bacteria were classified as Gram-positive or Gram-negative based on color changes after Gram staining: purple indicated Gram-positive bacteria, while pink indicated Gram-negative bacteria [24]. After 14 days of observation, the floc was dried. The seawater was removed, and the sediment at the bottom of the container was collected and dried under sunlight for ~48 h before being ground into a fine powder. The dried floc was then analyzed for protein content through crude protein analysis, aiming to compare the protein levels before and after treatment.
2.7. Data Analysis
Data on floc formation time, volume, biomass, size, and protein content for each treatment were analyzed using one-way ANOVA, followed by Tukey’s test to identify the best-performing treatment. Comparisons of each treatment across different time points were also conducted using paired T-tests. Data analysis was performed using SPSS software version 22.
3. Results
3.1. Floc Formation Time
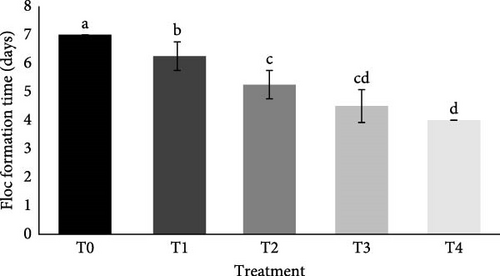
The C/N ratio had a significant effect on the time of floc formation (p < 0.05). Treatment T4 showed the fastest average time for floc formation (4 days), followed by T3 (4.5 days), T2 (5.25 days), T1 (6.25 days), and T0 (7 days, Figure 1). In general, the average time of floc formation was inversely proportional to the C/N ratio in the culture condition.
3.2. Floc Volume and Biomass
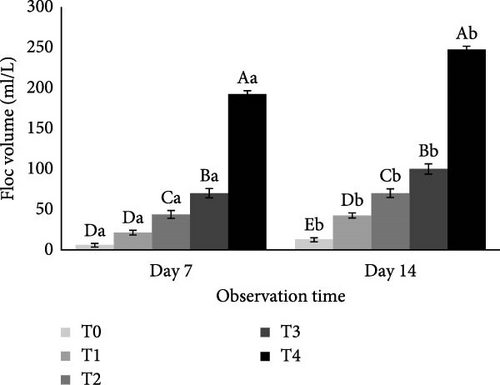
The C/N ratio significantly influenced floc volume (p < 0.05). On both day 7 and day 14, Treatment T4 achieved the highest average floc volumes of 192.5 and 247.5 ml/L, respectively. This was followed by T3 (70 and 100 ml/L), T2 (43.75 and 70 ml/L), T1 (21.25 and 42.5 ml/L), and T0 (6.25 and 13 ml/L), as shown in Figure 2. Floc volume increased from day 7 to day 14, with higher volumes generally corresponding to higher C/N ratios in the culture conditions.
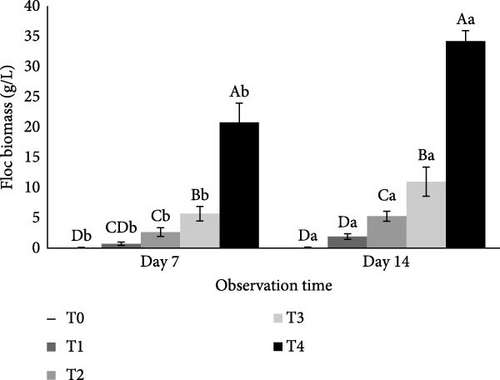
Similarly, the C/N ratio significantly affected floc biomass (p < 0.05). Treatment T4 had the highest average floc biomass on both day 7 and day 14, with values of 20.8 g/L and 34.21 g/L, respectively. This was followed by T3 (5.69 and 10.99 g/L), T2 (2.66 and 5.27 g/L), T1 (0.72 and 1.91 g/L), and T0 (0.06 and 0.28 g/L), as illustrated in Figure 3. Floc biomass increased from day 7 to day 14, with higher biomass levels generally associated with higher C/N ratios in the culture conditions.
3.3. Floc Size and Composition
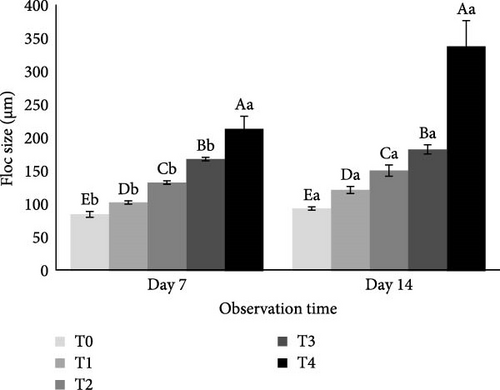
The C/N ratio had a significant effect on floc size (p < 0.05). Treatment T4 showed the largest average floc size on day 7 and day 14 (214.5 and 339 µm) followed by T3 (169 and 183 µm), T2 (133.5 and 151.5 µm), T1 (103 and 122.25 µm) and T0 (85.5 and 94.25 µm, Figure 4). Floc size increased on day 14 compared to day 7. In general, the average floc size was directly proportional to the C/N ratio in the culture condition.
The results of the floc composition from shrimp cultivation waste treated with different C/N ratios (Table 1). In this table, it is known that there were Bacillus spp., Chlorella sp., and Alona sp. in all treatments. In treatment, T4, Melosira sp., Paramecium sp., and Chroococcus sp. were found.
| Treatment | Floc compositions | |
|---|---|---|
| Phylum/division | Species | |
| T0 | Firmicutes | Bacillus spp. |
| Chlorophyta | Chlorella sp. | |
| Arthropoda | Alona sp. | |
| T1 | Firmicutes | Bacillus spp. |
| Chlorophyta | Chlorella sp. | |
| Arthropod | Alona sp. | |
| T2 | Firmicutes | Bacillus spp. |
| Chlorophyta | Chlorella sp. | |
| Arthropod | Alona sp. | |
| T3 | Firmicutes | Bacillus spp. |
| Chlorophyta | Chlorella sp. | |
| Arthropod | Alona sp. | |
| T4 | Firmicutes | Bacillus spp. |
| Chlorophyta | Chlorella sp. | |
| Bacillariophyta | Melosira sp. | |
| Ciliata | Paramecium sp. | |
| Cyanobacteria | Chroococcus sp. | |
| Arthropod | Alona sp. | |
- Note: T0 is a C/N ratio of ~1.18, T1 is a C/N ratio of 12, T2 is a C/N ratio of 15, T3 is a C/N ratio of 18, and T4 is a C/N ratio of 21.
3.4. Floc Crude Protein Content
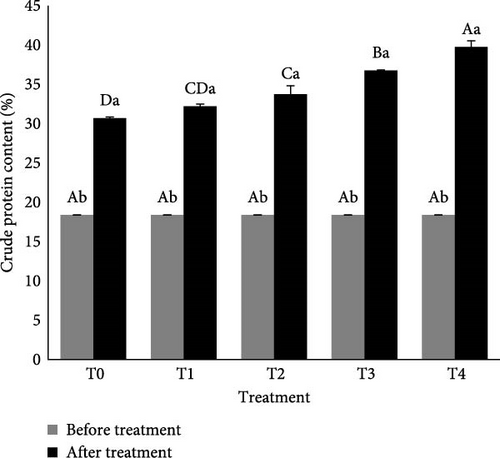
The C/N ratio significantly affected the crude protein content of the biofloc (p < 0.05). At the beginning, crude protein content was recorded at ~17% and not significantly among all treatments. After 14 days, crude protein content significantly increased compared to initial measurements in all treatments. Among the treatments, C/N ratio of 21 (T4) had the highest average floc crude protein content (39.75%), followed by T3 (36.75%), T2 (33.75%), T1 (32.2%), and control or T0 (30.7%), as illustrated in Figure 5. These result in general showed that higher C/N ratios in the culture conditions corresponds to the highest protein levels.
4. Discussion
This study reported a sustainable approach for converting shrimp aquaculture waste into high-quality biofloc by incorporating taro flour and manipulating the carbon-to-nitrogen (C/N) ratio. The findings emphasize the pivotal role of the C/N ratio in facilitating efficient floc formation and enhancing its nutritional quality. BFT operates on the principle of balancing carbon and nitrogen in the water to stimulate the growth of beneficial microorganisms that aggregate into flocs. These flocs not only help recycle nutrients but also serve as a potential feed ingredient rich in protein, essential amino acids, fatty acids, and other bioactive compounds. The present study explored the effects of varying C/N ratios, with particular focus on a high C/N ratio of 21, which yielded the most favorable outcomes in terms of floc development, microbial diversity, and nutrient enrichment.
The manipulation of the C/N ratio proved to be a critical factor in floc formation. The treatment with the highest C/N ratio (21) exhibited the most rapid and robust floc development, significantly increasing floc volume, biomass, and particle size within just 4 days. These findings support previous studies showing that higher C/N ratios foster optimal conditions for microbial growth and floc formation [25]. This effect is primarily attributed to the increased availability of carbon, which supports the proliferation of heterotrophic bacteria—the key drivers of biofloc formation. However, excess accumulation of biofloc can lead to higher TSSs, which can disrupt shrimp metabolism and increase mortality rates. Effective management of TSS is essential for sustaining shrimp health in BFT systems.
Taro flour, a rich source of carbohydrates, served as the external carbon input in this study. Its inclusion at higher concentrations promoted the activity of heterotrophic bacteria by supplying them with sufficient energy for growth and metabolism [26, 27]. These bacteria assimilate nitrogenous waste while utilizing the carbon source for cellular synthesis, which enhances the aggregation of floc particles and leads to the formation of a dense, nutrient-rich matrix [28]. Higher carbon inputs also result in improved floc consolidation, ultimately yielding larger and more stable flocs. The ability of heterotrophic bacteria to efficiently aggregate under these conditions is linked to enhanced cell-to-cell adhesion and extracellular polymeric substance (EPS) production, which reinforces the structure of the biofloc [29]. Moreover, elevated C/N ratios not only promote heterotrophic bacterial activity but also stimulate the growth of autotrophic organisms such as algae. These organisms utilize carbon for photosynthesis and provide oxygen to the system, thereby supporting a more diverse and stable microbial community. This symbiotic relationship enhances the ecological balance within the biofloc system and promotes nutrient cycling [27, 30]. However, improper regulation of biofloc can lead to nutrient imbalances, such as ammonia and nitrate buildup, which can be toxic to shrimp if left unchecked. Ensuring proper biofloc management is essential for the stability of the system.
Microbial community analysis revealed distinct differences across treatments, particularly under varying C/N ratios. In all treatments, Bacillus spp., Chlorella sp., and Alona sp. were consistently observed, reflecting their general tolerance to different nutrient conditions. However, at the highest C/N ratio (T4), additional species such as Melosira sp., Paramecium sp., and Chroococcus sp. were uniquely present. Their emergence indicates that a high C/N environment fosters greater microbial diversity by creating favorable conditions for the proliferation of multiple microbial taxa [30]. This microbial diversity plays a critical role in the overall stability and functionality of the biofloc system. Different microbial species contribute distinct metabolic capabilities, such as nitrogen assimilation, carbon fixation, and organic matter degradation. For instance, Bacillus spp. are known for their enzymatic activity and pathogen inhibition, while microalgae like Chlorella sp. enhance oxygen production and nutrient assimilation. Protozoa such as Paramecium sp. participate in the microbial loop by grazing on bacteria and contributing to nutrient recycling. A higher C/N ratio has been shown to benefit the growth of specific species like Melosira sp. and Chroococcus sp., which thrive in environments with abundant carbon, thereby contributing to the overall diversity of the microbial community. Their presence enhances nutrient cycling and microbial stability in the biofloc system.
One of the most significant outcomes of this study was the remarkable improvement in the nutritional profile of the produced biofloc. The crude protein content increased from 18.37% in the original waste to 39.75% in the biofloc harvested from the highest C/N ratio treatment. This improvement aligns with previous studies suggesting that high C/N ratios stimulate microbial protein synthesis by increasing the availability of carbon for heterotrophic bacterial growth [31, 32]. Moreover, this increase in protein content presents a promising solution for sustainable aquafeed production, which may help reduce reliance on traditional feed sources such as fishmeal, a costly and ecologically impactful ingredient.
Microorganisms, particularly heterotrophic bacteria, play a central role in converting nitrogenous waste into bacterial biomass, rich in protein and essential nutrients. Bacteria generally require a C/N ratio of around 20:1 for optimal growth, and when this threshold is surpassed—as in the C/N 21 treatment—microbial activity intensifies, leading to greater biomass accumulation and higher protein content in the floc [31, 33]. Moreover, the integration of algae and protozoa into the microbial community contributes additional protein and lipid components, further enhancing the nutritional value of the floc [34]. However, a key challenge remains in ensuring the long-term economic viability of biofloc-based aquafeed. Compared to commercial fishmeal, the cost-effectiveness of using taro flour as a carbon source warrants further investigation to assess the economic feasibility at larger scales.
The substantial increase in protein content indicates that biofloc generated under high C/N conditions has strong potential as a cost-effective and sustainable feed ingredient. Past studies have demonstrated that biofloc can replace up to 40% of fishmeal in shrimp diets without compromising growth performance, while also improving water quality through nutrient recycling [35]. Nevertheless, further research is needed to evaluate the practical challenges of large-scale implementation, including the management of nutrient imbalances and the economic costs of substituting taro flour for fishmeal in commercial systems.
5. Conclusions
This study demonstrates that shrimp aquaculture waste can be effectively converted into high-quality biofloc by optimizing the C/N ratio and incorporating taro flour. By adjusting the C/N ratio, specifically to 21, this study shows how biofloc formation can be significantly accelerated. A higher C/N ratio (21) accelerated floc formation, increased biomass yield, and enhanced crude protein content from 18.37% to 39.75%. The increase in protein content underscores the importance of higher C/N ratios in improving the nutritional quality of the biofloc. Additionally, microbial diversity improved, with beneficial species like Melosira sp. and Paramecium sp. emerging at higher C/N ratios. The presence of these species indicates a more diverse and functional microbial community, which is essential for optimal biofloc formation. However, challenges related to biofloc accumulation, nutrient imbalances, and economic viability must be addressed to ensure the widespread adoption of this method in commercial systems. This approach offers a sustainable solution for waste management while producing a nutritious, protein-rich ingredient for aquafeed, potentially reducing reliance on traditional protein sources like fishmeal and promoting sustainability in aquaculture feed production.
Conflicts of Interest
The authors declare no conflicts of interest.
Funding
The research was financially supported by Faculty of Science, Universiti Brunei Darussalam, Brunei.
Acknowledgments
Authors acknowledge the valuable technical support from colleagues at the Faculty of Fisheries and Marine, Universitas Airlangga during the experiment.
Open Research
Data Availability Statement
The data used to support the findings of this study are available upon request.


