Early Transcriptomic Profile of Mucosal Immune Responses in the Intestine of Japanese Puffer (Takifugu rubripes) Infected With Vibrio harveyi
Abstract
Japanese puffer (Takifugu rubripes) is an important mariculture species, but the development of the aquaculture industry has been accompanied by serious disease problems. Vibrio harveyi is one of the most important pathogens in T. rubripes. To gain a more comprehensive understanding of the molecular mechanism responsible for intestinal mucosal immunity of T. rubripes during V. harveyi infection, we established a transcriptome of the posterior intestine of T. rubripes after 0, 3, and 24 h of infection with V. harveyi. 12 fish (weighing 300 ± 5.5 g) were randomly selected from 60 T. rubripes and four were assigned to each time point. Transcriptomic analysis revealed 3,042 and 3,342 differentially expressed genes (DEGs) at 3 h and 24 h, respectively, compared with those at 0 h. Enrichment analysis of these DEGs revealed significant mucosal immune-related pathways, including cytokine–cytokine receptor interaction, phagosome, and cell adhesion molecules (CAMs) signaling pathways. In addition, the intestinal histopathological changes were explored after V. harveyi infection. Further analysis showed that the structure of infected intestines was still integrated, with the majority of the pathological trauma occurring in the submucosa. Our results provided new insights for further study of the mucosal immune defense mechanisms of fish against V. harveyi, promoting our understanding of this severe disease.
1. Introduction
The nutritional and medical benefits of Japanese puffer (Takifugu rubripes) make them a significant mariculture fish in China [1]. In 2022, the production of puffer fish in China was 16,626 tons, of which more than 5,000 tons were T. rubripes. Due to the rapid development of intensive T. rubripes aquaculture, multiple large-scale outbreaks of bacterial infection have occurred, including vibriosis, which is caused by Vibrio species [2, 3]. Among these, Vibrio harveyi is the main pathogenic bacterium of T. rubripes [4]. V. harveyi is acknowledged as a grave pathogen capable of inducing severe disease outbreaks in various marine creatures [5], including invertebrates and fish species [6]. Currently, there are no effective drug treatments for farmed fish infected with V. harveyi. To minimize the impact of V. harveyi on fish, it is crucial to understand the immune defense mechanisms of fish against V. harveyi.
In fish immunology, systemic immunity (spleen and head-kidney) has been extensively studied; however, mucosal immunity is poorly understood. The mucosal immune system is the first line of defense against pathogens [7]. It is composed of mucosal-associated lymphoid tissue (MALT), which mainly includes the gills, skin, intestines, and nasopharynx [8]. Intestinal immunity is of great significance to the fish farming industry. Under high-density culture conditions, the intestinal mucosal surface is the largest area in direct contact with the external environment and is also the main site where pathogens enter fish [9, 10]. In addition, the intestine is the center of nutrient absorption and microbial colonization [11]. Many immune cell types, humoral factors, and regulatory molecules have been identified in the fish intestine, where they participate in innate and adaptive immune responses [12]. After infection with V. harveyi, the galectin genes of T. rubripes [13] and the toll-like receptor 5 gene of Lateolabrax japonicus [14] were highly expressed in the intestinal mucosal tissues and participated in immune defense against V. harveyi infection. These studies showed that immune-related molecules in the intestinal mucosa of fish are essential for protecting the organism from V. harveyi infection and for developing tolerance. Therefore, a comprehensive understanding of the immunomodulatory properties of fish intestinal mucosa could help to develop new strategies to prevent and treat V. harveyi infection in aquaculture.
Transcriptome analysis is a powerful tool that can provide insights into various physiological pathways during host–pathogen interactions, including immune responses [15]. In recent years, RNA sequencing (RNA-seq)-based transcriptome analysis has been used in some studies to understand the immune response of fish intestines to bacterial infections [16]. The representative study is that in channel catfish (Ictalurus punctatus), intestinal RNA-seq analysis revealed that many genes associated with immune activation, attachment, and pathogen recognition were differentially expressed after infection with Edwardsiella ictalurid [17]. However, transcriptomic information in fish intestines after infection with V. harveyi is quite limited and was only mentioned in the study by Xia et al. [18] and Zhou et al. [19]. To expand our knowledge at the molecular level, we conducted RNA-Seq analysis to investigate the immune response in the intestines of T. rubripes after V. harveyi infection. Additionally, different intestinal segments have different functions. It is generally believed that the posterior part of the intestine is the most immune relevant region [20]. This notion has been confirmed in sea bass by measuring constitutive expression of intestinal immune genes [21]. Therefore, in comparative experiments, we collected the posterior part of the intestine for transcriptomic analysis.
The goals of this study were to reveal the molecular process by which the fish intestinal mucosa responds to V. harveyi infection and identify the pathways and genes related to immune defense by transcriptomic sequencing. The transcriptomic sequence data will enhance our understanding of the intestinal immune defense mechanisms of T. rubripes and other farmed fish against V. harveyi infection.
2. Materials and Methods
2.1. Ethics Approval
The Experimental Animals Ethical Review Committee of Dalian Ocean University approved all fish-related procedures in this study. The ethics approval code is DLOU2024035. The animal species used in the study was Takifugu rubripes and in total 60 individuals. The objective of this study was to study the transcriptomic profile and pathological changes of the intestine of T. rubripes infected with Vibrio harveyi. No alternative way which does not involve animal experiments could be a substitute. All the T. rubripes individuals were raised in seawater with continuous air bubbling till doing experiments. The time of air exposure was minimized to less than 5 min during the experiments for each T. rubripes, which was set as the humane end point. To avoid adverse effects of animal experiments, all the T. rubripes individuals used were subject to autoclaving and then discarded as biological waste. All the animal experiments complied with the rules stipulated by the Experimental Animals Ethical Review Committee of Dalian Ocean University.
2.2. Bacteria and Fish
The healthy T. rubripes (average weight 300 ± 5.5 g) were purchased from a local supplier (Tianzheng Industrial, Dalian, China). These fish were temporarily maintained in a recirculating water system in the laboratory at 20°C for 7 days prior to the experimental challenge. The identified strain of V. harveyi (GenBank accession number PQ357177.1) was initially isolated from naturally diseased T. rubripes on the farms. The strain (2HWM001) was preserved at the Aquatic Animal Hospital of Dalian Ocean University.
2.3. Bacterial Challenge and Tissue Collection
Twelve fish were randomly selected from 60 T. rubripes and divided into three groups of four fish each: one control group and two challenge groups. Fish from the control group were always maintained in clean water. The challenge groups were immersed at a final concentration of 5 × 10⁸ CFU/ml of V. harveyi for 3 h and subsequently transferred to clean water. Fish before immersion were served as control group (I0) and compared with fish at 3 h and 24 h after immersion (I1 and I2). Each fish was euthanized using MS-222 (100 mg/L), and the posterior intestine tissue was removed, gently washed with sterile PBS, and placed in an EP tube of RNase-Free. The collected samples were subjected to RNA extraction after being flash-frozen in liquid nitrogen.
2.4. Total RNA Isolation, cDNA Library Construction
Total RNA was extracted from the samples using TRIzol reagent (Invitrogen, Carlsbad, CA, USA) in accordance with the manufacturer’s protocol. The quality of the RNA was assessed using an Agilent 2100 Bioanalyzer (Agilent, Santa Clara, CA, USA). The cDNA libraries were constructed from RNA samples of the highest purity. The NEBNext Ultra RNA Library Prep Kit (NEB, Ipswich, MA, USA) from Illumina (San Diego, CA, USA) was utilized to create sequencing libraries. The mRNA was enriched using Oligo (dT), followed by the synthesis of the first cDNA strand in reverse. The RNA strand was subsequently degraded by RNaseH, and the second cDNA strand was synthesized using the DNA polymerase I system. After cDNA purification, end repair, A-tail addition, and ligation, cDNA fragments rangingfrom from ~250–300 bp were selected using the AMPure XP system (Beckman Coulter, Brea, CA, USA). PCR amplification was performed, and the amplified products were purified again using the AMPure XP system, resulting in the final library.
2.5. RNA Sequencing and Sequence Data Processing
All libraries were sequenced on the Illumina HiSeq platform, generating 150 base pair of paired-end reads. The raw data obtained from sequencing was filtered to remove adapters and lower-quality reads. FastQC was employed to assess the sequence quality of pristine data, including metrics such as Q20, Q30, and GC-content. All subsequent analyses were conducted based on high-quality data derived from clean reads. The reference genome and gene model annotation files were downloaded directly from the Genome website. HISAT2 v2.0.5 was used to construct the index of the reference genome and to align the paired-end clean reads to the T. rubripes reference genome [22]. Featurecuctv1.5.0-p3 was utilized to compute gene read numbers. Subsequently, the expression level of each gene was normalized using Fragments Per Kilobase of exon model per Million mapped fragments (FPKM).
2.6. Identification and Validation of Differentially Expressed Genes
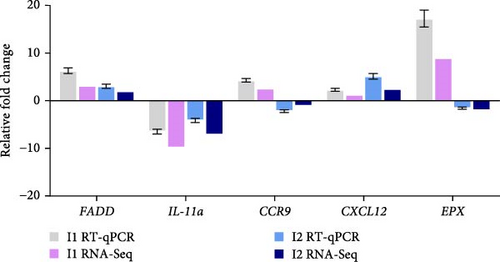
Differential expression analysis between two groups was performed using the DESeq2 R package (1.16.1) [23], identifying genes with an adjusted p-value of less than 0.05 as differentially expressed genes (DEGs). Further functional analysis of the DEGs was carried out utilizing the Gene Ontology (GO) and Kyoto Encyclopedia of Genes and Genomes (KEGG) databases. Enrichment analyses of DEGs were performed using the cluster Profiler R (3.4.4) software, which corrects for gene-length bias. The top terms were selected based on their p-values. Volcano plots, as well as GO and KEGG pathway enrichment maps, were generated using an online data analysis and visualization platform (https://www.bioinformatics.com.cn). Finally, five immune-related genes were selected to validate the sequencing data using RT-qPCR. The primer sequences were designed with the software Primers Premier 5.0 (Table 1), and GAPDH served as the internal reference gene [24, 25]. The RT-qPCR analysis was conducted on a Step One Plus Real-Time PCR system (ABI, USA) utilizing SYBR green I fluorescent dye. A 20 μl reaction mixture was prepared, which included 2 μl of cDNA, 10 μl of SYBR Green Master Mix (2×), 1 μl each of forward and reverse primers, and 6 μl RNase-free H2O. The RT-qPCR procedure consisted of an initial denaturation at 95°C for 10 s, followed by 40 cycles of denaturation at 95°C for 10 s, annealing at 60°C for 10 s, and extension 72°C for 30 s. The relative expression fold changes of each gene were calculated according to the 2−∆∆CT method [26]. The data are presented as the mean ± S.E.M of four repetitions. Statistical and visual analysis of the data were performed using GraphPad Prism 9 software.
| Accession numbers | Primer name | Primer sequence (5′-3′) | Product size | Description |
|---|---|---|---|---|
| NM_001280115.1 | GAPDH |
|
228 | Glyceraldehyde-3-phosphate dehydrogenase |
| XM_003966248.3 | IL-11a |
|
147 | Interleukin-11a |
| XM_029846511.1 | FADD |
|
179 | FAS-associated death domain protein |
| XM_011617728.2 | CCR9 |
|
181 | C–C chemokine receptor type 9 |
| XM_003971936.3 | CXCL12 |
|
168 | C–X–C motif chemokine ligand 12 |
| XM_003965512.3 | EPX |
|
219 | Eosinophil peroxidase-like |
2.7. Histopathological Analysis
To examine the histopathological changes, the posterior intestines from four fish were sampled at different time intervals (0, 3, and 24 h) for pathological analysis. The collected samples were preserved in 4% paraformaldehyde. After 24 h, they were embedded in paraffin, sectioned into 5 μm slices, and stained with hematoxylin and eosin for further analysis under a light microscope.
3. Results
3.1. Quality of the T. rubripes Intestinal Transcriptomic Data
The quality results of total RNA samples from each group (control: I0, 3 h: I1, 24 h: I2), tested using the Agilent 2,100, are presented in Supporting Information: Figure S1. The rRNA ratio (28 S:18S) for each group was 1.8, while the RNA integrity numbers (RIN) were 9.4, 9.5, and 9.8, respectively. These results indicated that the purity and integrity of the extracted RNA samples met the essential requirements for RNA sequencing, making them suitable for library construction and analysis. Table 2 lists the characteristics of the 12 cDNA libraries generated from T. rubripes intestinal samples from the control and infected groups. Approximately 222,185,606, 259,415,558, and 261,774,216 clean reads were obtained from the I0, I1, and I2 groups, respectively. Q30 is a standard measure of clean reads quality, and the Q30 percentage was greater than 93.99%. Among the clean reads, the percentage of total reads mapped to the reference genome exceeded 90%. Overall, the quality of the sequencing results was exceptionally high.
| Time pointe | Sample | Raw reads | Clean reads | Total mapped reads | Q20 (%) |
Q30 (%) |
GC (%) |
|---|---|---|---|---|---|---|---|
| 0 hr | I01 | 63,014,500 | 61,825,646 | 57509078 (93.02%) | 97.93 | 94.14 | 51.77 |
| I02 | 54,820,656 | 53,840,962 | 50356756 (93.53%) | 97.99 | 94.32 | 52.21 | |
| I03 | 50,783,790 | 49,795,048 | 46345681 (93.07%) | 98.07 | 94.55 | 52.00 | |
| I04 | 57,700,546 | 56,723,950 | 52964477 (93.37%) | 98.16 | 94.85 | 51.79 | |
| 3 hr | I11 | 71,521,676 | 70,588,242 | 65671757 (93.03%) | 97.86 | 93.99 | 51.76 |
| I12 | 63,054,846 | 62,229,596 | 58222929 (93.56%) | 98.01 | 94.35 | 51.75 | |
| I13 | 63,968,320 | 62,997,794 | 58586627 (93.00%) | 97.93 | 94.18 | 51.86 | |
| I14 | 64,518,136 | 63,599,926 | 59005628 (92.78%) | 97.86 | 94.03 | 51.96 | |
| 24 hr | I21 | 71,274,938 | 70,397,448 | 65628294 (93.23%) | 97.92 | 94.15 | 51.80 |
| I22 | 61,670,134 | 60,928,224 | 57135053 (93.77%) | 98.32 | 95.19 | 51.65 | |
| I23 | 69,392,118 | 68,425,916 | 63702265 (93.10%) | 98.22 | 94.98 | 51.55 | |
| I24 | 62,881,900 | 62,022,628 | 58022820 (93.55%) | 98.20 | 94.97 | 51.65 | |
- Note: Q30: Percentage of nucleotides passed Q30 (Q30: error rate = 1/1000); Q20: Percentage of nucleotides passed Q20 (Q20: error rate = 1/100)
- Abbreviation: GC, Percentage of GC content.
3.2. Differentially expressed genes
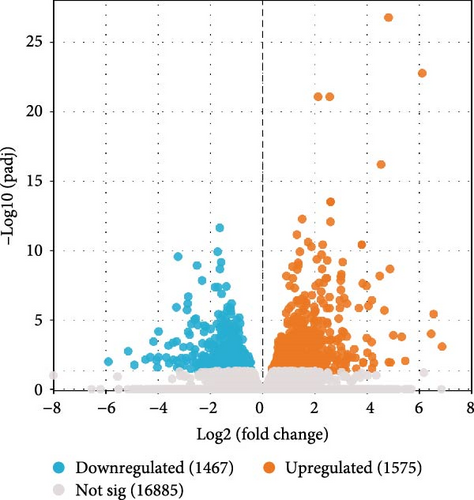
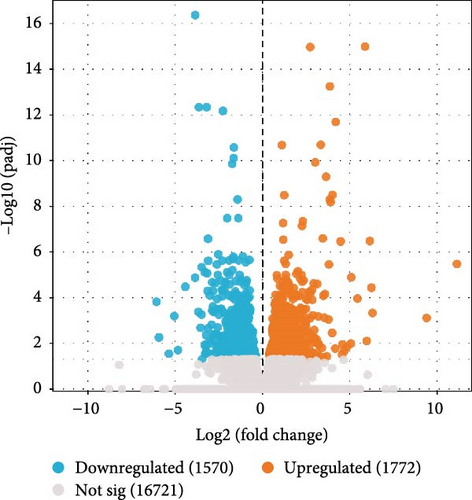
The p-values of DEGs were adjusted using DEseq, with the following screening criteria: | log2 (fold change) | > 0 and padj < 0.05. In the I1 vs. I0 comparison, a total of 3042 DEGs were identified, comprising 1,575 upregulated and 1,467 downregulated genes. In the I2 vs. 10 comparison, 3,342 DEGs were identified, including 1,772 upregulated and 1,570 downregulated genes (Figure 1).
3.3. Gene Ontology and Kyoto Encyclopedia of Genes and Genomes Enrichment Analysis of Differentially Expressed Genes
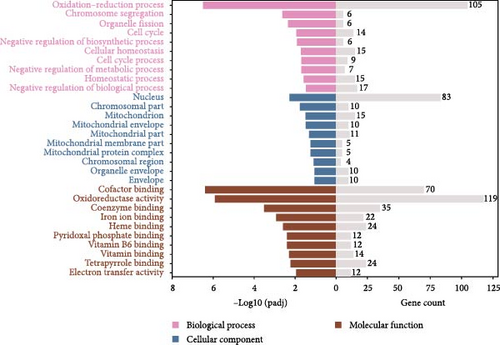
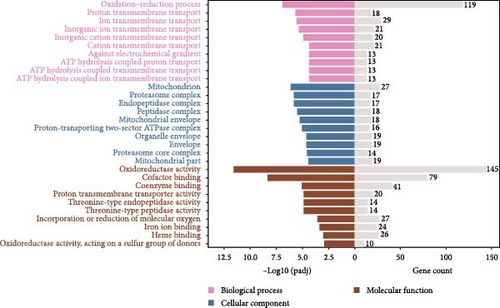
Figure 2 illustrates the top 10 GO terms for each category. In the I1 vs. I0 comparison, a total of 897 GO terms were enriched, which included 924 DEGs enriched in the biological process (BP) category, 502 in the cellular component (CC) category, and 1,483 in the molecular function (MF) category. In the I2 vs. I0 comparison, 915 GO terms were enriched, comprising 491 in BP, 114 in CC, and 310 in MF. Within the BP category, the oxidation–reduction process emerged as the most abundant subcategory in both groups (I1 vs. I0 and I2 vs. I0). Additionally, numerous DEGs were enriched in terms related to immune defense (Table 3). In the CC category, the nucleus and mitochondrion were the most significantly enriched terms in the I1 vs. I0 and I2 vs. I0 comparisons, respectively. In the MF category, binding and catalytic activities were the most representative terms for both comparisons.
| Accession | Description | Fold change | |
|---|---|---|---|
| Response to stress | — | I1VSI0 | I2VSI0 |
| rna-XM_029826975.1 | FA complementation group D2 | 2.46 | 2.89 |
| rna-XM_003971541.3 | Heat shock protein HSP 90-alpha | 3.94 | 10.63 |
| rna-XM_011617647.2 | GEN1 Holliday junction 5′ flap endonuclease | 3.07 | 3.18 |
| rna-XM_011610952.2 | Nei like DNA glycosylase 3 | 2.23 | 1.96 |
| rna-XM_003965512.3 | Eosinophil peroxidase-like | 8.94 | −2.01 |
| rna-XM_011613279.2 | RAD9-HUS1-RAD1 interacting nuclear orphan 1 | 1.40 | 2.04 |
| rna-XM_003965199.3 | UV excision repair protein RAD23 homolog B | 1.34 | 2.20 |
| rna-XM_011609798.2 | TIMELESS interacting protein | 2.13 | 2.77 |
| rna-XM_029829552.1 | Probable glutathione peroxidase 8 | −2.64 | −2.10 |
| rna-XM_029829672.1 | General transcription factor IIH subunit 2-like | −4.53 | −1.92 |
| rna-XM_011612765.2 | Fibrinogen gamma chain | −1.47 | −2.13 |
| Immune response | — | — | — |
| rna-XR_003890556.1 | Uncharacterized LOC115252108 | 32.22 | 13.83 |
| rna-XM_029844557.1 | Ectonucleotide pyrophosphatase/phosphodiesterase family member 3-like | 2.62 | −1.04 |
| rna-NM_001246294.1 | C–X–C motif chemokine ligand 13 | 2.25 | 8.51 |
| rna-XM_003971936.3 | C–X–C motif chemokine ligand 12 | 1.25 | 2.48 |
| rna-XM_011610690.2 | Platelet basic protein-like | 1.11 | 4.23 |
| rna-XM_003965542.3 | Uncharacterized LOC101078464 | −9.85 | −9.32 |
| rna-XM_029844556.1 | Ectonucleotide pyrophosphatase/phosphodiesterase family member 2-like | −2.25 | −2.25 |
| rna-NM_001037985.1 | Tumor necrosis factor alpha | −2.99 | −2.08 |
| Novel.647 | PF00048: Small cytokines (intecrine/chemokine), interleukin-8 like | −2.06 | 1.01 |
| Cell adhesion | — | — | |
| rna-NM_001170360.1 | Wnt family member 2 | 2.62 | 1.39 |
| rna-XM_029829369.1 | Hyaluronan and proteoglycan link protein 1-like%2C transcript Variant x1 | 4.32 | 7.31 |
| rna-XM_029826739.1 | Stabilin-1-like | −2.36 | −2.77 |
| rna-XM_003972414.3 | SMAD family member 1 | −2.31 | −2.22 |
| rna-XM_029831500.1 | Collagen alpha-1(XVIII) chain | −2.07 | −1.68 |
| rna-XM_003968323.3 | Frizzled class receptor 4 | −2.08 | −1.09 |
| rna-XM_011612212.2 | Collagen type XVIII alpha 1 chain%2C transcript Variant x6 | −1.49 | −2.73 |
| rna-XM_029832399.1 | Cadherin-2 | −1.58 | −2.08 |
| rna-XM_029851360.1 | FAT atypical cadherin 1%2C transcript Variant x2 | −1.97 | −4.66 |
| rna-XM_003975364.3 | Epidermal growth factor receptor | 1.11 | −2.28 |
| Apoptotic process | — | — | — |
| rna-XM_029846511.1 | FAS-associated death domain protein | 3.16 | 1.99 |
| rna-XM_029844142.1 | Caspase-1-like | 1.39 | 2.16 |
| rna-XR_003887596.1 | Uncharacterized LOC115248876 | −1.11 | −2.17 |
| rna-XM_011617267.2 | Caspase recruitment domain family member 14 | 1.12 | −3.20 |
| rna-XR_003888889.1 | MCL1 apoptosis regulator%2C BCL2 family member%2C transcript Variant x2 | −1.20 | −2.08 |
| rna-XM_003965229.3 | BCL2/adenovirus E1B 19 kDa protein-interacting protein 3-like | −2.64 | −5.90 |
- Note: Bold values indicate the p < 0.05.
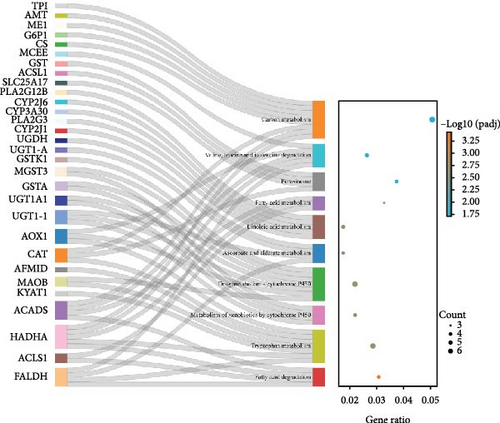
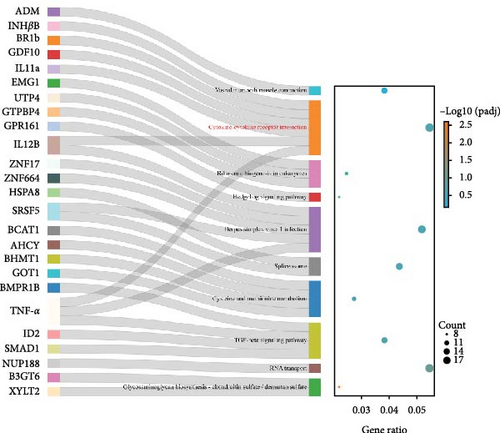
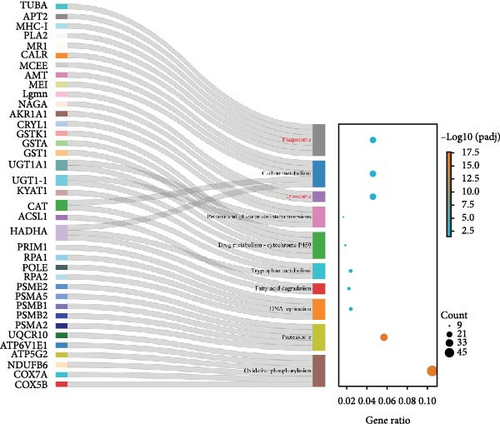
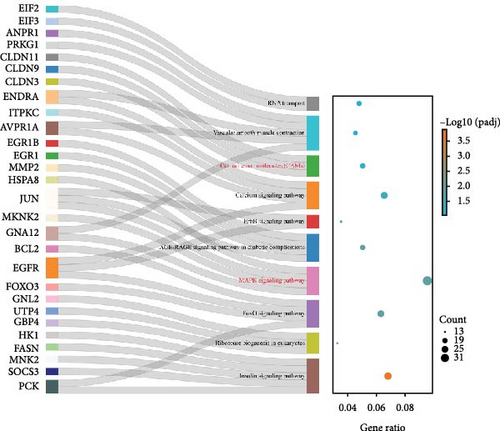
Figure 3 presents the top 10 enriched KEGG pathways for each comparison, along with the genes exhibiting | log2 (fold change) | > 1 and adjusted p-value (padj) < 0.05 in each pathway. For the I1 vs. I0 comparison, 454 DEGs were assigned to 139 pathways, with metabolism-related pathways being particularly active and enriched with a substantial number of upregulated DEGs. Furthermore, several immune-related pathways were activated, with the enriched DEGs predominantly being downregulated. In the I2 vs. I0 comparison, numerous DEGs were assigned with immune response pathways, including phagosome, lysosome, and cell adhesion molecules (Table 4).
| Description | Gene name | Fold change | |
|---|---|---|---|
| Cytokine–cytokine receptor interaction | I1VSI0 | I2VSI0 | |
| C–X–C motif chemokine ligand 13 | CXCL13 | 2.24 | 8.50 |
| Interleukin-11a | IL-11a | −9.88 | −7.15 |
| Interleukin-12 subunit beta-like | IL-12 B | −4.57 | −1.47 |
| Tumor necrosis factor alpha | TNFα | −3.00 | −2.08 |
| Intestinal immune network for IgA production | |||
| C–X–C motif chemokine ligand 12 | CXCL12 | 1.25 | 2.48 |
| C–C chemokine receptor type 9-like | CCR9 | 2.55 | −1.10 |
| Phagosome | |||
| Calreticulin | CALR | 1.53 | 2.59 |
| Macrophage mannose receptor 1-like | MR1 | 12.23 | 15.98 |
| Phospholipase A2 receptor 1 | PLA2 | 3.13 | 2.56 |
| Class I histocompatibility antigen F10 α chain-like | MHC I | 1.04 | 2.96 |
| Antigen peptide transporter 2 | APT2 | 1.17 | 2.83 |
| Tubulin alpha-1C chain-like | TUBA | 2.05 | 2.29 |
| p22phox protein | p22phox | 3.11 | −1.17 |
| MAPK signaling pathway | |||
| G protein subunit alpha 12 | GNA12 | −1.27 | −2.11 |
| MAPK interacting serine/threonine kinase 2 | MKNK2 | 1.00 | −3.39 |
| Transcription factor AP-1 | AP-1 | 1.04 | −2.08 |
| Transcription factor jun-D | jun-D | 2.06 | −1.23 |
| Growth arrest and DNA damage inducible alpha | GADD45A | 4.10 | 1.84 |
| Fibroblast growth factor 22 | FGF22 | 1.50 | 9.30 |
| Cell division cycle 25 B | CDC25B | 2.95 | 2.64 |
| Cytochrome c oxidase subunit 6 C-1 | COX6C | 1.69 | 2.00 |
| Heat shock cognate 71 kDa protein-like | HSC70 | −2.01 | −2.91 |
| Heat shock 70 kDa protein 1-like | HSPA1L | 9.26 | 11.82 |
| Angiopoietin 2 | ANGPT2 | 3.39 | 1.65 |
| Cell adhesion molecules (CAMs) | |||
| Claudin-3 | CLDN3 | −2.08 | −3.27 |
| Claudin-4 | CLDN4 | 1.98 | −1.22 |
| Claudin-9 | CLDN9 | −3.55 | −2.05 |
| Claudin-11 | CLDN11 | −1.96 | −3.22 |
| Selectin P | CD26P | −6.66 | −1.10 |
- Note: Bold values indicate the p < 0.05.
3.4. Validation of Differentially Expressed Genes by Real-Time Quantitative PCR
To evaluate the reliability and accuracy of the sequencing data in response to V. harveyi infection, we randomly selected five immune-related DEGs and analyzed their expression by real-time quantitative PCR (RT-qPCR). As illustrated in Figure 4, the results from RT-qPCR were consistent with those obtained from RNA-Seq. Specifically, the expression levels of CCR9, EPX, and FADD increased at 3 h post-infection and subsequently decreased. In contrast, the expression level of IL-11a sharply declined after infection before gradually increasing. The expression levels of CXCL12 showed a continuous increase following infection. The fold-change values for each gene are detailed in Supporting Information: Table S2. Although the measured gene expression patterns exhibited slight variations from those observed in the transcriptome analysis, the overall trends remained fundamentally consistent.
3.5. Histopathological Analysis
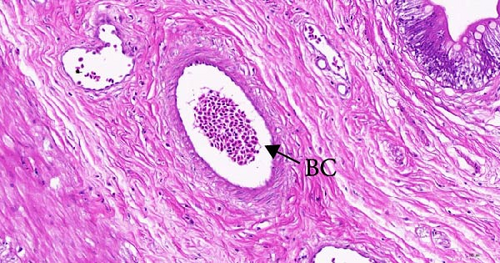
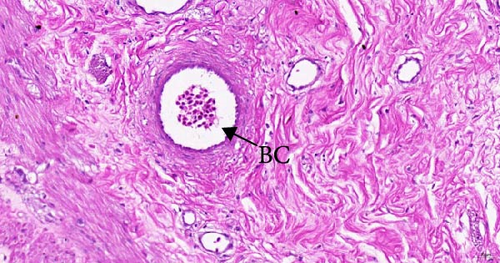
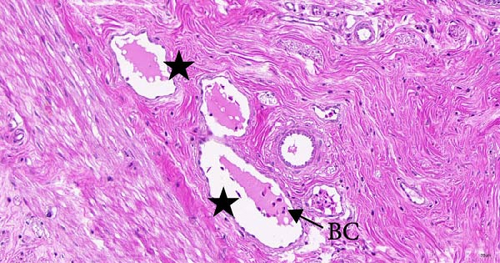
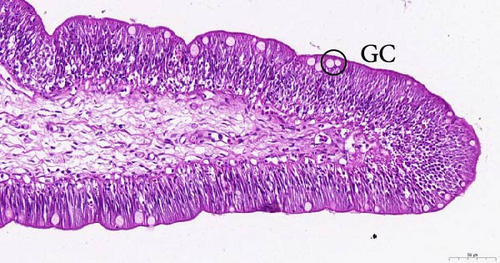
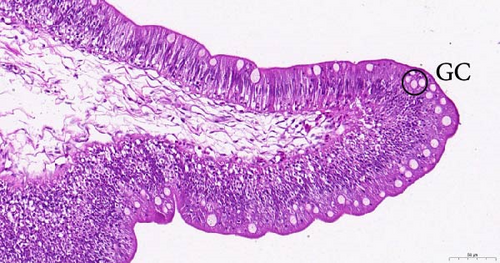
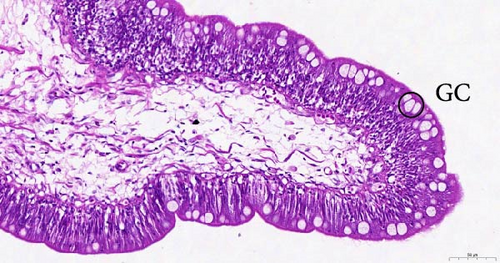
To investigate the histopathological alterations in the intestine of T. rubripes following infection with V. harveyi, intestinal tissues from the control group and the two infection groups were processed for hematoxylin-eosin staining. As the duration of V. harveyi infection in T. rubripes increased, varying degrees of pathological changes were observed, including rupture or erosion of the blood cells in the submucosa of the intestine (Figure 5B, C) and proliferation of goblet cells in the intestinal mucosal epithelium (Figure 5E, F). The overall structure of the infected intestines remained intact, and the majority of goblet cells were tightly aligned. The primary site of pathological trauma was identified as the intestinal submucosa.
4. Discussion
The intestine is a crucial mucosal tissue and the main site of bacterial infection, playing a vital role in coordinating both innate and adaptive immune responses in fish [16, 17]. This study is the first to report the intestinal transcriptomic profile of T. rubripes after infection. Due to the heterogeneity of the intestine, we selected the posterior intestine, which is the primary segment involved in the immune response, for sequencing. This choice was made to minimize confusion arising from gene expression patterns across different intestinal segments. Nevertheless, there are still multiple cell types in the tissues collected, and it is difficult to avoid observing mixed results [10]. Future research may be better suited to analyze the expression of these candidate genes in specific cell types through the utilization of laser capture microdissection or enzyme purification methodologies. However, given the current difficulties in analyzing individual cell types, we accepted this compromise in our initial studies to gain a broader understanding of the intestinal immune response following infection. In addition, previous studies have shown that GADPH is the most suitable reference gene in the intestine of Nile Tilapia [24]. Therefore, this study employed GADPH as the reference gene to validate DEGs. However, the expression levels of reference genes may fluctuate under varying conditions. To obtain more accurate results in future RT-qPCR analyses of T. rubripes, comprehensive research into the selection of reference genes is essential.
In this study, 3,042 and 3,342 DEGs were obtained from the intestines of T. rubripes infected with V. harveyi at 3 h and 24 h, respectively. Functional enrichment analysis showed that the metabolic pathways contained the most abundant DEGs, and most of them were upregulated. Similar results were also observed in the study on the early transcriptomic profile of the liver and spleen of T. rubripes with V. harveyi infection [27]. In addition, a variety of immune-related signaling pathways, such as cytokine–cytokine receptor interaction, cell adhesion molecules (CAMs), and phagosome, were also enriched. These pathways help us explore the immune defense process of the T. rubripes intestine during the early stages of V. harveyi infection.
It is widely accepted that pathogen stimulation inhibits the function of the host immune system. The immune defense response of the organism to pathogens may have tissue specificity. Some innate immune factors, including various cytokines and complement components, have been found in the gill and spleen of the T. rubripes [28]. Similarly, V. harveyi infection also induced changes in some inflammatory cytokines in the intestine. Among them, IL-11a, IL-12 B, and TNFα were significantly downregulated, while CCR9, CXCL12, and CXCL13 were significantly upregulated. These DEGs suggested in the fish intestine also exhibited a significant immune response to V. harveyi. Notably, most of the immune-related DEGs were downregulated after infection, indicating that V. harveyi partially suppressed intestinal immune function in the early stages of infection. The complement system, as the pillar of immune defense, plays a vital role in activating the innate immune system [29]. We founded that complement C4 and complement C1q-like protein 2-like also showed significant downregulation after V. harveyi challenge compared with the control group. These data suggested V. harveyi triggers immune dysfunction by inhibiting the expression of complement factors and cytokines in the fish intestine, leading to immune-related diseases.
CAMs are a special class of receptor molecules that are widely present on cell membranes, participating in various pathological and physiological processes by mediating the adhesion between cells [30–32]. P-selectin (CD62P) mediates the adhesion between platelets and endothelial cells as well as between these cells and leukocytes [33]. It is crucial for maintaining normal defense mechanisms in the body and participating in early inflammatory responses. Currently, studies on CD62P have been widely reported in humans and mammals. For the I1 vs. I0 comparison, the expression level of CD62P in the intestine decreased by 6.6 times. This indicates that CD62P is also involved in the immune defense process of fish against pathogenic bacteria. Furthermore, several claudin genes within this pathway are also significantly downregulated following infection. Claudins are the main components of transmembrane proteins that are crucial for tight junction integrity and primarily regulate paracellular permeability. Dysfunction of tight junctions can lead to changes in intestinal tissue permeability [34]. For instance, a previous study identified that V. harveyi induces intestinal edema in T. rubripes [4]. Additionally, claudins were also reported to be involved in biological processes related to pathogen infections. For instance, a significant downregulation of the claudin genes was observed in the intestines of channel catfish 3 h post-infection with enteric septicemia [35], which aligns with our findings. Specifically, claudin-3, claudin-9, and claudin-11 were downregulated by 2.08, 3.55, and 1.96 times, respectively, 3 h after V. harveyi infection. This suggests that claudins are also involved in the early immune response to V. harveyi infection.
Phagosomes are the core mechanisms by which organisms remove bacteria and are essential during the immune response process [36]. In the I2 vs. I0 comparison, many upregulated DEGs, such as TUBA, CTSL, CALR, APT2, and MR1, were involved in the phagocytic process of pathogens. These results are similar to those of a study on tilapia phagocytes against defensive Aeromonas hydrophila infection conducted by Zhang et al. [37]. Mannose receptors are important pattern recognition and endocytosis receptors that are essential for identifying pathogens and regulating the innate immune system [38, 39]. In this study, MR1 was upregulated 16-fold in the I2 vs. I0 comparison, indicating that it is a key effector gene in the phagosome pathway. However, MR1 was significantly downregulated in the transcriptome of the spleen of Cyprinus carpio koi infected with Aeromonas veronii for 24 h [40]. The differences in MR1 expression patterns may be related to the different mechanisms of pathogenic bacteria, indicating the complexity and diversity of their functions. The results of this study further demonstrate that MR1 plays a crucial role in the antibacterial immunity of fish. Additionally, it suggests that some immune processes against bacteria have been conserved during the evolution of fish.
Histopathological studies can directly and accurately reflect the pathological changes in tissues and cells, providing a reliable basis for future clinical treatments and disease diagnoses. Our histopathological examination revealed significant hyperplasia of the intestinal epithelial goblet cells in the infected T. rubripes. In the intestinal mucosal barrier, mucus secreted by goblet cells forms a protective layer on the surface of the intestinal mucosal epithelium [22]. This mucus plays a crucial role in resisting invasion by foreign bacteria and regulating host immune responses [41]. Studies have demonstrated number of goblet cells is regulated by the Notch signaling pathway [42, 43]. Our transcriptomic data indicate that the Notch signaling pathway is also enriched with numerous DEGs. Therefore, in addition to the immune-related pathways mentioned earlier, the Notch signaling pathway may also be involved in the immune defense of the gut against V. harveyi. Notably, MAML3 was downregulated 16-fold 3 h after infection with V. harveyi. As a known transcriptional co-activator in the Notch signaling pathway, MAML3 is essential for human development and disease. However, the regulatory effects of MAML3 in fish have been rarely reported. Consequently, MAML3 may be a key molecule in maintaining intestinal immune homeostasis.
The intestinal mucosal barrier also plays a crucial role in preventing the transfer of bacteria and endotoxins into the body [44]. When this barrier is disrupted, bacterial antigens from the gut can penetrate it, causing tissue damage [45]. In the present study, blood cytolysis was observed in the lamina propria of the T. rubripes intestine. This may be attributed to the disruption of tight junction functions between the cells. Because several genes associated with cell-to-cell tight junctions, particularly claudin-3, claudin-9, and claudin-11, were significantly downregulated following infection in this study. Research has indicated that claudin-3 is responsible for regulating the paracellular permeability of fish enterocytes [46]. Meanwhile, claudin-9 and claudin-11 are essential for maintaining permeability between vascular endothelial cells [47]. Therefore, the inhibition of claudin genes expression by V. harveyi may significantly facilitate its entry into the body. This inhibition decreases the synthesis of claudin-associated proteins, resulting in increased permeability between epithelial cells. Since these genes are enriched in the CAMs signaling pathway, the critical role of CAMs signaling in resistance to V. harveyi infection is further emphasized. In addition, hemolysis has been caused by the virulence factor hemolysin (VHH) of V. harveyi [48, 49]. Studies have shown that this cytotoxin can induce ultrastructural changes, apoptosis, and rupture of red blood cells, leading to pathological changes in the tissues [50]. However, the overall pathological changes observed were mild, which may be attributed to the stage of infection and the protective function of intestinal mucus. Further studies will be more targeted to compare changes in intestinal mucosal pathology and mucus composition at different stages of infection.
5. Conclusion
In this study, Illumina Hiseq TM 2500 technology was used to establish the posterior intestine transcriptomic of the T. rubripes 0 h, 3 h, and 24 h after infection with V. harveyi. These DEGs were further screened to identify the key factors involved in intestinal mucosal immunity in T. rubripes and to analyze their expression patterns during the early stages of resistance to V. harveyi infection. Histopathological analysis of the posterior intestine revealed the key role of goblet cells in resisting V. harveyi infection and the potential mechanisms of V. harveyi infection in the intestine. This study provides necessary reference for further study the mucosal immunity defense mechanism of T. rubripes against V. harveyi, promoting our better understanding of this severe disease.
Disclosure
An earlier version of the manuscript has been presented as a preprint [52], but the content submitted has not been formally published, and this submitted manuscript is a revised version.
Conflicts of Interest
The authors declare no conflicts of interest.
Author Contributions
Yihao Li, Hongli Ma, and Shigen Ye conceived and designed the study. Xiaocen Lu, Zhixin Guo, Peilin Zhou and Yanhong Cui performed both animal feeding and laboratory experiments, analyzed the sequencing data, interpreted the data and prepared the figures and tables. Yihao Li wrote the manuscript. Shigen Ye helped interpret the data and wrote and revised the paper.
Funding
This work was financially supported by the Major Special Project of Science and Technology of Liaoning Province, China (2020JH1/10200002) and the Liaoning Provincial Department of Education “Basic Scientific Research” (JYTMS20230485).
Acknowledgments
Any AI software have not been used in the preparation of the manuscript. We thank Mingjie Chen (Shanghai NewCore Biotechnology Co., Ltd.) for providing data analysis and visualization support.
Supporting Information
Additional supporting information can be found online in the Supporting Information section.
Open Research
Data Availability Statement
The data that support the findings of this study are available from the corresponding author upon reasonable request.


