Unlocking Growth, Nutrition, and Pigmentation Potential of Chlorella sp., and Gonyostomum sp. Cultured in Cost-Effective, Biological Waste-Based Media
Abstract
Microalgae are highly nutritious and fast-growing organisms that are utilized in aquaculture as premix for feed formulation and as live feed for the larvae culture industry. The aim of the research was to reduce live feed production costs for aquaculture through the utilization of cow dung as a biological waste. This research reports on the growth, pigments, and nutritional contents of two marine microalgal species (Chlorella sp., and Gonyostomum sp.). Each of the microalgae was cultured in four treatments: C (control, conway medium), T1 (50% conway, 50% cow dung), T2 (25% conway, 75% cow dung), and T3 (100% cow dung). The outcomes exhibited that the C treatment of Chlorella sp. and T1 treatment of Gonyostomum sp. had the highest growth in terms of cell density. Moreover, both species had significantly higher (p < 0.05) protein percentage in C which were 42.7% ± 4.03%, and 42.9% ± 1.96%, respectively, and greater total lipid and carbohydrate contents in either T1 or T2 treatment. Gonyostomum sp. exhibited the highest carotenoid content (2.48 ± 0.09 µg/mL) in C, while Chlorella sp. had significant amount of total phycobiliprotein contents in all treatments compared to Gonyostomum sp. Although polyunsaturated fatty acid (PUFA) contents were higher in conway medium, both of the microalgae in T1 and T2 treatments had high saturated fatty acids (SAFA) and monounsaturated fatty acid (MUFA) contents. Furthermore, both species had notable concentrations of nonessential amino acids in comparison to essential amino acids. The cost estimation confirmed C had the highest preparation cost compared to other treatments.
1. Introduction
Microalgae are among the most captivating aquatic species in the field of aquaculture because they are a valuable source of numerous natural products. Fast growth rates, high productivity, ease of cultivation, no need for farm land, quick harvest cycles, a significant lipid content, and photosynthetic efficiency are advantages that microalgae offer [1]. Microalgae are recognized for their diverse and rich biochemical profile, containing substantial amounts of proteins, lipids, carbohydrates, vitamins, minerals, fatty acids, amino acids, and pigments [2, 3]. They have gained attention as a sustainable and promising alternative to conventional animal- and plant-based protein sources [4]. Microalgae have the ability to cut down the reliance on traditional raw materials in aquafeed due to their high nutritional value, favorable effects on the growth rate of aquatic species due to increased triglyceride and protein deposition in muscle, enhanced disease resistance and decreased nitrogen content into the environment, omega-3 fatty acid content, and metabolic activity [5]. Recently, there has been a tremendous increase in the industrial cultivation of microalgae with the purpose of producing biofuels and various bioproducts [6].
The cultivation medium is one of the main elements influencing the rapid growth of microalgae. The production of desired biomolecules (such as pigments, lipids, proteins, biomass, etc.) can be improved by the modification of the culture medium [7]. The productivity of biomass and the composition of biomolecules, especially fatty acid production in microalgae, can be increased by modifying cultivation techniques, such as altering the growth medium’s nutritional components, ambient conditions, and microalgae development phases [8, 9].
Cattle manure is an affordable and nutritional medium for growing microalgae, typically consisting of 18%–25% dry matter and containing 5.2–6.1 g/kg of total nitrogen, 1.3–2.1 g/kg of phosphorus, and 3.5–6.0 g/kg of potassium [10]. Das et al. [11] found remarkable growth of marine Chlorella sp. in cow dung medium in comparison to other different organic and inorganic media. Chlorella vulgaris FSP-E had a higher percentage of biomass as well as greater lipid (10.1%) and protein (2.0%) content when a 25% compost mixture combination was used [12]. Earlier studies have demonstrated that including Chlorella vulgaris in fish diets at concentrations between 2.5% and 10% enhances metabolic activity, supports beneficial gut microbiota, improves carcass quality, and promotes overall growth performance [13]. Another microalgae, Gonyostomum sp. contains 42.86% protein, 13.56% carbohydrates, and 27.4% lipids, making it a potential candidate for use in animal nutrition, particularly as an ingredient in fish feed formulations [14]. Therefore, this study focused on these two marine microalgal species to explore their potential in cow dung medium.
For microalgae to be utilized as food for shrimp and fish, they must be easily accessible and available in sufficient quantities. To meet that demand, mass cultures of microalgae are required. Various commercial media that provide the nutrients essential for the growth of microalgae are being used for large-scale cultivation of microalgae. Such synthetic media are relatively expensive and made from chemical salts, which are not sustainable as these are typically derived from nonrenewable resources. Therefore, medium that is easily available and affordable is currently needed to decrease the production cost. Development of cost-effective alternative medium is driven by concerns about sustainability and cost minimization for the industrial cultivation of microalgae.
Using cost-effective medium derived from biological waste, such as cow dung, not only supports convenient microalgae production but also promotes waste recycling for innovative culture medium development. Moreover, the development of a cost-effective mass culture protocol for microalgae as live feed for marine fish and shrimp hatcheries is a prime concern to enhance the blue economy of Bangladesh. The goal of this study was to evaluate and compare the growth rate, nutritional profile, and pigment content of Chlorella sp., and Gonyostomum sp. cultured in cost-effective cow dung medium and commercial medium.
2. Materials and Methods
2.1. Collection and Maintenance of Microalgae Culture
Pure isolates of Chlorella sp., and Gonyostomum sp. were obtained from the Live Feed Research Corner, Chattogram Veterinary and Animal Sciences University. The samples of Chlorella sp. were cultured at 25 ppt salinity and Gonyostomum sp. at 8 ppt salinity. The pure cultures of microalgae were kept in a controlled environment with the following parameters: 25.2 ± 0.8°C, 7.74 ± 0.19 pH, 4.55 ± 0.49 mg/L dissolved oxygen through gentle aeration, and 152 µE/m2/s light intensity for 24 h.
2.2. Media Preparation
Conway medium was prepared according to the methods by Tompkins and De Ville [15]. The composition of conway medium is depicted in Table 1.
| Names of chemicals | Quantity |
|---|---|
| Main mineral solution | |
| NaNOз/KNOз | 100.00 g/116.00 g |
| Disodium EDTA (C10 H16N2O8) | 45.00 g |
| H3BO3 | 33.60 g |
| NaH2PO4.4H2O | 20.00 g |
| FeCL3.6H2O | 1.30 g |
| MnCL2.4H2O | 0.36 g |
| Trace metal solution | 1.00 mL |
| Dissolving in deionized/distilled water and make the volume 1 L | |
| Trace metal solution | |
| ZnCl2 | 2.10 g |
| CoCl3.6H2O | 2.00 g |
| (NH4)6MO7O2.4H2O | 0.90 g |
| CuSO4.5H2O | 2.00 g |
| Dissolving in deionized/distilled water and make the volume 1 L | |
| Vitamin | |
| Thiamine, B1 | 0.20 g |
| Cyanocobalamin, B12 | 0.01 g |
| Dissolved in deionized/distilled water and make the volume 100 mL | |
Raw cow dung was collected from the cattle farm of Chattogram Veterinary and Animal Sciences University. It was dried in the sun properly and then homogenized to get a dry powder. The powder was then soaked in culture water for 24 h, then vortexed (Vortex Mixer, VM-10, Witeg, Germany) for 2–4 min and sonicated (Ultrasonic Bath, Model-621.06.010, ISOLAB, Germany) at 37 kHz for 15 min to ensure proper mixing. Subsequently, sonication, the liquid solution was filtered to get rid of the particles using 12.5 cm Double Rings filter paper (10 micron, Hangzhou Xinhua Paper Industry CO. Ltd., China). The liquid part of the solution was combined with culture water and autoclaved for 15 min at 121°C to achieve the appropriate concentration of culture medium. For each species, the salinity was adjusted prior to medium preparation, 25 ppt for Chlorella sp., and 8 ppt for Gonyostomum sp. using filtered seawater. The conway medium was prepared by adding the required nutrients to this salinity-adjusted seawater. For the cow dung treatments, dried cow dung powder was soaked in the same pre-adjusted seawater (25 or 8 ppt), and the resulting extract was mixed with conway chemicals to prepare the medium while ensuring consistent salinity.
2.3. Experimental Design
In the earlier phase of the study, both Chlorella sp., and Gonyostomum sp. were cultured in easily obtainable organic cow dung medium at 5, 8, 11, 14, and 17 mg of concentration (each mg of cow dung diluted in 250 mL of culture water). The growth of both microalgae was found to be higher in 11 mg of concentration, and thus, it was selected to continue the further experimental activities. The experiment was then divided into four treatments which were control (C), treatment 1 (T1), treatment 2 (T2), and treatment 3 (T3). The T3 treatment involved the individual culture of each microalgae (Chlorella sp., and Gonyostomum sp.) in an 11 mg concentration of cow dung (11 mg of cow dung diluted in 250 mL of culture water). Other treatments for the microalgal samples were set as C (Control having 100% conway medium), T1 (50% conway medium + 50% 11 mg concentration of cow dung medium), and T2 (25% conway medium + 75% 11 mg concentration of cow dung medium). However, after determining the growth curve in T3 treatment, mass culture of each microalgae in this treatment was attempted, but the biomass was found to be significantly insufficient to support additional experimental activities. That is why, it was not considered for further nutritional and pigment analysis.
2.4. Determination of Growth Curve Based on Cell Density
The microalgae were cultured using the selected medium. In sterile 500 mL borosilicate Erlenmeyer flasks with 250 mL culture volumes, three replicates of each species were cultivated, where each flask contained 4% pure culture stocks in an environment equivalent to that of pure cultures. Eventually, the growth curve based on cell density (cells/mL) was completed by running the experiment until the death phase.
Microalgae cell count was carried out every day by using a Neubauer hemacytometer (0.0025 mm2, 0.1 mm deep chambers, Assistent, Germany). The hemacytometer and its cover slip (Bright-line upgraded Neubauer hemacytometer, 0.0025 mm2, 0.1 mm deep chambers, Assistent, Germany) were thoroughly cleaned with Milli-Q water (Millipore Corp.) to ensure that it was clear of any dust, lint, or grease before the chambers were filled with culture samples. The evenness of cell distribution was assessed using the Nikon E600 microscope at low power magnification (4x and 10x). Cells in the two chambers of the hemacytometer were counted under a 40x magnification. The cells were counted by using the equation previously described [16].
2.5. Determination of Pigments
The amount of extracted carotene from the samples in micrograms was determined by multiplying the absorbance (A450) by 25.2 [17]. The estimation of phycobiliproteins consists of the estimation of phycocyanin (PC), allophycocyanin (APC), and phycoerythrin (PE). The amounts of PC, and APC in the sample were calculated according to Bennett and Bogorad [18] and PE was calculated according to Siegelman et al. [19]. Total PC, PE, and APC (mg/g) were calculated according to Silveira et al. [20]. Total phycobiliproteins (mg/g) were further calculated from the sum of the PC, PE, and APC contents in dried microalgae biomass.
2.6. Determination of Proximate Composition
Protein and carbohydrate were calculated by using the methodology of Lowry et al. [21] and DuBois et al. [22], respectively. For that, 5 mg of each freeze-dried microalgal biomass was required. Lipid was calculated using the methods of Folch et al. [23] and Bligh and Dyer [24]. In this method, 60 mg of each sample was taken for the determination of lipid contents.
2.7. Determination of Fatty Acid
To ascertain the fatty acid composition, the two-step transesterification method—also known as the 2TE method—with a few modifications was used [25]. 500 mg of microalgae powder was dissolved in 70 mL of diethyl ether in a beaker used for lipid extraction. Lipid extraction was performed using the FOOD ALYTRD40 Digital Soxhlet Apparatus. 1.5 mL methanolic NaOH and 2 mL BF₃ methanol were sequentially added to the lipid extract, with sonication at 80°C for 5 and 30 min, respectively, followed by cooling at room temperature between steps. The mixture was treated with 1 mL isooctane and 5 mL saturated NaCl to separate FAMEs, which were collected from the upper layer. FAMEs were analyzed by GCMS (GC-2020plus, SHIMADZU) using a capillary column (30 m × 0.25 mm × 0.15 μm) with helium (1.42 mL/min) as carrier gas. The oven was programed from 180 to 280°C at 5°C/min. FAMEs were identified by retention times compared to a standard mix (C8–C24, Sigma-Aldrich).
2.8. Determination of Amino Acid
The method for identifying amino acids, originally described by Moore et al. [26], was modified for this analysis. 1 g of dried microalgae biomass was hydrolyzed in 25 mL of 6 M HCl with 0.1% phenol at 110 ± 2°C for 24 h. After cooling, SDB/Na was added for stabilization, and the pH was adjusted to 2.1 − 2.3. The hydrolysates were filtered, diluted, and transferred to vials for analysis. Amino acids were quantified using a SYKAM S 433 analyzer (UV detector) with nitrogen gas (0.5 mL/min, 60°C) as carrier. Concentrations were calculated using the AA-S-18 standard (Sigma-Aldrich, Germany) and expressed in mg/g biomass and as % of total amino acids.
2.9. Statistical Analysis
Using Microsoft Excel 2007, the mean and standard deviation of the data were determined. The R studio software was used for conducting statistical analyses. To examine collected data, an ANOVA was carried out at a 95% confidence level, Tukey’s multiple comparison tests were used to identify significant differences between treatments. The purpose of the post hoc test was to distinguish between the groups.
3. Results
3.1. Growth Performance of Different Microalgae Cultured in Four Different Treatments of Cow Dung Medium
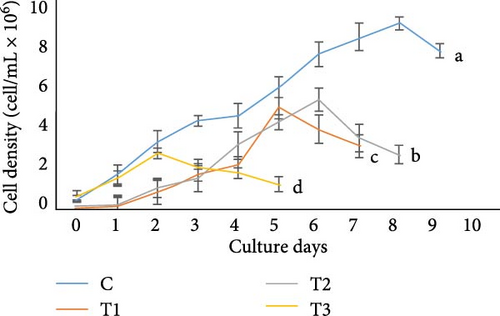
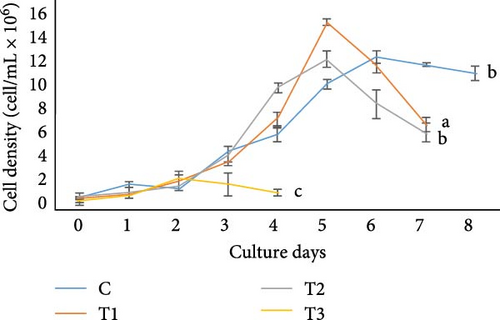
In the present study, Chlorella sp., and Gonyostomum sp. in different media showed different cell concentrations (Figure 1). The growth of Chlorella sp. was significantly higher in C, according to the results. At the stationary phase, the cell density in this medium was found 8.91 ± 0.31 × 10⁶ cells/mL, which was significantly higher (p < 0.05) than any other treatment. At the stationary phase, T3 treatment had the lowest cell density (2.69 ± 0.25 × 10⁶ cells/mL). In case of Gonyostomum sp., out of all the treatments, significantly higher (p < 0.05) cell density, 14.26 ± 0.23 × 10⁶ cells/mL were obtained in T1 while lower (p < 0.05) cell density 2.38 ± 0.56 × 10⁶ cells/mL was obtained in T3 at their stationary phases among all other treatments. On the other hand, in terms of cell density, no significant difference (p > 0.05) was found between C and T2.
3.2. Pigment Content Analysis
3.2.1. Carotenoid
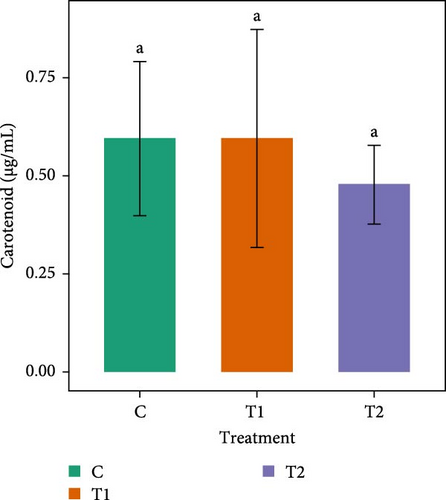
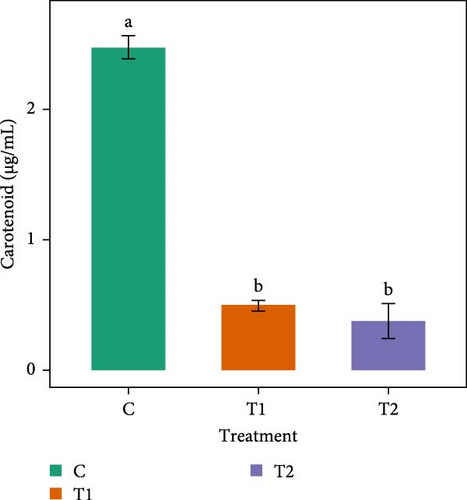
Figure 2 shows that the carotenoid content of Chlorella sp. in all treatments did not vary significantly (p > 0.05) among the treatments. In Gonyostomum sp., significantly higher (p < 0.05) carotenoid content (2.48 ± 0.09 µg/mL) was observed in C. T1 and T2 had almost a similar amount of carotenoid content.
3.2.2. Phycobiliprotein
The mean values of total phycobiliprotien were found to be significantly different (p < 0.05) among all the treatments of Chlorella sp. in Table 2. Though all the treatments did not show significant variation in PC content, but T1 had significantly higher (p < 0.05) PE content (0.77 ± 0.01 mg/g), and C had significantly higher (p < 0.05) APC (2.58 ± 0.13 mg/g) content. Total phycobiliprotein content including PC, PE, and APC was significantly higher in C of Gonyostomum sp. T1 and T2 treatments did not show any significant variation (p > 0.05) in PE contents.
| Microalgae | Treatment | Phycocyanin (mg/g) | Phycoerythrin (mg/g) | Allophycocyanin (mg/g) | Total Phycobiliprotein (mg/g) |
|---|---|---|---|---|---|
| Chlorella sp. | C | 0.64 ± 0.13a | 0.58 ± 0.10b | 2.58 ± 0.13a | 3.79 ± 0.34a |
| T1 | 0.55 ± 0.01a | 0.77 ± 0.01a | 1.62 ± 0.02b | 2.94 ± 0.05b | |
| T2 | 0.55 ± 0.01a | 0.68 ± 0.02b | 0.88 ± 0.02c | 2.11 ± 0.01c | |
| Gonyostomum sp. | C | 0.33 ± 0.07a | 0.41 ± 0.05a | 1.05 ± 0.08a | 1.79 ± 0.07a |
| T1 | 0.17 ± 0.01b | 0.24 ± 0.02b | 0.52 ± 0.02b | 0.92 ± 0.01c | |
| T2 | 0.12 ± 0.02c | 0.21 ± 0.03b | 0.95 ± 0.04a | 1.28 ± 0.07b | |
- Note: Values with the different letters within each series indicate significant differences (p < 0.05) among the treatments. Values are means ± SD.
3.3. Proximate Analysis
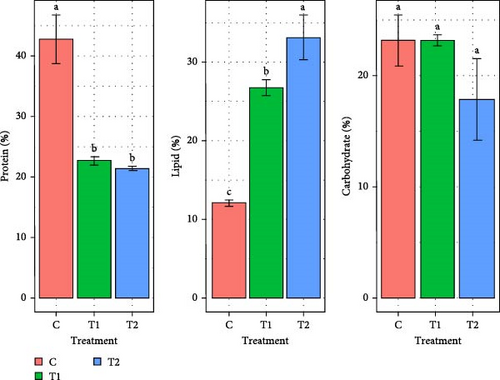
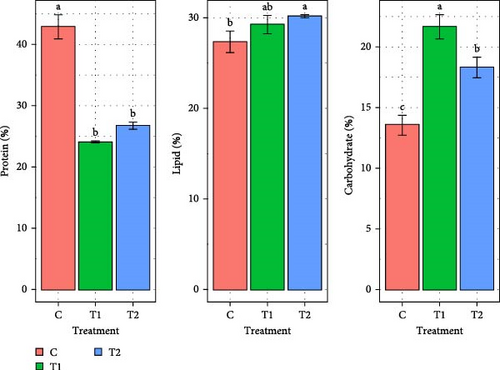
Figure 3 represents the change of protein, lipid and carbohydrate content of marine microalgae Chlorella sp., and Gonyostomum sp. for all the treatments (C, T1, and T2). Chlorella sp. had the highest protein (42.7% ± 4.03 %) in the C. In comparison to other treatments, T2 had significantly higher (p < 0.05) lipid content of 33.1% ± 2.83 %. No significant difference (p > 0.05) was found in carbohydrate content among all the treatments. In case of Gonyostomum sp., significantly (p < 0.05) higher amount of protein (42.9% ± 1.96 %) and lower amount of carbohydrate (13.6% ± 0.84 %) contents were observed in C. The lipid content of this species did not significantly differ (p > 0.05) between T1 and T2 treatments. T1 had the highest amount of carbohydrate content.
3.4. Fatty Acid Analysis
Fatty acid composition of two microalgae is depicted in Table 3. Saturated fatty acids (SAFAs) were significantly higher (p < 0.05) in T1 followed by T2 and C treatments, while monounsaturated fatty acids (MUFAs) were significantly higher (p < 0.05) in T2 followed by T1 and C treatments and poly unsaturated fatty acids (PUFAs) were significantly higher (p < 0.05) in C followed by T2 and T1 treatments, in both Chlorella sp., and Gonyostomum sp.
| Carbon | Chlorella sp. | Gonyostomum sp. | ||||
|---|---|---|---|---|---|---|
| C | T1 | T2 | C | T1 | T2 | |
| C6:0 | ND | 0.16 ± 0.05a | ND | ND | 0.15 ± 0.04a | 0.16 ± 0.06a |
| C8:0 | ND | 0.33 ± 0.03a | 0.12 ± 0.03b | 0.45 ± 0.03a | 0.27 ± 0.06b | 0.29 ± 0.04b |
| C10:0 | 2.18 ± 0.04a | 0.52 ± 0.03b | 0.16 ± 0.03c | 0.41 ± 0.03c | 0.45 ± 0.01b | 0.53 ± 0.03a |
| C11:0 | ND | 3.82 ± 0.02a | 0.88 ± 0.04b | ND | 2.4 ± 0.02a | 0.68 ± 0.06b |
| C12:0 | 1.64 ± 0.04a | 0.18 ± 0.04b | ND | 1.4 ± 0.05a | 0.12 ± 0.03c | 0.32 ± 0.01b |
| C13:0 | ND | 0.20 ± 0.03a | ND | 0.11 ± 0.05b | 0.24 ± 0.03a | 0.24 ± 0.10a |
| C14:0 | 0.44 ± 0.02c | 2.09 ± 0.01a | 1.78 ± 0.03b | 0.05 ± 0.03b | ND | 4.69 ± 0.08a |
| C15:0 | 0.69 ± 0.03b | 1.15 ± 0.02a | 0.25 ± 0.01c | ND | 0.36 ± 0.04a | 0.21 ± 0.01b |
| C16:0 | 29.1 ± 0.10b | 24.6 ± 0.03c | 31.8 ± 0.04a | 0.62 ± 0.05c | 0.81 ± 0.06b | 9.72 ± 0.03a |
| C18:0 | 1.66 ± 0.04a | 0.58 ± 0.03c | 0.88 ± 0.03b | 0.15 ± 0.03c | 0.23 ± 0.02b | 6.74 ± 0.04a |
| C20:0 | 1.79 ± 0.03c | 25.5 ± 0.02a | 7.35 ± 0.03b | 2.7 ± 0.04c | 58.8 ± 0.07a | 14 ± 0.03b |
| C17:0 | 0.70 ± 0.03a | 0.43 ± 0.03b | 0.15 ± 0.03c | 1.15 ± 0.08a | 0.29 ± 0.06b | 0.27 ± 0.03b |
| C21:0 | ND | ND | ND | 0.01 ± 0.01a | ND | ND |
| C22:0 | ND | 0.31 ± 0.02a | 0.12 ± 0.01b | ND | ND | 0.12 ± 0.03a |
| C23:0 | ND | ND | ND | 0.05 ± 0.03b | 0.75 ± 0.01a | ND |
| C24:0 | ND | 0.3 ± 0.01a | 0.24 ± 0.03b | ND | 0.21 ± 0.04a | 0.13 ± 0.02b |
| ∑SAFA | 38.2 ± 0.09c | 60.17 ± 0.11a | 43.73 ± 0.15b | 7.10 ± 0.17c | 65.08 ± 0.39a | 38.1 ± 0.19b |
| C14:1 | ND | 0.65 ± 0.02a | 0.19 ± 0.02b | ND | 0.49 ± 0.06b | 0.65 ± 0.03a |
| C15:1 | ND | 0.14 ± 0.02a | ND | ND | ND | ND |
| C16:1 | 16.14 ± 0.172c | 18.2 ± 0.05b | 21.8 ± 0.01a | 2.27 ± 0.04a | 1.29 ± 0.06b | 0.91 ± 0.03c |
| C17:1 | ND | 2.11 ± 0.03b | 3.81 ± 0.04a | ND | 0.12 ± 0.01b | 0.52 ± 0.05a |
| C18:1 | 3.47 ± 0.04c | 5.65 ± 0.02b | 8.77 ± 0.03a | 0.09 ± 0.05c | 0.74 ± 0.06b | 7.38 ± 0.01a |
| C22:1 | ND | ND | ND | 0.06 ± 0.04b | 0.14 ± 0.03a | 0.14 ± 0.02a |
| C20:1 | 0.66 ± 0.18a | 0.31 ± 0.03b | ND | 0.003 ± 0.01b | 0.28 ± 0.08a | 0.36 ± 0.04a |
| C24:1 | ND | ND | ND | ND | 1.20 ± 0.02a | 0.12 ± 0.01b |
| ∑MUFA | 20.27 ± 0.11c | 27.06 ± 0.07b | 34.57 ± 0.02a | 2.42 ± 0.12c | 4.26 ± 0.10b | 10.08 ± 0.05a |
| C18:2n−6 | 23.28 ± 0.57a | 4.07 ± 0.03c | 10.10 ± 0.02b | 89.2 ± 0.05a | 0.36 ± 0.04c | 13.3 ± 0.02b |
| C18:3n−6 | 8.99 ± 0.11a | 0.19 ± 0.05b | ND | ND | 0.76 ± 0.04b | 1.06 ± 0.05a |
| C20:2 | ND | 0.17 ± 0.03a | ND | ND | ND | ND |
| C20:4n−6 | 1.56 ± 0.34b | ND | 2.19 ± 0.04a | 0.63 ± 0.04a | 0.19 ± 0.08c | 0.32 ± 0.04b |
| C20:3n−6 | ND | 1.73 ± 0.04a | ND | 0.07 ± 0.03a | ND | ND |
| C22:2 | ND | 0.34 ± 0.01a | 0.16 ± 0.03b | ND | 1.27 ± 0.06a | 0.14 ± 0.04b |
| ∑n−6 PUFA | 33.83 ± 0.41a | 6.5 ± 0.11c | 12.45 ± 0.06b | 89.9 ± 0.07a | 2.58 ± 0.14c | 14.82 ± 0.14b |
| C18:3n−3 | ND | 4.45 ± 0.29b | 8 ± 0.03a | 0.35 ± 0.05b | 0.42 ± 0.03b | 36.2 ± 0.03a |
| C20:3n−3 | ND | 0.26 ± 0.02a | ND | ND | 0.16 ± 0.04a | 0.17 ± 0.03a |
| C20:5n−3 | 4.22 ± 0.03a | 1.15 ± 0.03b | 0.86 ± 0.04c | 0.17 ± 0.06a | ND | 0.15 ± 0.03a |
| C22:5n−3 | 1.65 ± 0.28a | ND | ND | 0.03 ± 0.02a | ND | ND |
| C22:6n−3 | 1.83 ± 0.07a | 0.41 ± 0.03b | 0.39 ± 0.06b | 0.03 ± 0.01c | 27.5 ± 0.09a | 0.48 ± 0.04b |
| ∑n−3 PUFA | 7.7 ± 0.37b | 6.27 ± 0.29c | 9.25 ± 0.11a | 0.58 ± 0.12c | 28.08 ± 0.15b | 37.0 ± 0.10a |
| ∑PUFA | 41.53 ± 0.05a | 12.77 ± 0.18c | 21.7 ± 0.14b | 90.48 ± 0.06a | 30.66 ± 0.29c | 51.82 ± 0.24b |
| ∑UFA | 61.8 ± 0.09a | 39.83 ± 0.11c | 56.27 ± 0.15b | 92.9 ± 0.17a | 34.92 ± 0.39c | 61.9 ± 0.19b |
- Note: Values with the different letters within each series indicate significant differences (p < 0.05) among the treatments. Values are mean ± SD.
- Abbreviations: MUFA, monounsaturated fatty acid; ND, not detected; PUFA, polyunsaturated fatty acid; SAFA, saturated fatty acid; UFA, unsaturated fatty acid.
3.5. Amino Acid Analysis
Data on the amino acid profile of two microalgal species in their different treatments are summarized in Table 4. The essential amino acid composition of Chlorella sp. in T1 and T2 treatments was not significantly different (p > 0.05), though C had significantly greater essential amino acid of 46.2% ± 0.68%. However, both species had notable concentrations of leucine in essential amino acids and their nonessential amino acids contained higher aspartic and glutamic acids. Gonyostomum sp. contained significantly higher essential amino acid in T1 and T2 treatments while nonessential amino acids in C.
| Amino acid (%) | Chlorella Sp. | Gonyostomum Sp. | ||||
|---|---|---|---|---|---|---|
| C | T1 | T2 | C | T1 | T2 | |
| Histidine | 5.02 ± 0.07b | 5.35 ± 0.67ab | 6.05 ± 0.07a | 4.08 ± 0.11a | 4.4 ± 0.22a | 4.36 ± 0.24a |
| Isoleucine | 4.4 ± 0.4a | 2.58 ± 0.45b | 2.69 ± 0.33b | 2.21 ± 0.17a | 2.07 ± 0.18a | 2.06 ± 0.11a |
| Leucine | 8.81 ± 0.22a | 7.54 ± 0.5b | 7.4 ± 0.41b | 8.36 ± 0.21a | 8.59 ± 0.31a | 8.89 ± 0.51a |
| Lysine | 5.1 ± 0.19a | 3.28 ± 0.18c | 4.18 ± 0.31b | 5.71 ± 0.3a | 4.83 ± 0.33b | 4.62 ± 0.39b |
| Methionine | 1.22 ± 0.19c | 2.98 ± 0.08b | 4.21 ± 0.08a | 1.66 ± 0.17b | 0.48 ± 0.25c | 3.32 ± 0.23a |
| Phenylalanine | 6.3 ± 0.51a | 6.67 ± 0.44a | 6.59 ± 0.28a | 4.15 ± 0.27c | 5.28 ± 0.37b | 6.36 ± 0.4a |
| Threonine | 5.63 ± 0.64a | 6.08 ± 0.2a | 5.71 ± 0.26a | 5.91 ± 0.29a | 5.08 ± 0.13b | 5.16 ± 0.23b |
| Tyrosine | 4.3 ± 0.32b | 5.56 ± 0.45a | 4.13 ± 0.28b | 3.52 ± 0.29b | 4.27 ± 0.4a | 3.8 ± 0.13ab |
| Valine | 5.45 ± 0.33a | 1.83 ± 0.17b | 1.63 ± 0.22b | 4.05 ± 0.16b | 6.04 ± 0.17a | 1.87 ± 0.09c |
| ΣEAA | 46.2 ± 0.68a | 41.9 ± 0.08b | 42.6 ± 0.16b | 39.6 ± 0.41b | 41 ± 0.2a | 40.4 ± 0.09a |
| Alanine | 8.3 ± 0.51a | 8.93 ± 0.13a | 8.16 ± 0.22a | 10.2 ± 0.29b | 12.1 ± 0.29a | 11.8 ± 0.3a |
| Arginine | 6.22 ± 0.18a | 3.86 ± 0.19b | 3.96 ± 0.21b | 6.35 ± 0.14a | 5.53 ± 0.15b | 5.11 ± 0.12c |
| Aspartic acid | 10.8 ± 0.21b | 14.5 ± 0.57a | 14.2 ± 0.34a | 12.3 ± 0.3a | 12.7 ± 0.53a | 13.1 ± 0.21a |
| Glutamic acid | 11.1 ± 0.19b | 14.4 ± 0.64a | 14 ± 0.29a | 13.5 ± 0.26a | 13 ± 0.28a | 13.3 ± 0.16a |
| Glycine | 6.9 ± 0.55a | 6.5 ± 0.33a | 6.54 ± 0.21a | 7.49 ± 0.29a | 6.8 ± 0.22b | 6.98 ± 0.14ab |
| Cysteine | 0.47 ± 0.2a | 0.46 ± 0.12a | 0.64 ± 0.12a | 0.03 ± 0.03b | 0.37 ± 0.12ab | 0.44 ± 0.23a |
| Serine | 6.32 ± 0.22a | 5.87 ± 0.11a | 6.14 ± 0.2a | 5.48 ± 0.28a | 4.58 ± 0.49b | 4.76 ± 0.09ab |
| Proline | 3.66 ± 0.19a | 3.59 ± 0.12a | 3.69 ± 0.08a | 4.98 ± 0.34a | 3.91 ± 0.17b | 4.09 ± 0.31b |
| ΣNEAA | 53.8 ± 0.68b | 58.1 ± 0.08a | 57.4 ± 0.16a | 60.4 ± 0.41a | 59 ± 0.2b | 59.6 ± 0.09b |
- Note: Values with the different letters within each series indicate significant differences (p < 0.05) among the treatments. Values are mean ± SD.
- Abbreviations: EAA, essential amino acid; NEAA, nonessential amino acid.
3.6. Approximate Cost of Each Medium
The cost of the relevant medium is displayed in Table 5. The cost of each medium was determined by calculating the price of chemicals required to prepare the relevant medium. Compared to other treatments, a notably higher cost was needed for the preparation of the C. Preparation of T3 medium cost nothing as it was consisted of only cow dung which was collected from cattle farm of Chattogram Veterinary and Animal Sciences University with free of cost.
| Treatment | Cost (BDT/L) | Cost (USD/L) | Cost (Euro/L) |
|---|---|---|---|
| C | 618.14 | 5.16 | 4.78 |
| T1 | 309.07 | 2.58 | 2.39 |
| T2 | 154.53 | 1.29 | 1.19 |
| T3 | 0.00 | 0.00 | 0.00 |
4. Discussion
Growth differences among media are most likely caused by apparent differences in the media’s composition [27]. Iba [28] stated that the growth and nutrient composition of C. vulgaris can be influenced by the nutrients in culture medium as well as environmental elements like temperature, salinity, and light intensity. The present study showed that the growth of Chlorella sp. had higher cell density in C (100% conway medium) than any other treatments of cow dung medium. The abundance of Chlorella sp. in cow dung medium was significantly (p < 0.05) higher in comparison to commercial BBM [29]. The disagreement between the findings of the two studies could be caused by different strains of Chlorella sp. and variations in growth medium. In case of Gonyostomum sp., the outcomes exhibited highest growth in terms of cell density in T1 than C. The effect might have occurred owing to the addition of commercial medium with cow dung medium, which resulted in an increase in cell density. While conway medium primarily provides well-defined concentrations of nitrate, phosphate, trace metals, and vitamins essential for algal growth, cow dung extract adds organic nitrogen sources, humic substances, and carbon-rich compounds [30]. This hybrid composition may have created a more favorable environment for Gonyostomum sp., which can utilize both inorganic and organic forms of nutrients. However, the growth of Gonyostomum sp. in terms of cell density in only conway medium is different from the results of [14], where similar growth medium was used and the cell density at stationary phase was very high from the results of this study. Variations in the strain and environmental conditions can all affect how the microalgae grow.
Biomass content, the type of species cultivated, and the medium utilized have a significant impact on the amount of carotenoids in microalgae [31, 32]. In this study, significant variation was not observed in the carotenoid content of Chlorella sp. among all treatments. Content of carotenoid in all treatments aligns with the result by Islam et al. [33] where Chlorella sp. had 0.56 ± 0.03 µg/mL of carotenoid cultured in conway medium. Singh et al. [34] observed that the total carotenoid content of Chlorella vulgaris in urban waste water (UWW) was 4.7 mg/L which is higher than the present study. This variation could have resulted from a variety of factors, including the kind of microalgae utilized in the purification process, cultivation conditions, and variation in the nutrient content of wastewater. T1 and T2 treatments of Gonyostomum sp. showed significantly lower carotenoid compound in comparison to C. Dey et al. [14] reported that Gonyostomum sp. had a higher (p < 0.05) carotenoid content (2.48 ± 0.05 µg/mL), which is in line with the current study’s treatment C result.
The results for Chlorella sp. showed that treatment C had the highest total phycobiliprotein content (mg/g) compared to the other treatments of growth medium. APC and total phycobiliprotein contents were lowest in the T2 treatment for Chlorella sp. while Gonyostomum sp. cultured in T2 treatment yielded higher levels of APC content at a lower cost. Higher amount of PC and PE contents in T1 treatment of Chlorella sp. can be applied as dietary supplements, organic colorants in foods and cosmetics due to their strong colors, fluorescent features, and possible health impacts [35].
Chlorella sp. had a higher protein content in C in which 100% commercial (conway) medium was used. The concentrations of total protein, lipid, and carbohydrates (% DW) for Chlorella sp. in this treatment were found to be identical to the previous study, where it was cultured in a similar medium [33]. Total lipid contents of Chlorella sp. grown in T1 and T2 treatments, which ranged from 25% to 33% of dry weight are consistent with the results of the prior study by Kobayashi et al. [36], where three Chlorella strains were grown in 10% anaerobic digester effluent (ADE) cattle manure conditions. According to Singh [37], the protein of Spirulina platensis biomass obtained in 20% formulated cow dung ash medium was lower than C. Similarly, in this study, in case of Gonyostomum sp., significantly (p < 0.05) higher amounts of protein content were observed in C followed by other treatments. The difference in protein content among the treatments might be due to the difference in their nitrogen composition. The current study’s findings revealed that, for both of the microalgal strains, the T1 and T2 treatments had a significantly higher carbohydrate content than the C treatment. As cow dung is mainly composed of digested grass which is high in carbohydrate content, this could raise the overall carbohydrate content of microalgal strains grown in cow dung medium in addition to commercial medium. Algal carbohydrates have certain health advantages and are a good source of dietary fiber [38].
The fatty acid profile of Chlorella sp. in C was identical to the result of [39], in which similar growth medium was used as a control for the culture of Chlorellla vulgaris. The amount of C16:0 (palmitic acid) in the T1 treatment of Chlorella sp. found in this study is supported by Lam and Lee [40]’s study, where Chlorella sp. was cultured with organic fertilizer. In terms of quality, C16:0 and C18:1 fatty acids are the most frequently used fatty acids for biodiesel production [41]. These fatty acids were found to be significantly higher in the T2 treatment. In treatment C, Gonyostomum sp. grown in 100% conway medium exhibited a fatty acid content comparable to earlier findings [14]. Both of the species had higher SAFA and MUFA content in the T1 and T2 treatments compared to the C. According to Demirbas [42], the primary components of biodiesel are SAFA and MUFA, as PUFA reduces the ultimate stability of the fuel. However, the technology used to produce biodiesel and the quality of the final product are significantly impacted by the lipid composition [43].
Percentages of essential amino acids including lysine, phenylalanine, and tyrosine and nonessential amino acids including aspartic acid, glutamic acid, and serine in C of Chlorella sp. align with the findings of Borges-Campos et al. [44]. In Gonyostomum sp., similar amino acid spectra in C were reported in the literature [14]. Abundance in essential amino acids including histidine, isoleucine, leucine, lysine, methionine, phenylalanine, threonine, tyrosine, and valine in T1 and T2 treatments compared to the C makes them potential growth medium for Gonyostomum sp. In each treatment of both microalgae, nonessential amino acids were found to be greater in quantity as opposed to the essential ones. Methionine and cysteine, two amino acids that contain sulfur, are found to be lower in quantities in the current study as microalgae usually possess lower sulfur concentrations [45]. Two crucial elements that significantly affect the amino acid composition of algal biomass are the cultivation technique and the growth conditions [46]. The culture technique modified nutrient availability by replacing inorganic conway with organic-rich cow dung medium. This shift enhanced essential amino acid synthesis in Gonyostomum sp., while Chlorella sp. responded better to the defined nutrients in conway.
Organic medium, cow dung from the Chattogram Veterinary and Animal Sciences University farm, was collected at zero cost. All necessary chemicals were ordered in order to prepare commercial conway, which was then prepared in the lab in accordance with standard procedure. The cost was substantially higher when 100% commercial medium was used for C. In treatment T1 and T2, it was subtracted to 50% and 75% of the total cost, respectively. Since T3 treatment had only cowdung medium, it cost 0 BDT per liter. In this study, cow dung, as a nutrient-rich biological waste, can be repurposed to cultivate microalgae, promoting sustainable resource use and waste reduction. Likewise, the application of livestock waste compost for microalgae cultivation presents a sustainable approach for managing livestock waste and recycling bioproducts, consequently promoting sustainable industrial growth [47].
The present study demonstrated that cow dung-based medium (T1 and T2) supported comparable or even superior growth and biochemical accumulation in Chlorella sp., and Gonyostomum sp. when compared to the standard conway medium. This can be attributed to the presence of essential nutrients such as nitrogen, phosphorus, trace metals, and organic carbon in the cow dung extract. These nutrients are vital for cellular metabolism, protein synthesis, and lipid accumulation in microalgae [48]. Moreover, the presence of growth-promoting substances such as humic acids and volatile fatty acids in cow dung could have enhanced biomass production and pigment synthesis [49]. These findings suggest that cow dung medium not only offers a cost-effective alternative but also a nutritionally supportive environment for sustainable microalgal cultivation.
5. Conclusion
The thorough findings give new insight into the culture of Chlorella sp., and Gonyostomum sp. in different treatments of conway and cost-effective cow dung medium. Gonyostomum sp. exhibited the most significant growth in terms of cell density in the T1 treatment, which consisted of a mixture of 50% commercial and 50% cow dung medium. The total lipid and carbohydrate contents of the two species were found to be higher in either T1 or T2 treatment, which indicates that these species would make excellent feedstock for the synthesis of biofuels. Elevated lipid content in T2 of Chlorella sp. underscores its suitability for broodfish diets while enhancing growth, boosting immune responses, and improving reproductive outcomes in fish. Overall pigment contents were also found in good quantity in both microalgal species cultured at different concentrations of cow dung medium. Both marine microalgal strains in T1 and T2 treatments had high SAFA and MUFA contents, despite the fact that PUFA contents were higher in the commercial medium. Higher amounts of essential amino acids in cost-effective treatments of Gonyostomum sp. can serve as a good dietary supplementation source for both human and aquaculture industry. Overall, T1 or T2 treatments demonstrate the potential of cow dung-based medium as cost-effective alternatives for microalgae cultivation while maintaining desirable nutritional and biochemical profiles suitable for aquaculture applications. Thus, there is a great deal of potential for producing high-quality microalgal species using modified cow dung medium.
Conflicts of Interest
The authors declare no conflicts of interest.
Author Contributions
Trina Das contributed to conceptualization, data curation, data processing, formal analysis, writing of the original draft, validation, revising, editing, methodology, and investigation. Sifatun Nur and Subeda Newase contributed to writing of the original draft, validation, revising, and editing. Mahima Ranjan Acharjee and Mohammad Ekramul Haque took care of formal analysis, writing of the original draft, data processing, revising, and data curation. Sadia Afrin contributed to validation, revising, and editing. Tashrif Mahmud Minhaz took care of validation, writing – review and editing. Helena Khatoon contributed to conceptualization, funding acquisition, supervision, resources, validation, writing – review and editing.
Funding
This study was funded by the Krishi Gobeshona Foundation (Project ID: TF 100-F/21). In addition, this research was also partially funded by the Ministry of Science and Technology, fellowship for MS in 2023–24, Bangladesh, through the National Science and Technology fellowship and Chattogram Veterinary and Animal Sciences University grants through University Grant Commission.
Acknowledgments
This study was funded by the Krishi Gobeshona Foundation Project ID: TF 100-F/21 and Chattogram Veterinary and Animal Sciences University grants through University Grant Commission.
Open Research
Data Availability Statement
The information of this research is available from the corresponding author upon reasonable request.


