Gilthead Seabream Larvae Growth and Survival Using New Co-Feeding Regimes With Early Microdiet Application
Abstract
To be economically viable and improve welfare, innovative feeding regimes are imperative for achieving high growth and survival rates in gilthead seabream larval production. In a gilthead seabream (Sparus aurata) larvae trial, we compared four novel feeding regimes to the standard diet (Std-Art), which included consecutive feeding of Brachionus plicatilis (Rot) and Artemia salina (Art) from 4 days post-hatching (dph) until weaning at 32 dph, followed by microdiet (MD) until 56 dph. All newly formulated feeding regimes included MD mostly from first-feeding, with variations in live feeds provided. The first regime included initial consecutive feeding of Acartia tonsa nauplii (Cop) and then Artemia until weaning at 26 dph (MDe-Cop-Art). The second regime involved rotifer feeding until 20 dph (MDe-Rot), while the third provided A. tonsa until 20 dph (MDe-Cop). The fourth regime featured consecutive feeding of two copepods species, the regularly used A. tonsa and a newly tested tropical species, Apocyclops panamensis (from nauplii to copepodite) until 20 dph, introducing MD at 18 dph (MDa-2Cop). The MDe-Cop-Art regime substantially outperformed all other regimes in survival rate (37.5% ± 2.7% vs. 21.1% ± 2.7% of Std-Art) and total biomass production per tank (69 ± 7 g vs. 16 ± 7 g of Std-Art). This highlights the advantage of feeding copepods over rotifers and emphasises the importance of a short Artemia inclusion, potentially improving feeding activity, digestion and assimilation. Co-feeding live feed with MD from first-feeding was found to enhance growth and survival, indicating the progressive adaptation of larvae to the physical and biochemical characteristics of the MD. This adaptation likely promoted earlier maturation of the digestive system and improved nutrient uptake and utilisation. Considering the overall growth and survival performance, the incorporation of MD from first-feeding, coupled with A. tonsa and followed by a short Artemia feeding is highly recommended for gilthead seabream larvae commercial rearing.
1. Introduction
The gilthead seabream (Sparus aurata), known for its significant economic value in the aquaculture sector, boasts an annual production estimate of 258,754 T/year [1] and holds a prominent position in the Mediterranean region alongside the European seabass (Dicentrarchus labrax) [2–5]. As an altricial species, it faces high mortality during the early developmental stages, prior to the complete maturation and development of the digestive system. This developmental phase necessitates precise nutrition to prevent malnutrition or even starvation, which the larvae face during their transition to exogenous feeding [6, 7]. During these early stages, the larvae experience a phase of substantial growth, characterised by rapid growth rates and distinct metamorphic stages, with changing nutritional requirements crucial for their survival [8–10]. Furthermore, due to limited digestive capacities during this critical period, newly hatched larvae are confined to specific feed types, primarily relying on live feed such as rotifers (Brachionus spp.) and Artemia, known for their high acceptability and palatability. Since the 1970s, the use of rotifers as initial feed has remained a standard practice in the intensive rearing of gilthead seabream, followed by an extended Artemia nauplii/metanauplii feeding phase (20–45 days post-hatching [dph]), due to their ability to be cultured in large quantities at high densities [11, 12]. However, feeding rotifers and Artemia nauplii is not only financially demanding due to production costs but also requires enrichment procedures, such as with fatty acids, in order to compensate for the nutritional deficiencies [12–14]. Moreover, feeding regimes reliant on rotifers and Artemia often yield largely variable results due to seasonal and regional variations in availability, making them less than ideal for consistent larval nutrition [15, 16]. Inadequate nutritional diet composition during the early developmental phase can have adverse effects on larval welfare, impacting growth, survival, swimming ability, and potentially give rise to even more serious outcomes such as interfering with larval metabolism or skeletal and organ deformities [17, 18].
Copepod nauplii, on the other hand, offer superior nutritional benefits as they can naturally endogenously synthesise omega-3 essential fatty acids, especially the important highly unsaturated fatty acids (HUFAs) such as eicosapentaenoic acid (EPA) and docosahexaenoic acid (DHA), without the need for artificial EPA/DHA enrichment [17, 19–21]. Furthermore, copepods offer optimal DHA to EPA and EPA to arachidonic acid (ARA) ratios crucial for the successful development and rearing of many marine fish larvae species. Additionally, certain copepod species further contribute to the coverage of other essential micronutrients [8, 14, 22–26] such as amino acids (e.g., taurine), vitamins (e.g., C and E) and minerals (e.g., zinc). Nevertheless, despite their advantages, their large-scale production remains a challenge in the quantities required for commercial use, but also in attaining cost-effectiveness [12, 14].
As the gastric digestive enzymes and stomach develop, live feeds are gradually replaced by MD (weaning), a critical period which is species dependent in terms of the point in time when the weaning starts and often imposes considerable stress on fish larvae until the weaning phase [10, 27]. To optimise larval production, a comprehensive understanding of the physiological digestive processes within larvae is essential for determining age-specific nutrient requirements and appropriate dietary source administration. However, persisting limitations exist, as there are currently no available microdiets (MDs) capable of entirely replacing live feeds in the early stages without adverse effects [14, 27] for example, in the survival rate. Consequently, the widely adapted feeding practice in commercial hatcheries for numerous marine species remains the introduction of MD only after a prolonged feeding period with a live feed, commonly Artemia.
This study investigated new co-feeding regimes to simultaneously enhance growth performances, survival rates, and growth uniformity of gilthead seabream. Specifically, the following feeding regimes were applied and evaluated: (i) the impact of co-feeding MD and live feed from first-feeding, (ii) the use of copepods versus rotifers as initial live feed, (iii) the need of a conventional Artemia feeding phase and the effect of reducing its duration, (iv) evaluating the sequential feeding of two copepod species with increasing biomass from nauplii to copepodite, and (v) the impact of early weaning on all performance aspects.
2. Materials and Methods
2.1. Rearing of Gilthead Seabream Larvae
To evaluate how different combinations of live feeds, as well as co-feeding with MD, affect the growth performance and survival of gilthead seabream larvae, larvae were reared from 4 dph until 56 dph. Newly hatched yolk-sac gilthead seabream larvae (Sparus aurata; n = 150,000) were transported from the hatchery France Turbot Ichtus, France, in oxygenated cubitainers (n = 2; 20 kg) and secured in Styrofoam boxes containing approximately 82,000 larvae. Rearing of the fish larvae was carried out at the Fraunhofer Research Institution for Individualized and Cell-Based Medical Engineering (IMTE), Aquaculture and Aquatic Resources, Büsum, Germany, under consideration of the German animal welfare standards and approved by the German animal welfare association under the reference number: V 244-68534/2021.
Immediately upon arrival at the Fraunhofer-IMTE, larvae were allowed to adjust to the local conditions before they were equally distributed among the larval rearing tanks at a density of approximately 75 larvae per litre. Yolk-sac gilthead seabream larvae were kept in darkness until 4 dph, when pigmentation of the eyes occurred, enabling them to detect and digest food.
The rearing facility at the Fraunhofer-IMTE is equipped with 24 conical tanks (~60 L volume/each tank), which are embedded in two six m3 holding tanks, designed in such a way that the water circulates from the holding tank through the larval rearing tanks. Water quality conditions were kept in optimal ranges within the two holding tanks, which were identical in design but had separate water recirculation systems, U.V. (Helix Max UV 55 W, Aqua Medic), filtration system through 50–100 µm cartridges (Polystar-Langzeit-Filterkerze 50 and 100 µm, SPECK Pumpen GmbH), protein skimmer (EVO 3000, Aqua Medic) and a temperature control (Titan 6000 Professional [5 kW], Aqua Medic). Water quality parameters were measured daily and maintained as follows (mean ± standard error of the mean [SEM]): oxygen 8.2 ± 0.08 mg/L (Handy Polaris, OxyGuard A/S), pH 8.02 ± 0.02 (GMH 3530, Greisinger electronic GmbH), ammonium (NH4): <0.8 (Methode 8155, HACH), and nitrogen dioxide (NO2): <1.0 (HC87708, Merck KGaA). A continuous water flow was maintained until the end of rearing, with an initial exchange rate of approximately 14%/h up to 100%/h in each rearing tank. Salinity decreased with duration of the rearing trial from 34 ± 0.0 to 27 ± 0.0 g L−1. Water temperature and salinity were initially adjusted to the hatchery’s recommendation at 17°C and 34 ± 0.0 g L−1, respectively. The temperature was gradually increased to 20°C during the first 8 dph to adjust the rearing conditions for the growing larvae to the natural living conditions. Artificial lighting duration was set to 16 h of light and 8 h of darkness, with lights on between 9 am and 1 am and a 30 min simulated dawn and dusk period. From 4 dph, first-feeding commenced with an originally stronger light intensity of 600 lux until the end of the rotifer/copepod feeding phase at 20 dph, where the illumination was changed to 300 lux. During this period, the “greenwater technique” was applied, which means each tank received microalgae Nannochloropsis sp. concentrate (12 × 109 cells per mL, BlueBioTech, Germany) pre-mixed with seawater three times a day at 9 am, 3 pm and 6 pm.
2.2. Feeding Trial
2.2.1. Feeding Regimes
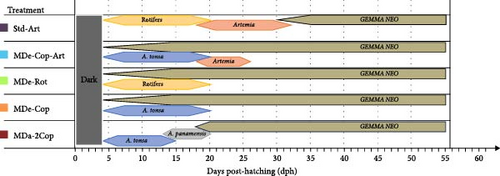
Five different feeding regimes were tested in quadruplicates and randomly assigned to four different rearing tanks, each stocked with 4500 gilthead seabream larvae (density of 75 larvae per litre). The standard treatment used in this study reflects the feeding regime commonly practised in gilthead seabream larviculture and referred to as standard treatment/diet or Std-Art (Figure 1). It comprised the following feeding schedule: rotifers were provided from 4 up to 20 dph, and Artemia (newly-hatched nauplii followed by metanauplii) from 18 up until 32 dph. The commercial microparticulate dry feed (GEMMA Neo, Skretting; Table 1) was introduced at 30 up until 56 dph, with a weaning period of 3 days (30–32 dph), in which the amount of Artemia was gradually reduced while MD was increased. The first innovative feeding regime, referred to as MDe-Cop-Art, included MD from 4 to 56 dph, supplemented with additional feeding of copepods (Acartia tonsa nauplii) from 4 to 20 dph, Artemia nauplii from 18 to 23 dph, and enriched Artemia from 21 up until 26 dph. This feeding regime investigated the effect of co-feeding MD with copepods from first-feeding, while also examining the influence of reducing the duration of the Artemia feeding phase. The second new feeding regime, MDe-Rot, investigated MD throughout the entire trial period, supplemented with rotifers from 4 to 20 dph. The third feeding regime, MDe-Cop, also evaluated MD throughout the entire trial period, alternatively providing copepods (A. tonsa nauplii) from 4 to 20 dph. The fourth feeding regime, MDa-2Cop, introduced MD on 18 dph and investigated the sequential feeding of two copepod species, A. tonsa (from 4 to 15 dph) and Apocyclops panamensis (from 13 up until 20 dph), covering nauplii to copepodite stages. All newly formulated feeding regimes evaluated the impact of early weaning on all growth performances, survival rates and growth uniformity.
| GEMMA Neo 0.0 | GEMMA Neo 0.1 | GEMMA Neo 0.2 | GEMMA Neo 0.3 | Unit | |
|---|---|---|---|---|---|
|
|
|
|
|
μm |
| Ingredients based on manufactures description | |||||
| Proteins | 60 | 60 | 60 | 60 | % |
| Fat | 11 | 11 | 11 | 11 | % |
| Ash | 12.5 | 12.5 | 12.5 | 12.5 | % |
| Fibre | 0.2 | 0.2 | 0.2 | 0.2 | % |
| Phosphorus | 1.8 | 1.8 | 1.8 | 1.8 | % |
| Calcium | 1.7 | 1.7 | 1.7 | 1.7 | % |
| Sodium | 0.7 | 0.7 | 0.7 | 0.7 | % |
| Vitamin A | 23,000 | 23,000 | 23,000 | 23,000 | IU/kg |
| Vitamin D | 2000 | 2000 | 2000 | 2000 | IU/kg |
| Iron | 250 | 250 | 250 | 250 | mg/kg |
| Iodine | 5 | 5 | 5 | 5 | mg/kg |
| Copper | 13 | 13 | 13 | 13 | mg/kg |
| Manganese | 42 | 42 | 42 | 42 | mg/kg |
| Zinc | 150 | 150 | 150 | 150 | mg/kg |
| Astaxanthin | 100 | 100 | 100 | 100 | mg/kg |
| Analysed composition of the microdiet | |||||
| Dry matter | 93.4 | 92.7 | 94.6 | 95.2 | % |
| Crude protein | 69.1 | 68.9 | 67.6 | 68.3 | % |
| Crude lipid | 9.6 | 9.3 | 11.1 | 11.5 | % |
| Crude ash | 11.2 | 10.5 | 10.3 | 10.2 | % |
| Gross energy | 22.3 | 22.7 | 22.9 | 22.8 | MJ/kg |
- Note: Macronutrient analysis was performed in duplicate at the Fraunhofer IMTE prior to the beginning of the experimental trial. Chemical components are presented in percent dry weight and gross energy in megajoule per kilogram.
2.2.2. MD Application
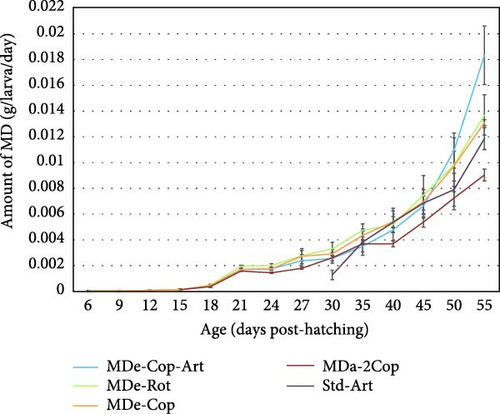
MD was administered using an automatic dispenser system (HFS-F Feeder & HFS-P Control, NutraKol, Australia), ensuring precise and controlled feeding events. A macronutrient analysis of the different sizes of GEMMA Neo used was performed at the Fraunhofer IMTE prior to the start of the experimental trial. Duplicate measurements were taken for dry matter, crude protein, crude lipid, crude ash, and gross energy (Table 1). To meet the changing nutritional requirements of the larvae during growth and development, the amount of MD administered was adjusted based on larval age and density within each rearing tank. Feeding frequency, shots per feeding event and MD particle size itself were gradually increased with advancing age of the larvae as presented in Figure 2.
2.2.3. Live Feed Production and Procedures
Live feed (rotifers, Artemia, and copepods) were given at an hourly rate through the means of reefdoser (reefdoser EVO 4, Aqua Medic), ensuring a constant supply was available to the larvae. The density of live feed within each treatment tank was monitored in the morning and afternoon, taking triplicate 1 mL water samples, collected immediately after feeding and 30 min later. These samples, along with larvae, were examined under a microscope to confirm food consumption. Feeding density of the different types of live feed was adjusted based on their biomass, larval age, larval density, and during co-feeding stages (transitioning from one feed to the next).
Rotifers (Brachionus plicatilis, L-type; Planktovie, France) were raised in 90 L tanks and daily fed with concentrated Nannochloropsis sp (BlueBioTech, Germany) based on density per mL.
Artemia (Artemia cysts; Ocean Nutrition) were incubated in two different sizes, AF 430, 300,000 nauplii per gram (NPG) initially given, followed by 250,000 NPG. Both rotifers and Artemia metanauplii were enriched with S.presso (INVE) prior to each daily feed, where the amount of enrichment used was adapted to the number per mL harvested. The required daily amount was harvested in the morning after an enrichment period with S.presso of approximately 12 h at 25°C under strong aeration.
Copepods A. tonsa (C-Feed AS, Norway) were prepared 1 day prior to feeding, in cylindric-conical fibreglass tanks with a holding capacity of 300 L. These tanks were pre-heated in advance to 26°C, and A. tonsa eggs were washed and added to hatch over a period of 24 h under strong aeration. Prior to harvesting, aeration was stopped for approximately 10 min to allow empty eggshells and debris to settle, which were then drained and discarded. The daily harvested A. tonsa nauplii were washed and given a dose of Rhodomonas baltica and Isochrysis galbana at a 1:2 ratio (BlueBioTech, Germany) and then stored on ice until feeding.
Copepods A. panamensis (Aquacopa GmbH, Germany) were raised approximately 2 months prior to the larviculture in other cylindric-conical tanks with a holding capacity of 150 L at 24–26°C. A daily feeding programme supplied Tetraselmis chui concentrate and Isochrysis galbana at a 3:1 ratio (BlueBioTech, Germany), based on density per mL. A 200 µm mesh sieve was used to concentrate, harvest and filter different instars of A. panamensis from 13 to 20 dph.
2.3. Sampling
Fifteen gilthead seabream larvae samples were randomly taken from each tank (n = 60 per treatment) every third day until 30 dph; thereafter, larvae samples were collected every 5th day. The first sampling (day 0) was taken prior to the beginning of the feeding trial. All sampled larvae were euthanised on ice and stored in seawater at -80°C until further processing. The growth performance of the larvae was assessed using standard length (SL) and dry weight (DW). SL of each sampled larva was measured to the nearest 0.25 mm using a stereomicroscope (M80 Leica) and individually placed into 1.5 mL Eppendorf tubes. These tubes were freeze-dried (Alpha 1–2 LD plus, Christ), and the DW of each larva was measured to the nearest ± 1 µg (Cubis Ultramicro Balance MSA, Sartorius). Dead larvae were recorded daily from the bottom of the rearing tanks from 4 dph onwards in order to have an estimate of daily mortalities within each tank.
The measurement of SL and DW served as the basis for calculating specific growth rate (SGR; SGRSL and SGRDW, respectively) from 6 to 56 dph, as well as daily growth gain (DGSL and DGDW) and coefficient of variation (CVSL and CVDW). The following formulas were applied:
SGRk = (In (FM)k − In (IM)k) × 100 × t−1, FM: final mean, and IM: initial mean of k; where k is either SL (mm) or DW (mg) and t: days of rearing.
DGk = (FMk − IMk) × t-1; where k is as defined above.
CVk = (100 × standard deviation) × (mean total of k)−1; where k is as defined above.
2.4. Statistical Analyses
All statistical analyses were performed using software R (2025). A value of p < 0.05 was considered statistically significant, and a value of p > 0.05<0.10 was interpreted as a tendency.
At each time point, the effect of treatment on growth performance SL and DW was analysed based on a linear mixed model [28, 29] with treatment, dph and their interaction effect as fixed factors, and replicate (tank) and the interaction of replicate and dph as random factors. The same linear mixed model was used to analyse the survival rate at each dph. The residuals were assumed to be normally distributed and to be heteroscedastic with respect to the different levels of dph. These assumptions are based on a graphical residual analysis. Appropriate multiple contrast tests [30, 31] were applied in order to compare the different feeding regimes against that of the standard diet.
SGR, DG and CV were determined at tank level and then analysed for four different rearing phases, 6–18, 18−30, 30–56 and 6–56 (SGR and daily gain; Supporting Information 1: Table S1 and Table 2) or at the end of the trial 56 dph (CV; Table 2) using a linear model including only treatment as fixed effect. Appropriate multiple contrast tests, as previously described, were applied here.
| Performance | Feeding regime | ||||
|---|---|---|---|---|---|
| Std-Art | MDe-Cop-Art | MDe-Rot | MDe-Cop | MDa-2Cop | |
| Survival (%; 56 dph) | 21.12 ± 2.70 |
|
|
|
|
| DW (mg; 56 dph) | 17.94 ± 1.20 |
|
|
|
|
| SGRDW (% day−1; 6–56 dph) | 12.15 ± 0.21 |
|
|
|
|
| CVDW (%, 56 dph) | 44.39 ± 7.01 |
|
|
|
|
| DGDW (mg day−1; 6–56 dph) | 0.36 ± 0.04 |
|
|
|
|
| SL (mm; 56 dph) | 16.16 ± 0.39 |
|
|
|
|
| SGRSL (% day−1; 6–56 dph) | 3.19 ± 0.07 |
|
|
|
|
| CVSL (%; 56 dph) | 12.86 ± 1.63 |
|
|
|
|
| DGSL (mm day−1; 6–56 dph) | 0.26 ± 0.01 |
|
|
|
|
| WW (mg; 56 dph) | 16235 ± 6770 |
|
|
|
|
| WW per larva (mg; 56 dph) | 131.86 ± 11.54 |
|
|
|
|
- Note: Values are LSMeans ± SEM of quadruplicate tanks per feeding regime (n = 4). The p values are based on the multiple contrast test as deviation from the standard treatment (Std-Art). Survival, percentage of larvae survival from beginning to end of the trial; SGR, specific growth rate of DW and SL; CV; coefficient of variation of DW and SL; DG, daily growth gain of DW and SL; WW, total wet weight per tank or per larvae.
- Abbreviations: DW, dry weight; SL, standard length.
To investigate the regression of performance on survival at the end of the trial (56 dph), the average performance per tank was calculated and used as an observation in a linear model fitting survival per tank nested within treatment. The same data was used to further investigate the correlation between growth performance and survival. Firstly, the phenotypic correlations of the performance and survival were estimated. Secondly, to obtain the correlation independent from the feeding regimes, the residuals were estimated and extracted based on a linear model including treatment as a fixed effect.
3. Results
3.1. Survival of Gilthead Seabream Larvae
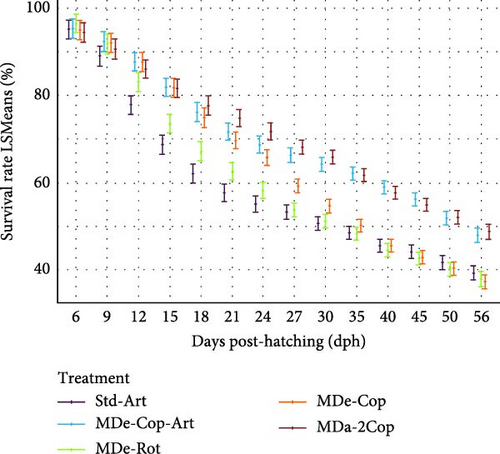
At the end of the trial, feeding regimes given copepod nauplii, A. tonsa, achieved higher survival in comparison to those fed a rotifer diet (standard and MDe-Rot; Table 2). Gilthead seabream larvae that received MD throughout the entire trial, with initial feeding of copepods followed by a 9-day Artemia feeding (MDe-Cop-Art), showed a significantly higher survival of 37.5%, compared to the standard diet (21.1%, p = 0.0017). In contrast, the lowest survival was found for feeding regime MDe-Rot (19.73% ± 2.70%), where larvae received a co-feeding of rotifers and MD from start until weaning at 20 dph. A tendency of higher survival, considering the standard diet as a basis, was observed when two different copepods were fed (MDa-2Cop), which included the newly tested tropical copepod A. panamensis given for 8 days before weaning at 20 dph, post-initial feeding of A. tonsa.
Survival rates, presented as LSMeans, were assessed throughout the rearing phase (4–56 dph) and are shown in Figure 3. At 15 dph, the standard diet showed the lowest survival of all feeding regimes, which were significantly different, with the exception of treatment MDe-Rot. This treatment, with early rotifer and MD feeding, showed a further rapid survival decline post-weaning (20 dph), reaching similarly low levels as the standard diet at 27 dph. In contrast, diets incorporating two species of copepods (MDa-2Cop) or sequential copepod and Artemia feeding (MDe-Cop-Art) exhibited substantially higher survival throughout the entire rearing phase, significantly larger from 15 dph (p = 0.01 for both treatments). Although feeding only one copepod species showed similar significantly higher survival from the standard diet from 15 dph until 27 dph, this MDe-Cop feeding regime experienced a rapid decline in survival thereafter.
3.2. Larval Growth
3.2.1. Rotifer Versus Copepod Feeding Phase (4–18 dph)
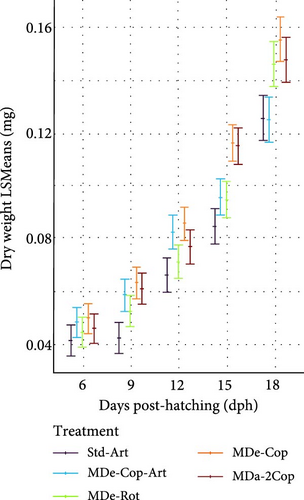
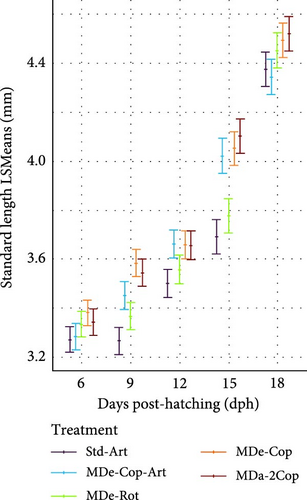
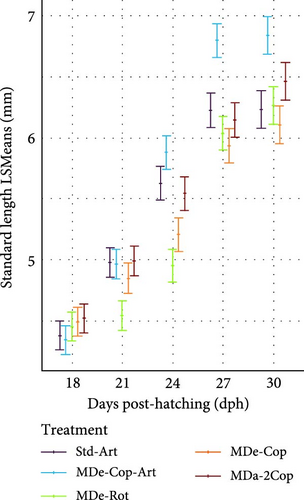
During the early rearing phase, the type of live feed had no significant impact on either DW (Figure 4a) or SL (Figure 4d). However, at 15 dph, feeding regimes with copepods (MDe-Cop-Art, MDe-Cop and MDa-2Cop) showed a trend to higher DW and/or SL compared to the standard diet. Introducing MD at first-feeding resulted in a tendency of both increased DW and SL across all three MD-supplemented treatments compared to the standard treatment. The assessment of SGR for both DW and SL, alongside their respective daily gain (DGDW and DGSL) from 4 to 18 dph, revealed non-significant differences between treatments.
3.2.2. Feeding Phase With Artemia (Std-Art and MDe-Cop-Art) or Without (MDe-Cop, MDe-Rot and MDa-2Cop)
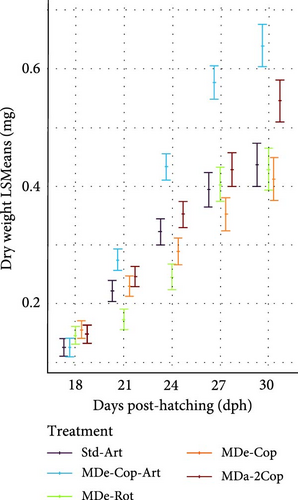
The adaptation to Artemia within two of the five feeding regimes (standard and MDe-Cop-Art) led to comparably lower SL and DW values at 18 dph, while the other feeding regimes displayed higher values, albeit non-significant, at this stage. Thereafter, as a result of offering Artemia, a rapid exponential DGDW (42.86 ± 2.73 µg day−1, p < 0.01; Supporting Information 1: Table S1) was observed for larvae from treatment MDe-Cop-Art (Figure 4b), in contrast with the delayed effect seen in the standard treatment (35 dph onwards). This rapid weight gain was paralleled by accelerated length growth (Figure 4e), with also significantly higher DGSL and SGRSL observed in larvae from the MDe-Cop-Art treatment during the 18–30 dph feeding phase (0.21 ± 0.01 mm day−1; p = 0.012and 3.78% ± 0.19% day−1; p = 0.022, respectively, Supporting Information 1: Table S1).
The substantial impact of incorporating an Artemia feeding phase following a copepod feeding phase was further highlighted when compared to the feeding regime excluding Artemia (MDe-Cop). At 30 dph, this treatment displayed slightly lower DW and SL than the standard treatment. Interestingly, the larvae from MDe-Rot showed slightly higher DW and SL than the standard treatment at 18 dph. However, this advantage diminished over time, with larvae from the MDe-Rot treatment showing significantly lower SL by 24 dph (SL p = 0.044; Supporting Information 1: Table S2). Notably, despite both the MDe-Rot and MDe-Cop treatments being weaned at 20 dph, the rotifer treatment displayed sigmoidal growth during this feeding phase (18–30 dph), whereas the copepod treatment exhibited linear growth.
3.2.3. MD Feeding Phase (33–56 dph)
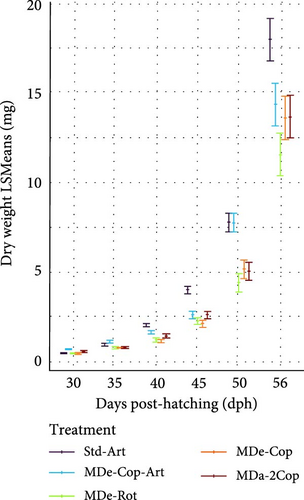
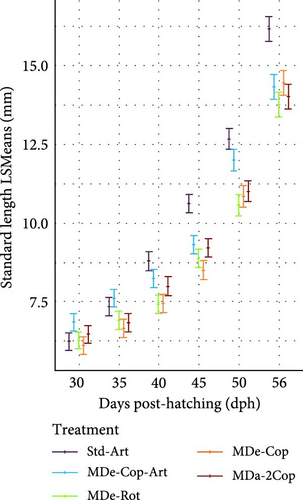
From 33 dph onwards, live feed was withdrawn in all groups, and all feeding regimes exclusively supplied the same MD diet, resulting in an expressed exponential increase in growth. Interestingly, the significant advantage observed in larvae from the MDe-Cop-Art feeding regime at 30 dph against the standard diet diminished at 40 dph for DW and 50 dph for SL (Figure 4c,f, respectively). At the latter time point, the standard diet became significantly distinct from the other feeding regimes, exhibiting a rapid increase in both DGDW and SGRDW (1.46 ± 0.15 mg day−1, 30.93% ± 1.39% day−1; Supporting Information 1: Table S1) and DGSL and SGRSL (0.83 ± 0.04 mg day−1, 7.95% ± 0.36% day−1; Supporting Information 1: Table S1).
At the end of the trial, the standard diet resulted generally in significantly longer larvae (16.16 mm) compared to the other feeding regimes, with similar rankings based on DW (17.94 mg). Furthermore, the variations in SL within feeding regimes MDe-Cop-Art, MDe-Rot and MDa-2Cop were significantly lower than the standard diet, except for MDe-Cop, which showed only a tendency toward a significantly lower length (14.43 mm, p > 0.05).
3.2.4. Entire Rearing Phase (6–56 dph)
The growth patterns of the experimental treatments showed distinct differences in SGR and DG for both DW and SL from 6 to 56 dph (Supporting Information 1: Figure S1). The standard treatment exhibited the highest SGRDW and SGRSL, as well as the highest DGDW and DGSL (Table 2). Conversely, the larvae from treatment MDe-Rot displayed the lowest SGRDW and SGRSL, along with the lowest DGDW and DGSL. Larvae from treatment MDe-Cop-Art showed SGR values for both DW and SL that were only marginally different and not significantly different in comparison to the standard treatment. The only significant difference observed within the MDe-Cop-Art treatment was a lower DGSL (0.22 mm day−1, p < 0.05) in comparison to the standard treatment. Furthermore, while all other experimental treatments exhibited higher variations in DW and SL, these differences were found to be non-significant when compared to the standard treatment.
3.3. Correlations Among Performances
The phenotypic and residual correlations among important performances of survival, growth and uniformity of growth of gilthead seabream are presented in Table 3. Thereby, the phenotypic correlation is partly affected by different effects of the feeding regimes (treatments) on the associations between performances, whereas the residual correlation reflects the natural association between performances, independent of the feeding regimes. In particular, the correlations between survival and average growth performance of larvae differed between phenotypic and residual correlations. This indicates that the various feeding regimes affected the association between survival and growth performances differently, thereby increasing the variation around the regression curve and resulting in reduced, mostly non-significant correlations. In contrast, the residual correlations between survival and average growth performance of larvae are adjusted for the effect of various feeding regimes and show substantially more significant correlations. Specifically, all growth performances of larvae consistently revealed significant negative residual correlations (p < 0.05) of moderate magnitude (ranging from −0.51 to −0.68 for DW and SGRSL, respectively) with survival, except for uniformity of growth, which was negatively correlated but non-significantly different from zero. Contrarily, considering the entire biomass produced per tank, an increase in survival resulted in a strong positive correlation with WW per tank of >0.9 (p < 0.05) at both phenotypic and residual levels. The growth performances of DW at 56 dph and over the entire measured growth period from 6 to 56 dph showed a correlation of one, indicating that these performances are measuring the same. The correlations of growth of DW and SL were large (>0.8) both on the phenotypic and residual levels. As for survival, uniformity of growth was not significantly correlated with growth rate performance. Uniformity of growth of DW and SL was largely positively correlated at about 0.85, both at the phenotypic and residual level.
| Performance | Phenotypic correlation coefficients | ||||||||||
|---|---|---|---|---|---|---|---|---|---|---|---|
| Survival (%; 56 dph) | DW (mg; 56 dph) | SGRDW (6–56 dph) | CVDW (%, 56 dph) | DGDW (mg day−1; 6–56 dph | SL (mm; 56 dph) | SGRSL (6–56 dph) | CVSL (%, 56 dph) | DGSL (mm day−1; 6–56 dph) | WW (mg; 56 dph) | WW per larvae (mg; 56 dph) | |
| Survival (%; 56 dph) | — |
|
|
|
|
|
|
|
|
|
|
| DW (mg; 56 dph) |
|
— |
|
|
|
|
|
|
|
|
|
| SGRDW (6–56 dph) |
|
|
— |
|
|
|
|
|
|
|
|
| CVDW (%, 56 dph) |
|
|
|
— |
|
|
|
|
|
|
|
| DGDW (mg day−1; 6–56 dph) |
|
|
|
|
— |
|
|
|
|
|
|
| SL (mm; 56 dph) |
|
|
|
|
|
— |
|
|
|
|
|
| SGRSL (6–56 dph) |
|
|
|
|
|
|
— |
|
|
|
|
| CVSL (%, 56 dph) |
|
|
|
|
|
|
|
— |
|
|
|
| DGSL (mm day−1; 6–56 dph) |
|
|
|
|
|
|
|
|
— |
|
|
| WW (mg; 56 dph) |
|
|
|
|
|
|
|
|
|
— |
|
| WW per larvae (mg; 56 dph) |
|
|
|
|
|
|
|
|
|
|
— |
- Note: Residuals were obtained after adjustment for feeding regime effects. Survival, percentage of larvae survival from beginning to end of the trial; SGR, specific growth rate of DW and SL; CV; coefficient of variation of DW and SL; DG, daily growth gain of DW and SL; WW, total wet weight per tank and per larvae.
- Abbreviations: DW, dry weight; SL, standard length.
3.4. Regression of Growth Performance on Survival
As the correlation analysis between average growth of larvae and survival showed differences between phenotypic and residual correlations, indicating that there are different associations between these performances depending on the feeding regime, a nested regression for each growth performance on survival within treatment was fitted. We found that survival explained the majority of variation in SL performances (SGRSL; 79%, DGSL; 78% and SL; 77%, see Table 4). The standard diet exhibited non-significant regressions between all these SL performances on survival, suggesting that this feeding regime effectively met the nutritional requirements of the surviving larvae. In contrast, the MDe-Cop-Art feeding regime, which showed the highest survival, resulted in significant regressions between SL and DW performances on survival. The majority of growth performances from larvae of feeding regime MDe-Cop-Art displayed substantially lower regression coefficients compared to those from MDe-Rot, MDe-Cop and MDa-2Cop, despite its superior survival. This indicates that even with its higher survival, the MDe-Cop-Art treatment provided a highly nutritional diet that had a relatively modest impact on the relationship between these growth performances and survival. Treatment MDe-Rot exhibited the highest negative regression coefficients between most growth performances and survival. This implies that, despite having the lowest mean survival, this feeding regime resulted in a significant reduction in both SL and DW as survival increased. For instance, the regression coefficient for SGRSL was three times higher than that observed in feeding regime MDe-Cop-Art, suggesting that the feeding regime in MDe-Rot was inadequate in meeting the nutritional requirements for SL and DW as survival increased. Both MDe-Cop and MDa-2Cop treatments showed similar negative regression coefficients for the majority of growth performances on survival, with some of those, such as that for SGRSL, being 2.5 times higher than those of MDe-Cop-Art. This suggests that even in feeding regimes with a low survival rate, there is a substantial negative impact on growth performance with increased survival.
| Performance | Feeding regime | ||||||
|---|---|---|---|---|---|---|---|
| Intercept | Std-Art | MDe-Cop-Art | MDe-Rot | MDe-Cop | MDa-2Cop | R2 | |
| DW (mg; 56 dph) |
|
|
|
|
|
|
|
| SGRDW (6–56 dph) |
|
|
|
|
|
|
|
| CVDW (%, 56 dph) |
|
|
|
|
|
|
|
| DGDW (mg day−1; 6–56 dph) |
|
|
|
|
|
|
|
| SL (mm; 56 dph) |
|
|
|
|
|
|
|
| SGRSL (6–56 dph) |
|
|
|
|
|
|
|
| CVSL (%, 56 dph) |
|
|
|
|
|
|
|
| DGSL (mm day−1; 6–56 dph) |
|
|
|
|
|
|
|
| WW (mg; 56 dph) |
|
|
|
|
|
|
|
| WW per larvae (mg; 56 dph) |
|
|
|
|
|
|
|
- Note: Abbreviations are presented for each of the growth performances in Table 2.
However, if we take the regression coefficient of WW on survival, a substantially higher explained variation of 98% was revealed, with the highest regression coefficient for the feeding regime MDe-Cop-Art in comparison to the standard diet and all other feeding regimes.
4. Discussion
The persisting occurrence of high and fluctuating mortality rates in gilthead seabream larval production in hatcheries, coupled with the complexity of understanding this mortality, remains a formidable challenge for the industry. Suboptimal feeding and/or management procedures in hatcheries result in unpredictable fry production, inflicting significant economic losses. Therefore, there is an increasing demand for adopting a viable feeding regime that consistently provides nutritional requirements in a balanced and stable manner during the first-feeding stages, shifting away from the heavy reliance on live feed and achieving financial benefits through the integration of co-feeding with inert formulated diets to reduce labour costs in hatcheries. Results from the present study indicate that gilthead seabream larvae can successfully adopt a feeding regime where inert feed is introduced from the start of exogenous feeding. In fact, the results suggest that gilthead seabream larvae derive specific benefits, even achieving higher survival rates when simultaneously provided with both live and inert feed from the onset of first-feeding. Furthermore, our findings suggest that supplementing with a short 9-day Artemia period (“Kiss of Artemia”) after a 16-day copepod nauplii diet enhanced these positive effects even more.
Differences in mortality observed within the study were notably influenced by the feeding regime, specifically the type and proportion of live feed and/or MD, along with the timing of weaning. Feeding regimes which incorporated a copepod-based diet as the initial dietary source showed higher survival rates in gilthead seabream larvae compared to those fed rotifers during the early rearing phase. The higher survival along with potentially enhanced growth performance of larvae fed copepods, can be attributed to their superior nutritional profile (Supporting Information 2: Table S3). Copepods are naturally rich in phospholipids, free amino acids and beneficial HUFAs [8, 24, 32, 33], such as DHA, which can make up to 40% of their total fatty acids [34]. Several species exhibiting favourable DHA/EPA ratios close to 2:1, correlated with enhanced larval growth performance and survival [17, 33]. The high content of free amino acids in copepods given during the first-feeding phase has been suggested to enhance protein utilisation [35] and contribute to a better use of the high growth potential of marine fish larvae [14]. Since many marine fish larvae have incompletely developed livers and immature digestive systems during early development, their ability to elongate and desaturate fatty acid precursors into long-chain polyunsaturated fatty acids, particularly DHA and ARA, as well as to synthesise essential nutrients like phospholipids, is limited. The vulnerability of fish larvae at this stage emphasises their heavy reliance on dietary sources of preformed essential fatty acids. Therefore, providing a copepod-based diet, naturally rich in these key nutrients, is the most effective dietary intervention for meeting the nutritional requirements of marine fish larvae [34, 36, 37].
The MDe-Rot feeding regime, differing from the standard treatment only in the additional inclusion of MD during this early feeding phase, showed higher survival rates until weaning (20 dph), most likely due to additional nutrients provided through the MD. This finding and microscopic examination of gilthead seabream larvae samples revealed that larvae accepted MDs as feed and were able to ingest and digest the smaller sizes of the provided MD (GEMMA Neo 0; 10–110 μm and 0.1; 100–250 μm) during this early feeding phase. However, post-weaning (21 dph onwards), survival rate for the MDe-Rot feeding regime declined rapidly, reaching levels similar to that of the standard diet by 27 dph. This increase in mortality indicates that the enriched rotifer component of the feeding regime did not supply sufficient nutrients for appropriate larval development until weaning in order to facilitate a smoother transition to inert feed. On one hand, an extended and gradual weaning period, exceeding the current 3-day duration, may be needed for this feeding regime to promote larval development and thus survivability. On the other hand, it is important to note that extending the rotifer feeding duration may compromise larval growth and performance due to a reduction in net energy intake per prey, contrasting to what gilthead seabream larvae at 20 dph could obtain from an Artemia diet. The aim should be effectively navigating the transition to formulated diets with the help of robust, nutritionally rich and stable feeding regimes to uphold optimal larval growth rates and survival. A suboptimal weaning, lacking a co-feeding period of at least 3–5 days with live prey, is widely recognised for its potential to induce stress, decrease digestive enzyme activity, lead to malnutrition and ultimately reduce survival [38, 39]. Hence, larvae from the MDe-Rot treatment may not have had the necessary physiological and digestive functions for sufficiently digesting the MD due to a lack of essential nutritional factors (e.g., fatty acids, digestive enzymes and some free amino acids) in the enriched rotifer batches. Despite necessary enrichment, rotifers remain inferior to copepods in levels of EPA (unenriched ~5.9% vs. enriched ~6.3%) and particularly DHA (~7.6% vs. ~17.8%), compared to the naturally higher DHA content found is A. tonsa (~22.3%) and A. panamensis (~11%; Supporting Information 2: Table S3). Additionally, rotifers exhibit a lipid profile dominated by neutral lipids, which are less digestible for larvae with immature digestive systems [33]. Rotifers also tend to have unbalanced amino acid profiles, are deficient in histidine, arginine and lysine, crucial sources of energy during metamorphosis in gilthead seabream larvae [13]. Several studies have also shown larval morphological development and growth to be positively affected by the concentration of taurine, which rotifers tend to be deficient in comparison to copepods [8, 22–25]. Traditional enrichment procedures may not achieve required or favourable taurine concentrations in commercial rotifers, due to its water-soluble nature, requiring large quantities for supplementation. Commercial rotifers may also have suboptimal levels of microminerals such as copper, zinc, selenium and manganese, while most macrominerals are present in comparable levels to those in copepods [8, 26, 40]. Most B-vitamins in rotifers cover the requirements of growing larvae, with possible exceptions of vitamin D and K. However, these nutrients can be manipulated to a certain extent in rotifers or supplemented in MD for gilthead seabream larvae. Therefore, choosing copepods over rotifers, given their valuable biochemical composition, seems advisable for the future.
The standard treatment with a relatively long Artemia feeding phase of 15 days appeared to decelerate the decline in survival rate. Prior to this, the standard treatment showed much lower survival rates than all other treatments, with a pronounced decline from 9 to 18 dph (Figure 3). The higher initial daily mortality observed within this treatment may have allowed for less competition among larvae, and thus, resulted in adequate nutritional requirements for both SL and DW growth established during and after the Artemia feeding phase. A similar Artemia effect was observed for treatment MDe-Cop-Art, but at substantially higher survival level, even though Artemia was only supplied for 9 days. This highlights the benefits of a short-term Artemia feeding phase for the development and, consequently, for the survival of gilthead seabream larvae. Although Artemia may not provide the same levels of essential HUFAs like DHA as copepods, its higher total lipid content (~19.7% vs. ~ 9.9%; Supporting Information 2: Table S3) likely contributes to its effectiveness as a readily energy source. In agreement with our findings, Mozanzadeh et al. [41] also emphasised the significance of a 9-day Artemia inclusion (from 12 up until 20 dph) in yellowfin seabream, reporting significantly better growth performance and survival rates compared to an early or sudden weaning strategy. This suggests that a successful weaning strategy for gilthead seabream larvae onto MD would greatly benefit from a short inclusion of Artemia. Moreover, for feeding regime MDe-Cop-Art, the decrease in survival rate slightly curves favourably at weaning, suggesting that an early co-feeding period prepared the gut for accepting and processing MD, allowing earlier weaning and improved larval nutrition. Several studies have reported that incorporating Artemia nauplii into the feeding regime leads to improved growth and survival in gilthead seabream [42, 43] and seabass [44] by boosting the production of bombesin. These are consistent with findings that feeding regimes without the inclusion of an Artemia diet before or during weaning have reported reduced growth and/or survival rates in several sparid larvae species, such as white seabream [45] and red porgy [46] as well as marine species Asian seabass,[47] Senegalese sole [39] and cobia [48].
As crucial as the quality of feed itself is the manner of its administration, striving to achieve the ideal balance between live and MD. Many standard larval rearing protocols for marine species typically start weaning between 30 and 40 dph [49, 50]. However, the success of early weaning strategies is species-specific. Recent studies have focused on determining the optimal weaning time for gilthead seabream, suggesting that weaning can commence around 20 dph [50]. Moreover, given the advancements in more state-of-the-art commercial MDs in terms of different particle sizes and formulations, numerous studies have explored the possibility of an earlier weaning to reduce heavy reliance on live feed. Nonetheless, overcoming the primary challenge for the industry involves delivering MDs that are equivalent or even surpass the growth and survival performances achieved by current feeding regimes reliant on live feed. In the past, early weaning was found to significantly affect the development of digestive enzymes and associated gene expression profiles, which subsequently resulted in poorer growth, survival and quality in terms of higher incidences of skeletal deformities [10, 51]. Recent advancements in MD quality provide greater weaning flexibility, allowing the introduction of specific larval diets to marine finfish species as early as from first-feeding. MDs offer the advantage of efficiently delivering various types of nutrients, including essential fatty acids from alternative sources such as microalgae, which can even be used in replacement of traditional fish oils [52, 53], as well as supplements like prebiotics and probiotics [54]. Furthermore, extended co-feeding periods before weaning can enhance the acceptance of MD, thereby promoting ingestion and potentially accelerating weaning [55].
In the present experiment, the benefits of incorporating MD simultaneously with live feed from first-feeding become apparent when comparing the growth performance of MDe-Cop-Art and/or MDe-Cop with MDa-2Cop, up to 12 dph. During this critical early rearing phase, these feeding regimes provided the same feed (A. tonsa nauplii), with distinction between these treatments being the inclusion (MDe-Cop-Art or MDe-Cop) or exclusion (MDa-2Cop) of MD. However, during the 18–30 dph, the MDa-2Cop regime exhibited the second highest SGR and DG for both growth performances (DW and SL). This performance closely followed that of MDe-Cop-Art but surpassed MDe-Cop, where only A. tonsa nauplii was provided. One potential explanation is associated with an increased prey biomass due to the different instars of A. panamensis copepod fed as larvae grew, offering energetic advantages during the period from 13 dph up until 20 dph. Additionally, the larger copepodite stages not only supplied more energy per individual but also featured a decreased surface-to-volume ratio, resulting in relatively less indigestible chitinous exoskeleton [56]. An interesting observation was the effective maintenance of tank hygiene by this copepod species, as the more advanced copepodite stages were observed to actively feed on settled MD from the tank floor. Consequently, this inadvertent behaviour potentially augmented their nutritional value and energy content by utilising surplus MD remnants. The varying sizes of copepod stages and their associated biomass could potentially explain the greater size dispersion in larvae DW for this feeding regime at the end of the trial. Notably, the MDa-2Cop regime was the only treatment in which a significantly larger CV in larval DW was found in comparison to the standard diet.
However, there is likely an overestimation of the survival rate among all treatments due to unobserved mortality, particularly in the first 5–10 days of rearing. Rapid larval degradation during this period made accurate daily counts challenging, thereby affecting precise daily feed ration estimation. The MDa-2Cop treatment showed better survival rates than even MDe-Cop-Art (Figure 3), based on daily mortality counts throughout the trial, although MDe-Cop-Art clearly outperformed in terms of final survival achieved (Table 2). The complex feeding regime of MDa-2Cop, involving two copepod species, may have led to unrecorded mortality due to issues with feed acceptance. Larvae reluctant to accept diets often lead to mortality from starvation and/or cannibalism [57].
At 56 dph, the growth performance of larvae from the standard treatment, in terms of DW and SL, was comparable to, or even better, than previously reported growth data for gilthead seabream larvae reared under laboratory conditions, using similar ambient temperature and salinity [11, 58]. This highlights the effectiveness of ideal rearing conditions within the present study. The four novel experimental feeding regimes exhibited similar rankings based on DW when compared to the standard diet, although they displayed significantly lower SL values, except for MDe-Cop. Despite the feeding regime MDe-Cop-Art resulting in the best larval survival and consequently, the highest competition, it achieved a DW at the end of the trial that was marginally higher than that of all the other newly formulated feeding regimes. Furthermore, our study revealed that applying a feeding regime comprising initial simultaneous feeding of copepod and MD, followed by a “Kiss of Artemia”, resulted in a ~78% enhancement of survival compared to the standard diet commonly applied in commercial practices. Hence, the MDe-Cop-Art feeding regime emerged as the most effective novel diet, outperforming in survival and showcasing good growth performance.
The evaluation of growth performances across the different feeding regimes presents a challenge due to the strong antagonistic relationship between survival and growth depending on feeding regime, whereby survival explained 40% to 97% of the variation of the growth performance in the regression analysis. For instance, feeding regime Std-Art resulted in a reduction of 0.46 mg in final DW per 1% increase in survival, whereas the MDe-Cop-Art showed a smaller regression coefficient at 0.35 mg, suggesting that the latter feeding regime provided more and higher quality nutrients for both survival and growth. However, the antagonistic relationship affected the standard diet substantially less because of lower level of survival (21.1% vs. 37.5%). Therefore, the use of the standard diet achieved 25% higher DW per larvae than feeding regime MDe-Cop-Art. The nested regression analyses give clear insight into the strongness of potential antagonistic correlations between growth and survival of seabream larvae due to the feeding regimes. These antagonistic correlations between growth and survival as a result of a feeding regime have to be considered to assess the efficiency of a feeding regime with respect to economics and welfare. Comparable analyses and results are currently lacking in the literature. It is also noteworthy that the standard diet only resulted in a biomass of 16 g of larvae per tank, while the MDe-Cop-Art diet achieved 69 g as a result of higher survival rate. In comparison to the other newly formulated diets, MDe-Cop-Art yielded substantially higher larval survival and achieved even slightly higher DW, suggesting the overall nutritional superiority of this feeding regime.
5. Conclusion
The study provides valuable insights into gilthead seabream larval rearing intricacies, emphasising the significance of precision feeding and management, live feed preferences and the timing of weaning strategies. The newly formulated feeding regimes, especially the MDe-Cop-Art, present a promising improvement in gilthead seabream larvae rearing for the industry. Introducing MD from the onset of first-feeding influences gilthead seabream larvae development and significantly improves survival. Differences in mortality observed in the study underscore the significant influence of copepod-based feeding regimes during the early rearing phase. These regimes resulted in higher survival rates and biomass production per tank compared to rotifer-based diets. This highlights the importance of live feed preferences and their impact on stimulating feeding activity and digestion processes. Moreover, our research suggests that a successful weaning strategy for gilthead seabream larvae onto “state-of-the-art” MDs still benefits from a short inclusion of Artemia (“Kiss of Artemia”). The evaluation of growth performances per larvae across the different feeding regimes highlights the antagonistic relationship between survival and growth, emphasising the need for careful consideration of initial stocking density and feed management to ensure optimal conversion efficiency of the largely superior feeding regime MDe-Cop-Art. Our findings contribute to the optimisation of gilthead seabream hatchery management procedures, addressing a longstanding challenge of high larval mortality rates. Further research is encouraged to deepen our understanding of the long-term effects of applying a co-feeding strategy of inert and live feed on post-larvae performance, including additional biological data, such as mechanistic, histological and metabolic factors.
Conflicts of Interest
The authors declare no conflicts of interest.
Funding
The funding for this study was provided by the Deutsche Bundesstiftung Umwelt, DBU (Project AZ: 34533/01-34) and the Fraunhofer Research Institution for Individualized and Cell-Based Medical Engineering.
Acknowledgments
The authors would like to express their gratitude and thanks to Diana Mikhaylovskaya and David Brenfeld for their valuable assistance in larval rearing and analytical support. Further special thanks to Sebastian Lippemeier for supplying essential algae for live feed production and larval rearing, and to Jan Giebichenstein for rearing guidance and facilitating access to CFEED and A. tonsa. The authors would also like to thank the members of the Fraunhofer IMTE for assistance in raising and sampling fish during the trial.
Supporting Information
Additional supporting information can be found online in the Supporting Information section.
Open Research
Data Availability Statement
The original data supporting the findings of this study are available upon reasonable request from the corresponding author.


