The Impact of Stocking Density on Water Quality, Survival and Growth Performance of Free-Swimming Larvae of Goldfish, Carassius auratus (Linnaeus, 1758) in an Indoor Biofloc System
Abstract
A 30-day experiment was conducted to assess the influence of varying stocking densities (2, 4, 6 and 8 larvae L−1) on the growth performance and survival of free-swimming larvae of Carassius auratus, commonly known as goldfish, within an indoor biofloc system. The larvae (7.05 ± 0.02 mm in length and 1.40 ± 0.00 mg in weight) were stocked in circular tanks wherein a volume of 50 L of water was maintained and provided with vigorous aeration. The experiment used a completely randomised design with five replicates for each density group. A diet comprising a 1:1 mixture of powdered groundnut oil cake and rice bran (RB) was provided as feed. The RB was added daily as a carbon source to maintain the C/N ratio at 20:1. The highest % length gain (209.46 ± 1.47), % weight gain (14028 ± 99.65), specific growth rate (SGR) (16.50 ± 0.02), survival (85.00% ± 1.00) and the lowest apparent feed conversion ratio (AFCR) (1.84 ± 0.01) were recorded in the density group of 2 larvae L−1 (p < 0.05) as compared to other density groups. The results indicated a better stocking density of 2 larvae L−1 for growing free-swimming larvae of goldfish for 30 days.
1. Introduction
The global ornamental fish industry has seen remarkable growth, supported by ~100 million enthusiasts and valued at US$ 18–20 billion [1]. Freshwater ornamental fishes constitute around 60% of this trade [2]. Among them, goldfish is one of the most popular and commercially significant species [3, 4]. This species is widely cultivated, employing various cultural practices. The availability of high-quality fry round the year is essential for the success of ornamental fish farming. The fish in the larval phase is small, sensitive and requires strict management to obtain optimal performance and survival [5, 6]. The larviculture stage is a crucial phase in fish culture, as it has many challenges such as slow growth and high mortality rates [7]. These issues are primarily due to the limited availability of live food, predators, fluctuating water quality and diseases [8, 9].
Goldfish larvae are usually grown in low-density pond systems with a stocking density of 0.3 larvae L−1 and fed commercial diets containing 32% crude protein [10]. However, the survival rate of goldfish larvae in such systems is 67.5% [10]. Low stocking density and low survival rates may hamper the growth and productivity [10]. Therefore, it is necessary to use an intensive culture technique that improves the productive characteristics, makes effective and efficient use of resources and supports the high population density in the larviculture of this species.
Biofloc technology is effective in improving goldfish survival and growth. According to studies by Faizullah et al. [9], biofloc systems produce higher specific growth rates (SGRs) and mean weight gain than traditional systems. Furthermore, biofloc technology has been found to enhance growth and increase survival rates of goldfish larvae [11]. These results show that biofloc technology has the potential to transform the sustainability and efficiency of goldfish aquaculture, offering improved growth rates, enhanced sustainability and increased survival rates.
A biofloc system is an alternative, effective method for enhancing fish larvae growth and quality [12, 13]. The aim of this system is not only to improve water quality but also to increase the efficiency of feed utilisation by converting inorganic nitrogen waste to microbial biomass that can be served and consumed as natural food by the cultured organisms within the culture system [14]. The biofloc system also introduces exogenous digestive enzymes [15] and improves pigmentation [16] and the biosecurity of the culture by preventing the introduction and spread of disease [17, 18]. One of the most crucial factors in aquaculture is stocking density since it has a direct impact on the fish’s ability to survive, growth, behave, health, feeding and production [19]. According to Rahman and Marimuthu [20], there have been reports of both positive and negative associations between stocking density and growth, and the structure of this interaction seems to be species-specific.
A recent study by Besen et al. [11] investigated the impact of different stocking densities (10, 20 and 30 larvae L−1) on C. auratus larval culture in a biofloc system. The experiment was conducted for 15 days, and larvae were fed with Artemia nauplii. The highest total length (15.78 mm) was recorded at a stocking density of 10 larvae L−1. It showed that the experimental larvae had not achieved fry size in a rearing period of 15 days. Previous research by Bonded-Reantaso [21] found that the length and weight of the fish have significant effects on their marketability. However, selling fish smaller than the fry size in the Indian market is somewhat challenging for retailers. Therefore, as per the demand of consumers, it is necessary to rear these goldfish larvae with a stocking density of less than 10 L−1 and increase the duration of rearing to about 30 days in the indoor biofloc system. So, the required fry size for the Indian market can be produced.
The results of various studies suggest optimisation of the stocking density for each species and the production phase to ensure animal welfare, facilitate effective management and optimise output and profitability. Hence, this study evaluated the water quality, survival and growth performance of free-swimming larvae of goldfish reared at different stocking densities in indoor biofloc systems.
2. Materials and Methods
A 30-day experiment was carried out in the Wet Laboratory, Department of Aquaculture, College of Fisheries Ratnagiri (17˚ 02′03.99” N; 73˚ 31′62.08” E), Dr. Balasaheb Sawant Konkan Krishi Vidyapeeth (DBSKKV), Maharashtra, India to assess the water quality, growth and survival of free-swimming larvae of the C. auratus in an indoor biofloc system at different stocking densities.
2.1. Biofloc Inoculum Preparation
Biofloc inoculum was prepared as per the procedure given by Avnimelech [22], 7 days before the commencement of experiments. A 100 L capacity high-density polyethylene (HDPE) tank was used for this purpose, following disinfection, washing and drying. Lime-treated groundwater (pH: 7.5–8.5) was added to the tank up to 90 L, and continuous vigorous aeration was provided. Pond soil sourced from the College of Fisheries; Ratnagiri was incorporated into the tank at a rate of 3 g L−1. Additionally, rice bran (RB) and ammonium sulphate were added to the tank at the rate of 200 mg L−1 and 10 mg L−1, respectively. A total biomass of 210 g of Nile tilapia, Oreochromis niloticus, was stocked in the tank, and fish were fed a diet containing 32% crude protein at a rate of 4% of body weight per day. RB was added daily as a carbon source to maintain a C: N ratio of 20:1 [23]. When the floc volume reached a level of 20 ml L−1, it was used to inoculate the experimental tanks.
2.2. Experimental Tanks, Animal and Experimental Design
At the start of the experiment, all the circular experimental tanks were filled with 48 L of lime-treated well water (pH: 7.5–8.5) and inoculated with 2 L of water containing biofloc. Each tank was provided with vigorous aeration.
The free-swimming larvae of C. auratus were procured from a private ornamental fish production unit, Hans Aquaculture, Raigad, Maharashtra, India. Following acclimatisation, the larvae were randomly distributed in experimental tanks. A total of 5000 free-swimming goldfish larvae (7.05 ± 0.02 mm and 1.40 ± 0.00 mg) were stocked at different densities of 2, 4, 6 and 8 larvae L−1 in 100 L capacity HDPE tanks, where 50 L water volume was maintained. The experiment was designed as per a completely randomised design (CRD), with five replicates for each density group.
2.3. Provision of Aeration and Shelter/Substrate
The aeration was provided by an air pump (HAILEA, Model: HAP - 120) of 60 W capacity to meet the oxygen demand and keep biofloc in suspension. The sinkers were attached at the bottom of each aeration tube and positioned at the bottom of the experimental tank to provide aeration at the bottom and avoid the development of an anaerobic zone. Each tank was provided with two bunches made up of five plastic strips (length 50 cm, width 3 cm) to provide shelter for the protection of larvae from agitation due to vigorous aeration. These strips also served in the trapping of excessive suspended particles.
2.4. Feed and Carbon Source
The groundnut oil cake (GOC) and RB were ground, sieved and mixed in a 1:1 (w/w) ratio and soaked before being offered as feed for larvae [12]. This mixture was fed at a rate of 400% and 800% of the initial average body weight per day for the first 5 days and the rest of the experimental duration, respectively. The fish were fed twice a day at 10:00 and 16:00 h. Finely powdered RB was applied as a carbon source to maintain a C: N ratio of 20:1 [12] following the method given by De Schryver et al. [24].
2.5. Water Quality Analysis
Water quality parameters such as temperature and pH were monitored daily between 09:00 and 11:00 h with the YSI A Xylem Pro1020. Total ammonia–nitrogen (TAN), nitrite–nitrogen (NO2-N) and nitrate–nitrogen (NO3-N) were measured spectrophotometrically, and dissolved oxygen (DO) and total alkalinity were monitored every seventh day [25]. Total suspended solids (TSSs) and total dissolved solids (TDSs) were recorded as per the procedure of Strickland and Parsons [26] and Stirling [27], respectively. The floc volume was measured using an Imhoff cone after 30 min of sedimentation [28]. Lime-treated water was added as needed to all the experimental tanks to minimise fluctuations in the pH. In the present investigation, the sludge was removed whenever a heavy settlement of organic matter was found. The water level was restored by adding lime-treated water with a pH of 7.5–8.5.
2.6. Assessment of Growth, Survival and Feed Efficiency
2.7. Statistical Analysis
Data on growth, survival and feed efficiency were analysed using a one-way ANOVA by SPSS 13.0 version. The differences were considered significant at p < 0.05. Tukey’s test was used to compare the means if a difference was determined to be significant.
3. Results
3.1. Water Quality Parameters
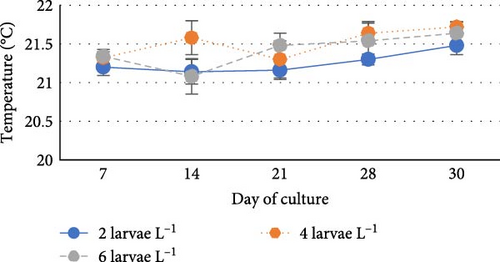
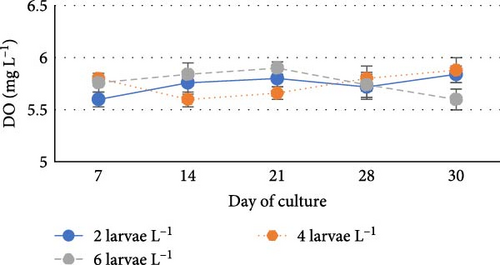
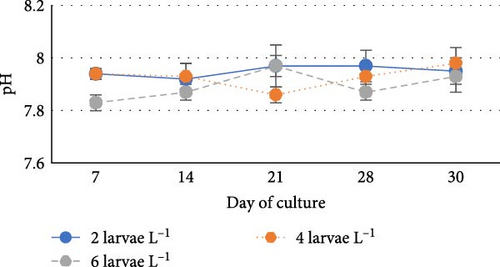
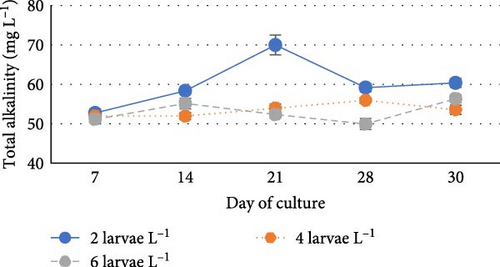
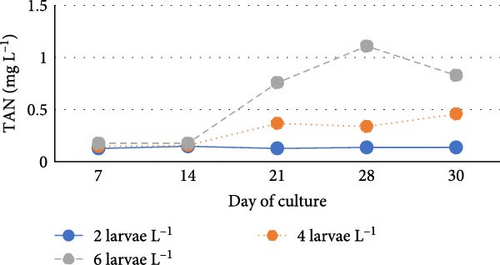
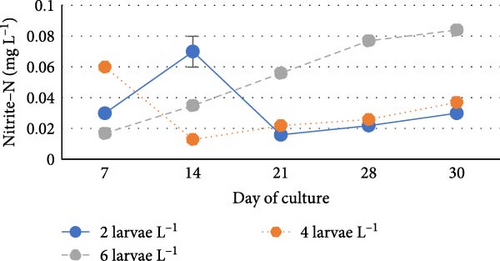
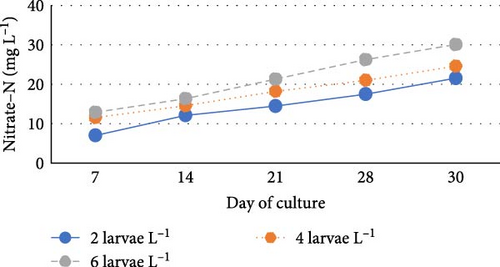
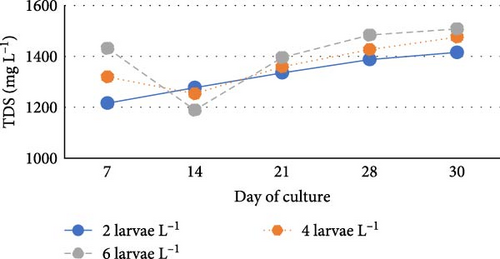
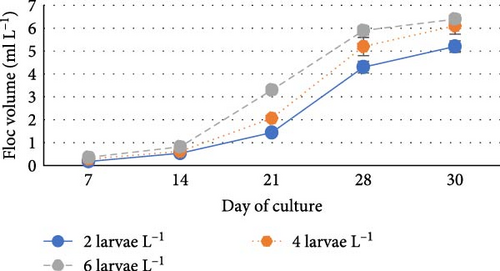
During the experiment, water quality parameters were monitored and are represented in Figure 1. The water temperature ranged from 21.08 ± 0.23 to 21.72 ± 0.06 during the experiment. The DO was consistently above 5.0 mg L−1 in all the groups (5.6 ± 0.07 to 5.90 ± 0.06). pH was found on the alkaline side and recorded between 7.83 ± 0.03 to 7.99 ± 0.06. Total alkalinity was recorded from 50.00 ± 1.41 to 79.20 ± 1.85 mg L−1. TAN crossed a level of 0.5 mg L−1 in the density group of 6 larvae L−1 on day 21, whereas it reached a peak of 1.21 mg L−1 on day 28. It was found to be the lowest (0.13 ± 0.00 mg L−1) in the low-density group (2 larvae L−1) throughout the experiment. The highest level (3.19 ± 0.08 mg L−1) of NO2-N was recorded in a group of 8 larvae L−1 on day 7. In all the other groups, the NO2-N level was recorded in the range of 0.01 ± 0.00 to 0.08 ± 0.00 and increased with progress in culture duration. The NO3-N level varied from 7.08 ± 0.04 to 30.10 ± 0.10 mg L−1 and was elevated in all the groups with time. TSS and TDS ranged from 56.00 ± 4.00 to 394.50 ± 9.27 and 1190.00 ± 9.48 to 1508.00 ± 8.00 mg L−1, respectively, in density groups of 2, 4 and 6 larvae L−1. However, the stocking density groups of 4 larvae L−1 and 6 larvae L−1 recorded the lowest (56.00 ± 4.00 mg L−1) and highest (394.50 ± 9.27 mg L−1) TSS values, respectively, while the density groups of 6 larvae L−1 and 8 larvae L−1 recorded the lowest (1190.00 ± 9.48 mg L−1) and highest (1566.00 ± 9.27 mg L−1) TDS values, respectively. Floc volume increased with the increase in stocking densities. However, it was found to be the lowest (< 0.5 ml L−1) in the treatment of 8 larvae L−1 on day 7.

3.2. Growth, Feed Efficiency and Survival
The growth and survival of C. auratus larvae in various groups of stocking density in culture are shown in the Table 1. The lowest density of 2 larvae L−1 showed significantly higher growth parameters (p < 0.05) than the rest of the higher-density groups. The lowest apparent feed conversion ratio (AFCR) and the highest survival were found in the lowest density group (p < 0.05).
| Growth performance | Stocking density | p Value | |||
|---|---|---|---|---|---|
| 2 larvae L−1 | 4 larvae L−1 | 6 larvae L−1 | 8 larvae L−1 | ||
| Average final length (mm) | 21.78 ± 0.03c | 18.33 ± 0.07b | 12.56 ± 0.15a | 0 | ≤ 0.001 |
| Average length gain (mm) | 14.74 ± 0.05c | 11.27 ± 0.07b | 5.54 ± 0.14a | 0 | ≤ 0.001 |
| Percent length gain (%) | 209.46 ± 1.47c | 159.78 ± 1.29b | 78.91 ± 1.91a | 0 | ≤ 0.001 |
| Average final weight (mg) | 198.35 ± 1.30c | 111.01 ± 1.00b | 45.57 ± 2.09a | 0 | ≤ 0.001 |
| Average weight gain (mg) | 196.95 ± 1.30c | 109.60 ± 1.00b | 44.16 ± 2.09a | 0 | ≤ 0.001 |
| Percent weight gain (%) | 14,028 ± 99.65c | 7784.2 ± 66.06b | 3131.8 ± 1.44a | 0 | ≤ 0.001 |
| SGR (%/day) | 16.50 ± 0.02c | 14.55 ± 0.02b | 11.57 ± 0.15a | 0 | ≤ 0.001 |
| AFCR | 1.84 ± 0.01a | 7.73 ± 0.11b | 44.90 ± 2.54c | 0 | ≤ 0.001 |
| Survival (%) | 85.00 ± 1.00c | 72.70 ± 0.46b | 47.13 ± 0.77a | 0 | ≤ 0.001 |
- Note: Data are expressed as mean ± S.E, n = 5 (one-way ANOVA); mean values in the same row with different superscripts differ significantly (p < 0.05). Differences between means were tested with the Tukey range test.
4. Discussion
Biofloc generates greater productivity for goldfish [9] and improves the pigmentation of skin when compared to the clear water system [16]. A significant strategy for improving water and space productivity and, in turn, investment and production costs is to enhance fish density. Nevertheless, an increase in fish density may compromise the welfare of the animals, which would ultimately decrease growth and survival [29]. Numerous aquaculture species have shown negative impacts of high density on fish productivity [30], which are primarily related to stress brought on by deteriorating water quality and competition for food and space. Fish reared at very high densities often experience poor water quality, elevated levels of cortisol, reduced levels of serum immunoglobulin M (IgM) and the development of diseases that may contribute to higher mortality rates [31]. Furthermore, an increase in density raises the energy demand [32] and reduces growth and feed utilisation [33]. In general, fish reared at very low densities affect the profitability and efficiency of the culture system. The studies on Arctic charr [34] and European seabass [35] revealed the nonformation of shoals, reduced feed intake and growth rate at lower densities tested.
4.1. Water Quality
The stocking density of the cultured animals, environmental factors, the combination of species and the quality and quantity of nutritional input provided to the system have a significant impact on water quality [36, 37].
Water temperature is the most important physical environmental parameter that controls the metabolic rate and has an impact on all physiological processes in fish, including respiration, food intake, metabolism and nutrition efficiency [38]. Fish growth is highly influenced by water temperature, and it will be negatively impacted by water temperatures that are either too high or too low [39]. In this study conducted during the winter season, the water temperature ranged between 21.08 ± 0.23 to 21.72 ± 0.06°C, which falls within the optimal range of 20–24°C for rearing newly hatched goldfish larvae [40].
One of the typical characteristics of biofloc systems is the fluctuation of nitrogenous waste contents, DO and pH [41, 42]. The DO level, pH and total alkalinity as recorded in the present investigation were found to be comparable with their ranges recorded during the larval rearing of fishes from Cyprinidae family like catla [12] and rohu [43] in biofloc system. Van Wyk and Skarpa [44] found a strong correlation between pH and alkalinity, suggesting that a drop in alkalinity will cause an increase in pH oscillations in the culture system. In the biofloc system, the enhanced nitrification process and respiration rate of heterotrophic microorganisms reduce the pH and total alkalinity [36, 41, 45–47]. pH fluctuations predominantly affect the larvae, who are most susceptible to them [48].
In this study, TAN concentrations increased significantly with stocking density of up to 6 larvae L−1, consistent with previous findings Prajith and Madhusoodana [49]. The highest TAN levels were observed in the 6 larvae L−1 group on days 21 and 28, likely due to organic matter buildup, increased mineralisation, higher fish excretion and greater waste accumulation [50]. Conversely, the lowest TAN levels were recorded in the low-density group (2 larvae L−1), possibly due to reduced waste output and balanced nitrification.
The increased concentrations of nitrite are hazardous to fish, which can also slow down their growth and decrease their chances of surviving in culture [51]. In this study, NO2-N levels increased in direct proportion to stocking density, consistent with findings by Solanki et al. [12] and Prajith and Madhusoodana [49]. The toxic level of NO2-N was recorded on day 7 in the highest density group of 8 larvae L−1, which might be the primary cause of death of all the larvae. Accumulation of higher levels of nitrite in the highest density group may be related to nitrification occurring in this treatment group, which results in a higher concentration of inorganic nitrogen [52, 53], higher biomass, high feed input and faecal output. Moreover, the relatively lower nitrite level was recorded in the lowest-density group of 2 larvae L−1, which may be attributed to less biomass, low feed input and faecal output.
Nitrate is the final product of nitrification and is nontoxic at a moderate level. In this study, the level of NO3-N concentration increased with increasing stocking density. However, the differences were insignificant among the density groups (p > 0.05). A slightly higher level of nitrate in the high-density group may be due to the enhanced nitrification activity, increased nutrient input and balance of nutrient cycling can lead to the conversion of ammonia to nitrite and then nitrite to nitrate [46, 54]. In this study, in a group of 8 Larvae L−1, the nitrate concentration on day 7 did not increase compared to other densities. This might be due to the nitrifying bacteria in water, which are unable to convert nitrite to nitrate within a short span of 7 days.
In this study, the TSS level increased insignificantly with increasing stocking density up to 6 larvae L−1 and showed no negative impact on the growth and survival of goldfish larvae. The previous studies by Besan et al. [11] and Poli et al. [45] suggested that the concentration of TSS up to 300 mg L−1 and 200–1000 mg L−1 showed no negative effect on the growth performance of C. auratus and Rhamdia quelen larvae in biofloc systems, respectively. Similarly, Solanki et al. [12] and Dey et al. [43] found TSS in the range between 28.2–250.98 mg L−1 and 34–120 mg L−1 during nursery rearing of catla and rohu spawn in the biofloc system, respectively. In this study, the highest concentration of TSS was found in the treatment group of 6 larvae L−1. An increased microbial biomass, a high concentration of organic matter in the form of suspended particles of feed, carbon sources and faecal matter and limited water exchange are the primary contributing factors of TSS accumulation over time in less or zero water exchange [55]. In this study, the TSS concentration of 60.00 ± 4.47 mg L−1 was found in the stocking density of 8 larvae L−1 on the seventh day of culture. This occurred due to the limited development of a heterotrophic microbial community within a short span of 7 days. During this study, the TDS level was increased insignificantly with increasing stocking density as a result of higher levels of input (feed, carbon source) and output (faecal matter).
Floc volume is an important parameter in biofloc system that directly impacts the water quality, survival and growth of larvae during the nursery-rearing period. During this investigation, the floc volumes reached a level of 6–7 ml L−1 (6.40 ± 0.18) from the 14th day to the end of the current experiment, which indicated acceleration, multiplication and aggregation of microbes in the culture system. However, the floc volume did not vary significantly among the density groups. Insignificant differences in floc volume may be attributed to higher consumption of floc by the greater number of larvae in the high-density groups and to the regular removal of floc settled at the bottom of the tanks.
4.2. Survival
In this study, total mortality was observed in the treatment of the highest stocking density of 8 larvae L−1. High organic loads in the form of feed and carbon sources were added to the tank, which accelerated the accumulation and degradation of heavy particles at the bottom of the tanks [56, 57], which deterioted the water quality and possibly caused stress and total mortality. Moreover, mortality may be due to social interactions and aggressive encounters, reduction in habitat space and sheltered areas, stress, competition for food and space [58, 59], high biomass [60], deterioration of health due to positive interaction of stressful factors [61], poor handling [62] and high cannibalism [63]. Among the remaining densities investigated in the current study, a significant decrease in survival with an increase in the stocking density was recorded. These results corroborate the findings of Schveitzer et al. [64]; Prajith and Madhusoodana [49]; Ueno-Fukura et al. [7] and Fauji et al. [29] during the culture of Litopenaeus vannamei, nursery rearing of Macrobrachium rosenbergii, Pterophyllum scalare and Clarias gariepinus, respectively, in biofloc system.
4.3. Growth Performance
Stocking density is a factor that affects growth and shows an inverse relationship between these factors [65–68]. The growth performance of goldfish larvae in the present investigation was found to be density-dependent. Significantly lower growth in higher-density groups may be attributed to reduced space and competition or availability of food [69] and poor water quality [70]. The density-dependent growth is comparable with the findings of Solanki et al. [12] and Dey et al. [43] during nursery rearing of catla and rohu spawn in the biofloc system.
In contrast, Ueno-Fukura et al. [7] reported a higher length of P. scalare post-larvae at the highest stocking density (50 post-larvae L−1) as compared to the lower density group (25 post-larvae L−1). This was correlated to the higher mortality recorded in the high-density group which ultimately reduced the larval density lower than the low-density group which ultimately provided greater food and space.
The feed conversion ratio (FCR) is referred to as ”apparent” in this work because real food consumption was not possible to monitor in the biofloc environment [71]. In this experiment, the significantly lowest AFCR (1.84 ± 0.01) was recorded in the stocking density group of 2 larvae L−1. This indicated that both the biofloc and feed were more efficiently utilised by larvae at the lower stocking densities. The findings of the current study are consistent with Wasielesky et al. [72]. The group with the 6 larvae L−1 stocking density in this study had the highest AFCR (44.90 ± 2.54). All the density groups were fed at the same pre-decided feeding rate throughout the rearing period. The feed ration was decided based on the initial biomass of each group. Although larval mortality takes place in all the groups at variable rates, the feed ration remained the same as decided based on initial biomass. In high-density groups, survived larvae were less, and relatively more feed ration was provided. This fact has led to increased AFCR in high-density groups.
5. Conclusion
The stocking densities tested in this study had a significant impact on water quality, survival and growth performance of free-swimming larvae of goldfish. The present study demonstrated that the rearing of free-swimming larvae of goldfish for 30 days with a stocking density of 2 larvae L−1 in an indoor biofloc system produce goldfish at the required fry size for the Indian market.
Ethics Statement
All fish samples were collected according to the animal protocols certified by the College of Fisheries, Dr. Balasaheb Sawant Konkan Krishi Vidyapeeth Research Committee.
Conflicts of Interest
The authors declare no conflicts of interest.
Funding
The author received no financial support for the research, authorship or publication of this article.
Acknowledgments
The authors express their gratitude to the authorities of Dr. B.S.K.K.V., Dapoli, for granting permission to conduct this study and for providing all essential facilities at the College of Fisheries, Ratnagiri, Maharashtra, India.
Open Research
Data Availability Statement
The data supporting the findings of the study are available from the corresponding author upon request.


