Genetic and Morphology Analysis Among the F1 Hybrid Chinese Soft-Shelled Turtle (Pelodiscus sinensis Huangsha ♂×Pelodiscus sinensis Japanese Strains ♀) and the Parental Varieties
Abstract
Hybridization is an effective method for the genetic improvement of breeding varieties, while establishing standardized management systems and identification methods is an important foundation for obtaining stable hybrid new varieties with desirable traits. This study conducted measurements and analyses of eight morphological indicators of three Chinese soft-shelled turtle (Pelodiscus sinensis) populations: the Huangsha turtle (P. sinensis Huangsha, HS), Japanese turtle (P. sinensis Japanese strains, JP), and their hybrid F1 generation (HS ♂ × JP ♀, HJ). Based on several important indicators, a discriminant function was established, and after cross-validation, the comprehensive discriminant accuracy was 86.4%. In addition, we used super-genotyping-by-sequencing (GBS) sequencing technology to analyze the genetic structure and genetic diversity of the three populations. The results showed that the HJ population had a closer genetic relationship with the JP population as the maternal parent and a farther genetic relationship with the HS population. The genetic diversity was between the HS and JP populations, and the genetic distance between the HS and JP populations was far. Through fingerprint analysis technology, core SNP markers for germplasm identification were screened, and a total of 148 core SNP marker loci were obtained. One SNP marker that could distinguish the HJ population from the HS population was developed. This study will provide reference for the hybrid breeding and genetic management of Chinese soft-shelled turtle.
1. Introduction
Chinese soft-shelled turtle (Pelodiscus sinensis) is an important high-value commercial species widely distributed in China, Thailand, Japan, South Korea, Vietnam, and other regions [1]. With the continuous improvement of people’s living standards, the breeding yield of Chinese soft-shelled turtle is also constantly increasing. According to the China Fisheries Statistical Yearbook, the annual production of P. sinensis reached 370,000 tons in 2022 [2].
However, the current Chinese soft-shelled turtle breeding industry still faces many problems. Germplasm degradation, the prevalence of infectious diseases, and the lack of basic research on Chinese soft-shelled turtle biology have greatly affected the sustainable development of the breeding industry. In order to obtain new varieties with excellent traits, many efficient breeding technologies have been developed at home and abroad, including selective breeding, hybrid breeding, and molecular marker-assisted breeding. Hybrid breeding is the most widely used technology in China in recent years, which refers to the process of genetic differentiation of individuals or populations through mating to produce new populations [3, 4]. The hybrid offspring often exhibit stronger vitality and performance, namely, heterosis [5]. Although the mechanisms underlying heterosis remain elusive, hybridization has been widely utilized to enhance traits such as growth performance, disease resistance, and heat tolerance in aquatic species [6]. Examples of such applications include hybrid tilapia (Oreochromis niloticus female × Oreochromis aureus male, AN) [7], three-way cross-hybrid abalone [8], and rainbow trout (Oncorhynchus mykiss) [9].
In recent years, multiple experiments have been conducted on hybrid soft-shelled turtles, such as the hybridization between Qingxi black soft-shelled turtle (female) and Japanese strain soft-shelled turtle (male) [10], the hybridization between Huangsha soft-shelled turtle and Japanese strain soft-shelled turtle [11], and the hybridization between Yellow River soft-shelled turtle and Chinese soft-shelled turtle [10]. Studies have shown that the hybrid offspring of Chinese soft-shelled turtles have hybrid advantages compared to their parents [12]. However, due to the lack of standardized management measures, hybrid offspring often mix and mix with their parents, which not only affects the breeding process but also damages the germplasm protection of their parents [13]. At present, germplasm degradation has become a major obstacle to the sustainable development of China’s turtle industry [14]. In order to better manage the P. sinensis breeding industry, it is necessary to establish identification methods to distinguish between hybrid offspring and parent populations and to study the genetic structure and diversity between hybrid offspring and parents.
Morphological index is one of the important indexes in hybrid breeding research, and it is the direct selection parameter of breeding. Species identification based on morphology is the most practical identification method in the breeding process. Previous studies have shown that hybrid offspring and parents exhibit different morphological characteristics [15, 16] and have high reliability in discrimination accuracy [17], indicating that morphological markers can be used to identify hybrid species. However, the morphological differences between the P. sinensis Huangsha (♂, HS) × JP (♀, JP) hybrid (HJ) and the parental varieties have not been studied so far. Since the 1980s, with the rapid development of molecular biology technology, molecular marker technology has emerged. Compared with morphological markers, molecular markers can directly reflect the DNA information of the genome without being affected by the growth environment, physiological status, and age of the sample. Among molecular markers, single-nucleotide polymorphisms (SNPs) are currently the most popular one. It is the simplest molecular marker in biology, referring to the polymorphism of DNA sequence caused by the transformation or reversal of a single base on the genome DNA sequence [18]. Due to its advantages such as low cost, codominance, high-throughput analysis, and low typing error rate, SNP markers are also important tools for population and quantitative genetics [19].
Genetic diversity is often considered as the sum of genetic variations between individuals within a species [20] and is also an important indicator of the environmental adaptability of a species or population. At present, studies on the genetic diversity of Chinese soft-shelled turtles have used mitochondrial Cytb genes [21], mitochondrial genomes [22–24], and microsatellite DNA (SSR) [14, 25–28], and restriction fragment length polymorphism (RFLP) [3]. However, these methods can only provide limited genetic information, and the uneven distribution and low density of SSR in the genome limit the accuracy of population genetic structure analysis [29]. RFLP has technical limitations [30], and genetic diversity research on P. sinensis mainly focuses on different geographical species, with less research on their hybrid. Therefore, it is necessary to develop a large number of high-density and stable molecular markers at the whole-genome level to study the genetic relationship between HJ and HS and JP. SNP markers have higher genetic stability than other markers and are more widely distributed in the genome [31].
With the development of next-generation sequencing (NGS), the cost of nucleotide sequencing has been greatly reduced, making the development of genetic markers more convenient. Genotyping-by-sequencing (GBS) technology mainly uses the method of enzyme digestion and tagging to obtain genome sequence information near the enzyme digestion site through sequencing and then detects a large amount of highly accurate SNP variation information [32]. The GBS method can conduct data exploration covering the entire genome at a lower cost [33]. The obtained SNPs have high density and good uniformity within the genome and can better represent the genetic information of the entire genome. In addition, some studies have shown that GBS technology is particularly suitable for analyzing populations with low genetic differentiation [31]. Therefore, this method has high accuracy and stability in assessing the genetic diversity of species.
In this study, we measured seven morphological indicators of HJ, JP, and HS group and then used multivariate analysis to analyze the morphological differences among the three populations. Furthermore, we used super-GBS sequencing technology to analyze the genetic structure and genetic diversity of the three populations and screened core SNP markers for germplasm identification through fingerprint analysis technology. The results obtained in this study can provide reference for hybrid breeding and genetic management of P. sinensis.
2. Materials and Methods
2.1. Materials
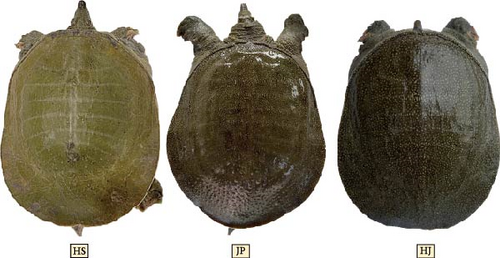
Original strains of HS were introduced from the Huangsha soft-shelled turtle breeding core demonstration base in Jintian Town, Guiping City, Guangxi, and original strains of JP were introduced from JP Breeding Farm in Haining City, Jiaxing, Zhejiang Province. These were then cultured at the Xin Zhuang Fishery Service Department breeding farm in Nanfeng County, Jiangxi Province, where they were crossbred to produce the hybrid F1 generation (HS ♂ × JP ♀, HJ) (Table 1). The breeding pond has an area of 333 m2. During the growth stage, feed is administered twice daily, at 7:00 AM and 4:00 PM, with the feeding amount controlled at ~3% of the body weight. The breeding cycle lasts for 1 year and 6 months. According to the requirements of the Biomedical Research Ethics Committee of Hunan Agricultural University (Changsha, China), before conducting the experiment, samples from each population were anesthetized in the laboratory by immersion in MS-222 (Coolaber, Beijing) at a concentration of 8000 mg/L for 300 s. Ten samples of HJ were randomly collected from the breeding farm and subjected to super-GBS sequencing. After sampling, the wounds were disinfected with alcohol. The vital signs of P. sinensis in each group were normal, and they recovered well. Prior to this, laboratory sequencing was performed on HS and JP groups, HJ samples collected from Huaihua Tongdao breeding base in Zhejiang, and HS samples collected from Huangsha soft-shelled turtle breeding core demonstration base in Jintian Town, Guiping City, Guangxi (Figure 1). The parent strains used for breeding and sequencing were all purebred, and samples used for measurement and sequencing were randomly selected.
| Population | Male (female) | Number | Weight (g) | Collection date |
|---|---|---|---|---|
| HS | Male | 16 | 867.93 ± 206.80 | April 2022 |
| Female | 14 | 791.16 ± 153.07 | ||
| JP | Male | 25 | 864.80 ± 203.72 | July 2023 |
| Female | 25 | 850.00 ± 196.49 | ||
| HJ | Male | 30 | 1141.76 ± 99.64 | April 2022 |
| Female | 30 | 976.35 ± 98.85 |
2.2. Morphological Analysis
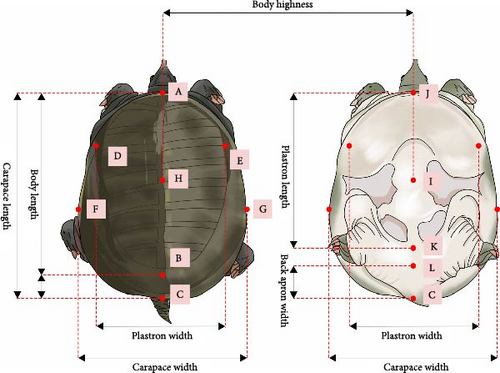
According to the measurement methods specified in the Chinese Softshell Turtle National Standard (GB21044-2007) as shown in Figure 2, seven morphological traits of three populations of P. sinensis were measured, including body length (BL), SH, carapace length (CL), carapace width (CW), plastron length (PL), plastron width (PW), and back apron width (BAW). BL, SH, CL, CW, PL, and PW were measured using a digital caliper (accuracy of 0.01 mm), while body weight was measured using a digital balance (accuracy of 0.01 kg).
2.3. Super-GBS Sequencing
DNA was extracted using the EasyPure Genomic DNA Kit (Beijing TransGen Biotech Co., Ltd., China). The quality and purity (OD260 nm/OD280 nm = 1.8–2.0) of the DNA were assessed using 1% agarose gel electrophoresis and NanoDrop 1000 spectrophotometry (Thermo Fisher Scientific, USA). The extracted DNA was then subjected to sequencing analysis.
DNA was digested with the restriction enzymes PstI-HF/MspI, and the recovered fragments were PCR amplified using high-fidelity enzymes. The concentration of the PCR products was measured using Qubit, and the prepared libraries were sequenced using Illumina HiseqXten (PE150). The sequencing data obtained from the HJ population in this study were aligned with the reference genome (https://ftp.ncbi.nlm.nih.gov/genomes/all/GCF/000/230/535/GCF_000230535.1_PelSin_1.0/GCF_00 0230535.1_PelSin_1.0_genomic.fna.gz) along with sequencing data previously acquired for the HS and JP populations using the same method. The vcftools software was used for filtering, with the main parameters set as −maf 0.05 −max-missing 0.8 −minDP 8, resulting in 807,626 SNPs after filtering.
2.4. Genetic Difference Analysis
Based on the selected SNPs, PCA and population genetic structure analysis will be performed. A phylogenetic tree will be constructed using the neighbor-joining method, and genetic distances and genetic differentiation coefficients will be calculated. Additionally, the observed heterozygosity, expected heterozygosity, polymorphic information content (PIC), observed number of alleles, effective number of alleles, and nucleotide polymorphism will be calculated. The sequencing data were initially processed using Stacks [35] software to demultiplex and filter the raw reads based on barcode and cleavage site information. Quality control was performed using fastp software [36], removing reads with N (non-ACTG) bases equal to or greater than 5 and filtering out windows with an average base quality less than 20. The clean reads were then aligned to the reference genome using bwa software, and SNP/Indel detection and typing were performed using GATK software [37].
To ensure robust results, variant filtering was conducted using vcftools, discarding loci with sequencing depth <4, SNPs with minor allele frequency (MAF) <0.01, and SNPs missing in more than 20% of the samples. The filtered SNPs were annotated using SnpEff, and an evolutionary tree was constructed using treebest. The phylogenetic tree was visualized using the R package ggtree.
Population structure analysis was performed using ADMIXTURE [38] to determine the optimal number of populations (K) and infer population structure. PCA was conducted using plink (v1.9) [39] to analyze SNP genotyping information. The decay of linkage disequilibrium (LD) was assessed using the Plot_MultiPop.pl script in PopLDdecay, and a decay fitting graph [24] was generated using the ggplot2 package in R. Finally, Treemix software was used to infer population differentiation and admixture patterns based on allele frequency data and to estimate the number of populations and historical admixture events [40].
2.5. Fingerprint Analysis
For sites with a depth less than 8, they will be converted to missing, and only biallelic SNP sites will be retained, defining the obtained SNPs as “sample total SNPs.” The genotype of each sample for each SNP site will be compared. If the missing rate of a certain SNP site in a breed is ≤0.0% and the consistency rate of genotypes is ≥90.0%, the genotype will be used as the genotype of the breed at that SNP site; otherwise, missing data will be used to represent the genotype of the breed at that SNP site. Nonpolymorphic sites will be removed, as well as sites with a missing rate higher than 0.0%, MAF lower than 1.0%, Hardy–Weinberg equilibrium test p-value lower than 0.01, and PIC lower than 0.1. The plink software (v1.9) will be used to perform LD pruning on the sites, with parameters set as −indep-pairwise 50 10 0.95. The remaining SNP sites will be used as core markers for the samples.
3. Results
3.1. Cluster Analysis, NMDS Analysis, and PCA
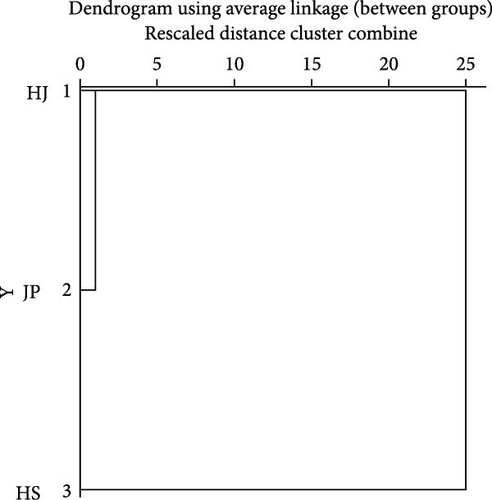
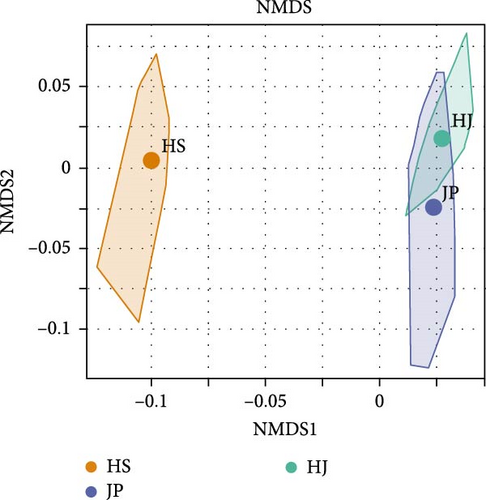
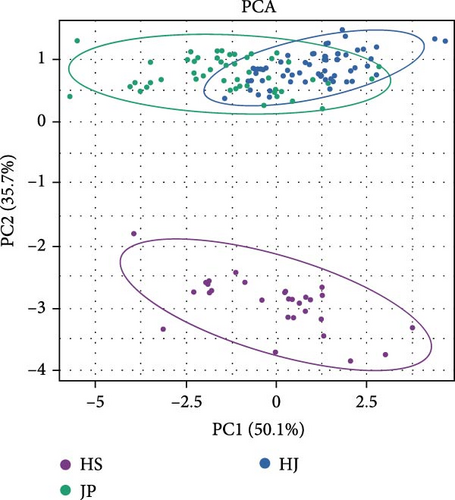
The character parameters of each group are shown in Table S1. Based on morphological data, cluster analysis was conducted. Phenotypically, the HJ population clustered first with the JP population and then with the HS population (Figure 3A). This was validated using NMDS analysis, which showed that the JP and HJ populations are closer to each other but farther from the HS population (Figure 3B). PCA based on morphological data revealed that PC1 contributed 50.1% and PC2 contributed 35.7% to the total variance, with a cumulative contribution of 85.8%, indicating representativeness. A scatter plot using the correlation values of PC1 and PC2 showed partial overlap between the HJ and JP populations, while the HS population formed a distinct cluster (Figure 3C). These analyses suggested significant morphological differences between the HS population and the other two populations, while there were some similarities between the HJ and JP populations.
3.2. Discriminant Analysis
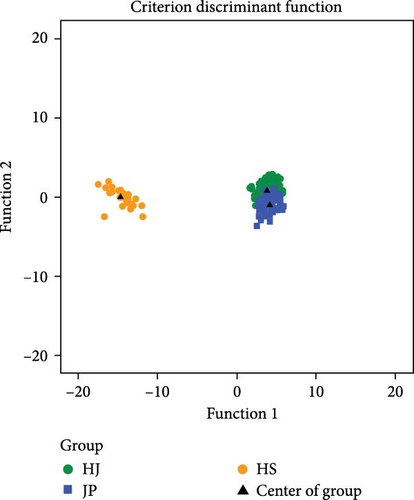
Through stepwise discriminant analysis, the three variables with the greatest contribution were selected from seven traits, which are X ∗ (CW), X ∗ (shell height [SH]), X ∗ (BL). A Bayesian discriminant function was established based on three variables, and the discrimination results for the three populations are shown in Table 2. The initial discrimination accuracy for the three populations ranged from 82.0% to 100.0%, with an overall discrimination rate of 87.1%. After cross-validation, the discrimination accuracy ranged from 80.0% to 100.0%, with an overall discrimination rate of 86.4%. Figure 4 shows minor misclassifications between the JP and HJ populations, while the HS population is clearly separated. The established Bayesian discriminant function is as follows:
| Project | Population | HJ | JP | HS | Total |
|---|---|---|---|---|---|
| Initial | HJ | 51 | 9 | 0 | 60 |
| JP | 9 | 41 | 0 | 50 | |
| HS | 0 | 0 | 30 | 30 | |
| Discriminant accuracy (%) | 85.0 | 82.0 | 100.0 | 100.0 | |
| Comprehensive discriminant rate (%) | 87.1 | ||||
| Cross-validation | HJ | 51 | 9 | 0 | 60 |
| JP | 10 | 40 | 0 | 50 | |
| HS | 0 | 0 | 30 | 30 | |
| Discriminant accuracy (%) | 85.0 | 80.0 | 100.0 | 100.0 | |
| Comprehensive discriminant rate (%) | 86.4 | ||||
3.3. Genetic Diversity and Genetic Differentiation
Based on the results in Table 3, the genetic differentiation coefficients between the HS population and the JP and HJ populations are 0.3782 and 0.3015, respectively (Fst > 0.25), while the genetic differentiation coefficient between the HJ and JP populations was 0.0143 (Fst < 0.05). The genetic differences between the HJ and JP groups are relatively small, while the genetic differences with the HS group are considerably larger. According to Wright’s research [41], when Fst > 0.25, there was significant genetic differentiation between populations, whereas when Fst < 0.05, there was no differentiation between populations. The results of genetic diversity for the three populations are shown in Table 4. The observed heterozygosity of HJ was intermediate between that of the HS and JP populations. The observed heterozygosity of the HJ and JP populations was higher than the expected heterozygosity, while the observed and expected heterozygosity of the HS population was equal. The nucleotide polymorphism of the three populations ranged from 0.1632 to 0.3016, with the HS population exhibiting the highest nucleotide polymorphism.
| Population | JP | HS | HJ |
|---|---|---|---|
| JP | — | — | — |
| HS | 0.3782 | — | — |
| HJ | 0.0143 | 0.3015 | — |
| Population | Ho | He | Na | Ne | Pi |
|---|---|---|---|---|---|
| HJ | 0.2267 | 0.2039 | 1.7626 | 1.3196 | 0.2157 |
| HS | 0.2848 | 0.2848 | 1.8560 | 1.4768 | 0.3016 |
| JP | 0.1664 | 0.1536 | 1.5968 | 1.2385 | 0.1632 |
- Note: Ho, observed heterozygosity; He, expected heterozygosity; Na, observed number of alleles; Ne, effective number of alleles; Pi, nucleotide diversity.
3.4. Genetic Structure Analysis
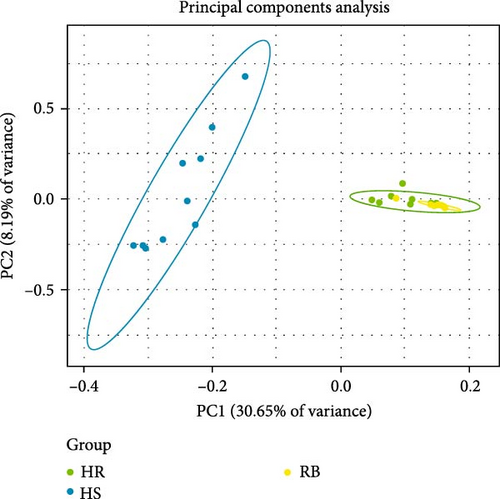
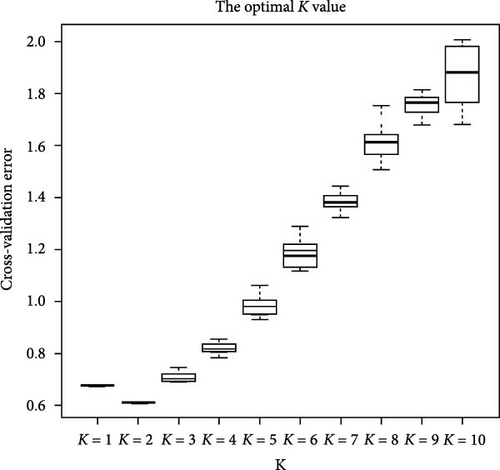
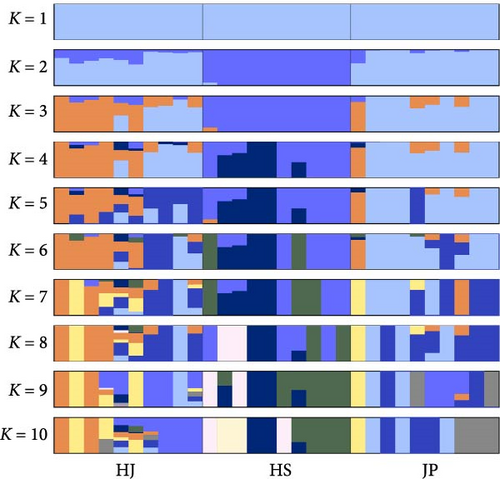
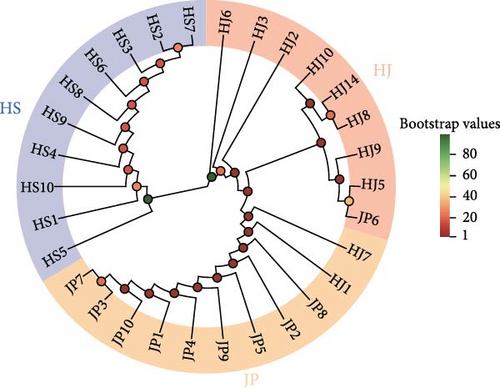
Based on the obtained SNP loci, we conducted phylogenetic tree analysis, PCA, and genetic structure analysis. The PCA results showed that the JP population was more closely related to the HJ population and more distant from the HS population (Figure 5A). When K = 2, the CV value was the smallest. The genetic structure analysis grouped the HJ and JP populations together, with the HJ population containing some genetic information from the HS population (Figure 5B,C). The results of the phylogenetic tree analysis confirmed the findings of the PCA and genetic structure analyses, as the JP population clustered first with the HJ population and then with the HS population (Figure 5D).
3.5. Core SNP Marker Screening
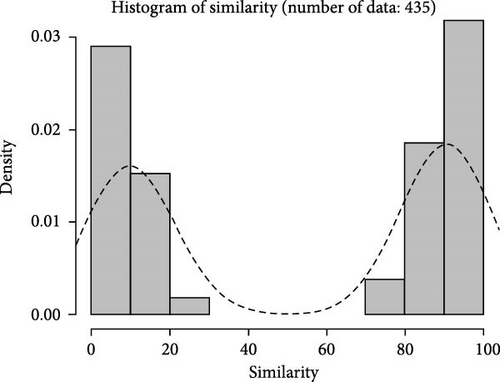
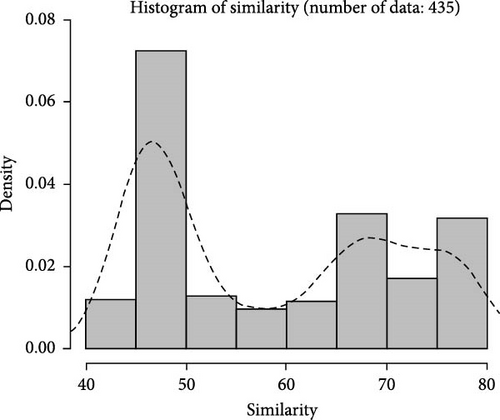
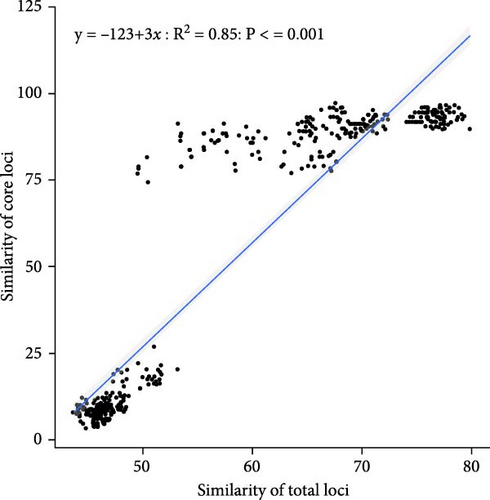
Based on fingerprinting analysis, 148 SNP loci were selected as core markers, and primers were designed (Table S2). The observed heterozygosity (Ho) ranged from 0.0333 to 0.7, and expected heterozygosity (He) from 0.255 to 0.4644, with polymorphism information content ranging from 0.2225 to 0.3566. Similarity between samples within three populations was calculated using total and core loci (Figure 6A,B), showing similar trends of an initial increase followed by a decrease. Total loci better distinguished high similarity samples. Correlation analysis (Figure 6C) showed most pairwise sample correlations were similar between total and core loci, with some differences at the ends of the fitting curve.
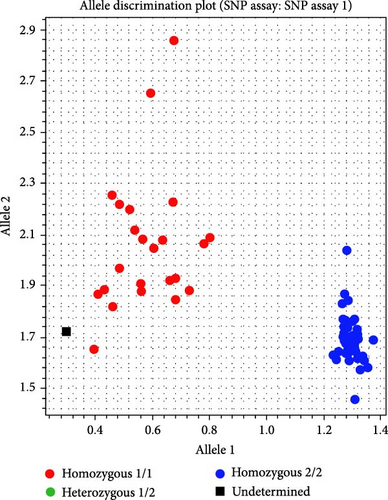
Twenty SNPs were randomly selected, and sequences upstream and downstream (≥50 bp) of SNP loci were sent to LGC for KASP primer design. F1 and F2 primer concentrations were adjusted to 36 μM and R primer to 90 μM. Equal volumes of primers were mixed to create the primer mix. The PCR system included 5 μL DNA, 5 μL KASP PCR MIX, and 0.14 μL primer mix. The reaction program was 94°C for 15 min (1 cycle), 94°C for 20 s, and 61–55°C for 60 s (−0.6°C/cycle) for 10 cycles, followed by 26 cycles of 94°C for 20 s and 55°C for 60 s. Samples from HS (23), JP (27), and HJ (28) populations were used for KASP genotyping validation of the 20 SNP loci. One SNP distinguished the HS population from HJ and JP populations (Figure 7). The primers were F1 GAAGGTGACCAAGTTCATGCTCACCTTTGCTGGCCACCAGC, F2 GAAGGTCGGAGTCAACGGATTCCACCTTTGCTGGCCACCAGT, and R GCAGACGCTGCCTCCCCACA. No SNP loci distinguished between HJ and JP populations.
4. Discussion
The differences in morphology between hybrid offspring and parents mainly arise from the genetic diversity of the parents and the recombination of parental genetic material during meiosis [42]. Studies on hybrid identification based on phenotype are widespread in aquaculture, but the effectiveness of identification varies among different species. For example, Lewis [43] attempted to differentiate between the hybrid offspring of Alabama bass (Micropterus henshalli) and redeye bass (Micropterus coosae) as well as some other black bass species based on morphology, achieving an identification accuracy of only 11%. However, in Gu’s [44] study, the hybrid F1 generation of Schizothorax wangchiachii ×♀ ×Percocypris pingi ♂ exhibited significant morphological differences from the parents, and morphological indicators could be used to differentiate between the hybrid offspring and parents.
In this study, the results of cluster analysis, NMDS analysis, and PCA all indicated that the morphology of the HJ population is more similar to the maternal JP population and significantly different from the paternal HS population. This result was similar to that of He [45], who found that in hybrid fish, females can provide more genetic material than males, whether in nuclear genes or mitochondrial genes [44]. Through stepwise discriminant analysis, we extracted the three variables with the largest contributions to construct a discriminant function. According to the discriminant results, the morphology of the HJ population was intermediate between that of the HS and JP populations. Although a few individuals from the JP and HJ populations were misclassified, the majority of the HJ population could be distinguished from the HS and JP populations. This has certain implications for future hybrid identification.
Genetic diversity is an important component of biodiversity and a crucial indicator of species or population adaptability to their environment. Species or populations with higher genetic diversity are better able to adapt to environmental changes [46]. Genetic heterozygosity is a key indicator of population genetic diversity, with higher levels reflecting greater genetic variation. This study shows that the observed and expected heterozygosity, nucleotide polymorphism, and allele count are the highest in the HS population, indicating it has the greatest genetic diversity. The HJ population demonstrates moderate diversity, while the JP population shows the lowest diversity, likely due to prolonged artificial selection [10]. The genetic difference between the HS and JP populations is significant, but the difference between the HJ and JP populations is smaller. The hybrid offspring exhibit genetic characteristics that are highly biased toward the JP population. Within a certain genetic distance range, greater genetic divergence often increases the likelihood of heterosis expression [47]. It is hypothesized that the HJ population may exhibit heterosis, with certain traits tending to express the advantageous genotypes of the JP population. This dominance effect might cause the offspring to be more similar to the JP population at certain genetic loci [48]. Additionally, the JP population has low genetic diversity, and the relative genetic homogeneity of its genomic characteristics reduces the genetic distance between the JP and HJ populations [49].
Based on the 807,626 SNP loci filtered out, PCA analysis, population genetic structure analysis, and phylogenetic tree analysis were performed on the three populations. The consistent results of the three analysis methods confirm the reliability of the conclusions. The morphological characteristics of the HJ population are also closer to those of the maternal JP population, indicating consistency between phenotype and genetic background. The HJ population is more closely related to the maternal JP population, consistent with findings in other hybrid fish species [50]. Furthermore, studies have shown that the mitochondrial genes of hybrid offspring exhibit maternal inheritance characteristics [51, 52].
The morphological characteristics of hybrid offspring often exhibit some similarity to those of the parents. Relying solely on morphology for hybrid identification can lead to misjudgments. Therefore, it is necessary to establish more accurate identification methods to improve the accuracy of identification [53]. In this study, super-GBS technology identified 807,626 genome-wide SNP markers, which were refined through fingerprinting analysis to 148 core SNPs. In previous studies, SNP markers have not been used to investigate the genetic relationship between hybrid P. sinensis and their parental populations. The number and density of markers used in this study provide a very high genetic resolution, which is sufficient for conducting a comprehensive analysis of population genetic relationships. Of these, 20 were selected for genotype verification, and one SNP effectively distinguished the HS population from the HJ and JP populations. However, no SNPs were found to differentiate HJ and JP, likely due to limited sample size, minimal genetic variation, and partial genome coverage from reduced representation sequencing, which may miss distinguishing SNPs in highly similar genomic regions [48].
5. Conclusions
This study assessed seven morphological traits of three Chinese soft-shell turtle populations. Cluster, NMDS, and PCA analyses revealed that the HJ population’s morphology closely resembles the maternal JP population. A discriminant function based on three key traits achieved an 86.4% cross-validated accuracy, aiding in hybrid identification.
Using super-GBS sequencing on 10 HJ samples, compared with previous HS and JP data, 807,626 SNP markers were identified. Genetic diversity and structure analyses showed HJ is closely related to JP but distant from HS.
Fingerprinting analysis with the SNP loci resulted in 148 core markers distinguishing the populations, with one marker uniquely identifying the HS population. These findings support hybrid breeding and germplasm identification in P. sinensis.
Ethics Statement
Animal experiments complied with the regulations of the Animal Care and Use Committee of the College of Fisheries, Hunan Agricultural University (Changsha, China; Approval Number: 20220122; Approval Date: January 1, 2022).
Conflicts of Interest
The authors declare no conflicts of interest.
Author Contributions
Conceived and designed the experiments: Xiaoqing Wang, Pei Wang, Qin, Qin, and Shuting Xiong. Performed the experiments and manuscript preparation: Yixin Liang and Yazhou Hu. Analyzed the data: Hewei Xiao, Changqing Huang, and Lizhong Jin. Contributed reagents/materials/analysis tools: Fanjian Meng. All authors agree to be accountable for the research presented, no further changes to authorship will be possible after this point. No person or third-party service participated in the writing of the manuscript without being listed as an author.
Funding
This research was supported by the Aquatic Seed Industry Innovation Project of Hunan Province.
Acknowledgments
This research was supported by the Aquatic Seed Industry Innovation Project of Hunan Province. The authors used ChatGPT software to polish the English writing of the manuscript.
Supporting Information
Additional supporting information can be found online in the Supporting Information section.
Open Research
Data Availability Statement
The data that support the findings of this study are openly available in NCBI at https://www.ncbi.nlm.nih.gov/sra/PRJNA1053618, reference number PRJNA1053618, and https://www.ncbi.nlm.nih.gov/sra/PRJNA1112582, reference number PRJNA1112582. Go to the webpage https://ftp.ncbi.nlm.nih.gov/genomes/all/GCF/000/230/535/GCF_000230535.1_PelSin_1.0/, and then select and download the GCF_000230535.1_PelSin_1.0_genomic.fna.gz compressed file.


