Exploring the Potential of Microalgae Cocultivation on Bacterial Community Dynamics in a Nile Tilapia and Garlic Aquaponic System
Abstract
The cocultivation of microalgae in aquaponic systems can improve nutrient removal and enhance water quality. Moreover, it can promote the biological and physicochemical balance in aquaponic ecosystems. However, the bacterial communities in aquaponic systems have not yet been comprehensively characterized and the effects of microalgae cocultivation remain unclear. Using 16S rRNA gene sequencing, we sought to elucidate the effects of a cocultivation of Chlorella vulgaris, Scenedesmus species, and Spirulina platensis cocultivation on the bacterial communities in the rearing tanks and the biofilter of a garlic (Allium sativum L.) and Nile tilapia (Oreochromis niloticus L.) aquaponic system during a 56-days experiment. Feed intake, weight gain, and survival rates of Nile tilapia significantly improved in experimental groups cocultivated with microalgae compared to the control group, while garlic plant biomass, leaf number, and shoot length were not significantly different from the control. Alpha-diversity analysis revealed significantly higher richness and evenness in the bacterial communities from the biofilter and rearing tanks of the cocultivated systems when compared with the control system. The cocultivation also had a statistically significant effect on the bacterial composition: nonmetric multidimensional scaling analysis of a Bray–Curtis dissimilarity matrix demonstrated unique clustering patterns, indicating distinct bacterial communities in the biofilter and rearing tank water cocultivated with microalgal strains. We found significantly decreased abundances of the potentially pathogenic bacterial genera Janthinobacterium, Aeromonas, Pseudomonas, and Flavobacterium in aquaponic systems cocultivated with microalgae when compared to the control. Furthermore, the beneficial bacterial genera Fusibacter, Geothrix, Thiobaca, and Treponema were significantly enriched in the microalgae cocultivated systems. The results clearly demonstrate that integrating microalgae into an aquaponic recirculating aquaculture system (RAS), not only improves weight gain and survival rates of Nile tilapia, but also enriches beneficial bacterial genera and reduces potentially pathogenic microorganisms, offering a promising strategy to reduce antibiotic use and enhance water quality in aquaponics, without growth impairments of cocultivated plants.
1. Introduction
In open fish farming, such as flow-through, pond, and net-cage culture systems, large amounts of aquaculture effluents and wastewater discharge could be released into the environment [1, 2]. This results in great environmental challenges, such as eutrophication of surrounding habitats, pollution, and adverse health implications for wild species. Depending on the feed types and quantities, the effluents are often rich in nitrogen- and phosphate-based pollutants [1, 3, 4]. Traditionally, several physical, chemical, and biological methods have been applied for wastewater treatment in aquaculture [1, 5, 6]. However, aquaponics has recently drawn attention due to its capability for nutrient recycling from aquaculture wastewater via plant growth. An aquaponic system represents a combination of a recirculating aquaculture system (RAS) for the production of fish and a hydroponic system for the production of vegetables or plants [7, 8]. In an aquaponic system, the wastewater from the aquaculture unit is used by the plants grown in the hydroponic unit, and eventually, the purified wastewater is recycled back through the aquaculture unit.
Nile tilapia exhibit remarkable adaptability and physiological robustness, enabling their widespread success in aquaculture systems characterized by diverse environmental conditions worldwide [7, 8]. Moreover, Nile tilapia was considered a suitable fish candidate in this study due to the ability to thrive in various climatic and ecological regions, along with garlic (Allium sativum L.) as an aquaponic plant. Garlic is a vegetable and medicinal plant that is widely used for its culinary and health benefits. It possesses versatile properties, such as antimicrobial, antioxidant, and anti-inflammatory effects. A study conducted by Ding et al. [9] reported that garlic intercropping with vegetables has shown a significant improvement in plant protection, with strong inhibition effects against various plant diseases in hydroponic systems. A study conducted by Naznin et al. [10] in Japan revealed that the coculture of garlic plants and tilapia in an aquaponic setup resulted in the improved growth rate and enhanced production performance of both the tilapia and the garlic plants. In addition, the integration of garlic has been shown to provide several benefits in terms of fish health and welfare in aquaculture [10], as well as improved garlic plant growth in hydroponic cultures [11].
Microalgal cocultivation in aquaponic water has been demonstrated to improve the physicochemical parameters of fish tank water [12, 13]. More specifically, the accumulated nutrients from the fish wastes are utilized to grow microalgae and aquaponic plants. Thus, microalgae-based wastewater treatment is beneficial because microalgae utilize the nutrients available in the wastewater for growth and biomass production [14], supporting the tendency to establish algal–bacteria symbiotic mechanism [15]. A study conducted by Addy et al. [12] reported that cultivation of microalgae in an aquaponic system not only improves the water quality by controlling the pH decreases (associated with the nitrification processes) but also generates diurnal dissolved oxygen in the system. Another study stated that algal communities can be regarded as effective absorbers of nutrients in aquatic wastewater, whereas bacterial communities and their associates represent the main decomposers of organic matter or biodegradable substrates accumulated in aquaculture effluents [15].
The microalgae–bacteria consortium, as well as the collective attributes of microalgae and bacteria, could be utilized as a suitable filter-bed media, not only for biomass production but also for bioflocculation activities aimed at improving water quality [16]. It is believed that the extracellular polymeric substances (EPSs) released from algal cells and their interaction with potential bacterial populations could stimulate bioflocculation activity involved in waste conversion, thereby ensuring better water quality [16, 17]. However, the functions and characteristics of microbial aggregation in aquaculture sludge are not yet fully understood. The microbial interactions for microalgae growth and nutrient removal from aquaculture wastewater could be essential for maintaining ecological balance, microalgal biomass accumulation, and efficiency of wastewater treatment in aquatic ecosystems.
Coculturing microalgae in aquaculture environment has been reported to enhance aquatic animal health and reduce disease risk by inhibiting key pathogenic bacteria [17–19]. We hypothesize that microalgae cocultivation changes the microbial community structure, which creates a favorable microbial environment, by lowering the abundance of pathogens and proliferating the beneficial bacteria in aquaponic systems. Understanding the role of microalgae coculture in maintaining balanced microbial communities is vital for reducing pathogenic bacteria, improving water quality, and supporting the healthy growth of fish. By using 16S rRNA gene amplicon sequencing, the present study aims to elucidate the abundance, enrichment, structure, and diversity of bacterial communities resulting from cocultivating three microalgae species (Chlorella vulgaris, Scenedesmus species, and Spirulina platensis) in a garlic and Nile tilapia aquaponic system, focusing on fish-rearing tanks and biofilters.
2. Materials and Methods
2.1. Aquaponic Setup and Sample Collection
The experimental aquaponic system consisted of 12 individual RASs, each containing a Nile tilapia (Oreochromis niloticus L.) rearing unit and a garlic (A. sativum L.) growing unit. Starter cultures of freshwater algae species were obtained from the Botanical Institute and the botanical garden of Christian-Albrechts-University (CAU) Kiel. The laboratory growth condition of microalgae strains C. vulgaris (Chl_vul), Scenedesmus species (Sce_spe), and Spirulina platensis (Spi_pla) were adapted, as outlined by Mudimu et al. [20]. The algae colonies were grown for 4 weeks under controlled laboratory conditions (25°C, 14 : 10 h light:dark cycle, at 135 μmol photons/m2/s1 of white fluorescent light) with continuous aeration at the Botanical Institute and the botanical garden, CAU Kiel. Before transferring the algae cultures to the aquaponics setup, cultures were examined for axenic condition using a Leica DFC300 FX, Leica Microsystems (Schweiz) AG, Heerbrugg. The laboratory-grown algae cells were counted using ImageJ analysis (version 1.50). An average count of 107 cells/mL of live algae was applied to each aquaponic unit of Chl_vul, Sce_spe, and Spi_pla treatment groups. No microalgae were added to the control group (No_algae). All treatments were set up in triplicates.
Each aquaponic unit consisted of a 70 L rearing tank, a mini-submersible pump (Flintronic Aquarium Pump, 200 L/H), and two oxygen stones (Ueetek Air Bubble Stone) fitted with air pumps (Fdit Aquarium Air Pump, 68 L/min). A 40 L plastic box was used as a biofilter chamber, which was embedded with a helix substrate (biocarrier, HEL-X, diameter: 12 mm, surface: 859 m2/m3, specific surface area: 704 m2/m3, density: 0.95 g, Christian Stöhr GmbH & Co. Elektro-und Kunststoffwaren KG, Marktrodach, Germany) to enable bacterial growth for ammonium degradation. In addition, each RAS included a floating plant bed made of Styrofoam (Styropor PS20 EPS DEO, Karl Bachl Kunststoffverarbeitung GmbH & Co. KG, Germany). The garlic plants were grown on plastic plant holders inserted into the fitting holes of the floating plant bed. The water recirculated at a turnover rate of 200 L/h. Fifty healthy Nile tilapia juveniles, with an average weight of 9.94 g ±0.03 were stocked in each tank, with a stocking density of 1000 juveniles/m3 or 40 kg/m3. The juvenile Nile tilapia were fed a floating commercial diet (45% CP, Aller Performa 2 mm, produced by Emsland-Aller Aqua GmbH, Germany) via an automatic feeder continuously on a 24/7 basis, at a rate of 3% of wet body weight per day. An overview of fish growth, garlic plant performance, and water quality parameters can be found in Supporting Information 1: Table S1, Supporting Information 2: Table S2, and Supporting Information 3: Table S3, respectively. At the end of the experiment, 12 water samples (250 mL) were taken from each of the 12 Nile tilapia rearing tanks, as well as 12 biofilter samples (250 mL including biocarrier) from the biofilter chambers. One tap water control sample was taken from the rearing facility. In total, 25 experimental samples were used for DNA extraction and subsequent 16S rRNA gene amplicon sequencing.
Directly after sampling, the biofilter samples were vortexed (INTLLAB VM-370 Vortex Mixer) at 2800 rpm to detach the biofilm from the biocarrier. Afterwards, the water and biofilter samples were each vacuum-filtrated (Stericup Quick Release-GP Sterile Vacuum Filtration System, Sigma–Aldrich, Germany) using 0.2 µm cellulose acetate filters (Sartorius Sterile Cellulose Acetate CA Membrane Filter 0.2 μm, Sartorius). The vacuum filtration system was washed with ethanol and nuclease-free water between samples to avoid cross-contamination. After filtration, the filters were stored in sterile tubes (Falcon 50 mL High-Clarity Conical Centrifuge Tubes) at −80°C until DNA extraction.
2.2. DNA Extraction and 16S rRNA Amplicon Sequencing
The complete filters were inserted into the 5 mL PowerWater Bead ProTubes provided with the Qiagen DNeasy PowerWater Kit, and the DNA isolation was performed using the Qiagen DNeasy PowerWater Kit according to the manufacturer’s specifications (Qiagen Catalog no. 14900-100-NF). A mock dataset and negative controls, each comprising three replicates, were analyzed to obtain any possible abundances, as outlined by the manufacturer. A one-step PCR amplification of the V3–V4 hypervariable regions of the 16S rRNA gene was then performed using the chosen primers—namely, forward 341F “CCTACGGGAGGCAGCAG” and reverse 805R “GGACTACHVGGGTWTCTAAT”—via a dual-barcoding approach [21]. Moreover, 3 µL of DNA was used for the amplification. The PCR products were verified by means of gel electrophoresis. They were then normalized using the SequalPrep Normalization Plate Kit (Thermo Fischer Scientific, Waltham, MA, USA), pooled equimolarly, and sequenced on the Illumina MiSeq v3 system with 2 × 300 bp paired-end reads (Illumina Inc., San Diego, CA, USA) according to the manufacturer’s specifications. The demultiplexing after the sequencing was based on zero mismatches in the barcode sequences. The DNA extraction, 16S rRNA amplicon sequencing, and subsequent data processing were conducted at the Institute of Clinical Molecular Biology (IKMB, Kiel University) according to the method described by Trautmann et al. [22].
2.3. Data Processing and Bioinformatics Analysis
The DADA2 workflow, as reported by Callahan et al. [23], was employed to process the dataset, resulting in abundance tables concerning the amplicon sequence variants (ASVs). Utilizing the Bayesian classifier provided by DADA2 and RDP v.16, the ASVs were assigned their taxonomic annotations, with sequences not assignable to the genus level being binned into the smallest available taxonomic classification. Next, the ASV abundance tables and taxonomic annotations were used to create a dataset, which was further processed with the phyloseq package [24]. The reads were rarefied by random subsampling up to 5900 sequences per sample. This process removed 6998 ASVs to normalize the data to a minimum read depth of 5900 [25]. All the analyses were conducted in RStudio with the help of the phyloseq package [24]. The DADA2 processing, conversion to phyloseq objects, and bioinformatics analysis were performed according to the method described by Suhr et al. [26]. The alpha-diversity metrics, including the observed features, Shannon index measure and evenness, as well as the beta diversity, were further estimated based on the ASV abundance tables and taxonomic annotations. The rarefaction curves of the treatment groups from the biofilter and tank samples were plotted using the ggrarecurve function implemented in the R package (MicrobiotaProcess) to draw the rare curve for the richness comparison based on the observed diversity index.
2.4. Statistical Tests
All the statistical evaluations were performed and the graphics were developed using RStudio statistical software (version 4.1.3; R Studio) and various R packages. The statistical analyses are based on appropriate mixed models. In order to compare the different treatments, an analysis of variance (ANOVA) or a Kruskal–Wallis test was used, followed by Welch’s t-tests or Tukey tests, respectively. A difference was considered significant based on a probability level of p < 0.05. The Shapiro–Wilk test was used to verify the normal distribution of the alpha-diversity estimates prior to testing the differences between the groups. When the data were normally distributed, the alpha-diversity metrics were analyzed using a one-way ANOVA. The alpha-diversity indices included the observed ASVs and the Shannon–Wiener index. The beta-diversity comparisons were calculated using the Bray–Curtis pairwise distances in the vegan [27] and phyloseq packages and then visualized using nonmetric multidimensional scaling (NMDS). A nonparametric permutational multivariate analysis of variance (PERMANOVA) based on the Bray–Curtis distance matrix was performed on the treatment groups to test if the sample types or treatment groups differed statistically from each other, followed by pairwise comparisons using the pairwise.adonis function from the vegan package with 999 permutations. Next, the analysis proceeded with the Bray–Curtis distance matrix between treatment group members and the group centroid using the multivariate homogeneity of the group dispersions (betadisper, vegan). The statistical significance of the differences in the mean dispersions between the treatments was determined using the Kruskal–Wallis test.
To compare the relative abundance of taxa between the different treatment groups, the Kruskal–Wallis test and the associated post hoc analyses were performed. The linear discriminant analysis (LDA) of the effect size (LEfSe) was estimated to identify the bacteria that contributed the most to the differences in the communities. This was accomplished by performing LDA scoring to estimate the effect size (threshold ≥ 5) via cumulative sum scaling with the R package microbiomeMarker [28].
3. Results
3.1. Bacterial Alpha-Diversity Analysis
To characterize the bacterial diversity in the water samples from the different rearing tanks and associated biofilters, the alpha-diversity metrics (observed ASVs and Shannon indices) were calculated, as depicted in Figure 1. The alpha-diversity parameters were tested with a two-way ANOVA on the biofilter and tank samples separately, followed by post hoc pairwise comparisons of the treatment groups after significant effects were observed.
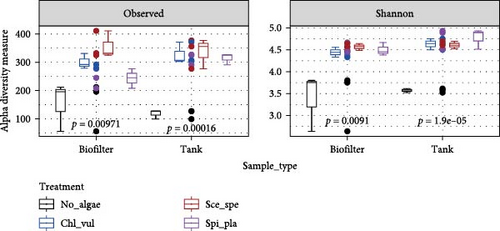
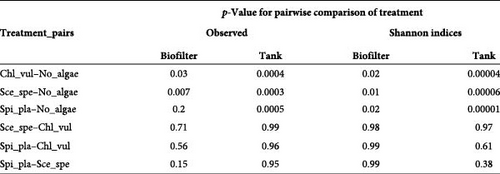
In the biofilter samples, we observed a significant increase in richness (p < 0.01) and in evenness (p < 0.01) in the microalgae-containing treatments (Chl_vul, Sce_spe, and Spi_pla) when compared to the control (No_algae) (Figure 1A). Pairwise comparisons (Figure 1B) among treatment groups revealed significant differences of observed ASVs between the No_algae control and Chl_vul (p = 0.03), as well as Sce_spe (p = 0.007). Interestingly, neither Shannon indices, nor observed ASVs significantly differed among the three microalgae treatments Sce_spe, Chl_vul, and Spi_pla in the biofilter group. Accordingly, observed ASVs in the tank samples significantly increased (p < 0.001) for the Chl_vul, Sce_spe, and Spi_pla treatments when compared with the control (No_algae). Evaluation of Shannon indices revealed a significant increase (p < 0.01) in the evenness of the bacterial populations in the Chl_vul, Sce_spe, and Spi_pla treatments when compared with the control (No_algae). Similar to the biofilter samples, we found no significant differences of observed ASVs and Shannon indices in the tank samples among the three microalgae treatments Sce_spe, Chl_vul, and Spi_pla. The individual treatment groups were tested separately for significance in relation to the biofilter and tank sample types as the main factors and together as interaction factors, and no statistically significant differences were observed.
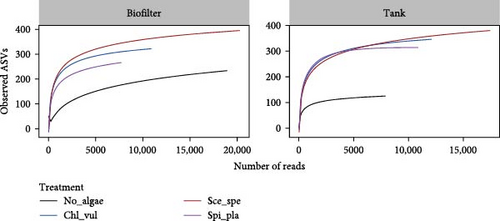
Taxonomic richness in biofilter and tank samples are depicted as rarefaction curves in Figure 1C. The rarefaction curves based on observed ASVs were drawn at a maximum depth of ~15,000 and 20,000 sequences per sample in the tank and biofilter samples, respectively. Despite the key diversity-related differences, the alpha-diversity measure did not significantly differ in terms of species richness or phylogenetic diversity among the biofilter and tank samples. The metric analyses provided similar results, revealing that the Sce_spe had the highest alpha diversity, as also suggested by the rarefaction curve, followed by the Chl_vul and Spi_pla, both of which had similar alpha diversity, while the No_algae bacterial diversity showed the lowest alpha diversity.
3.2. Variation in Bacterial Community Composition Across Treatments
The Bray–Curtis dissimilarity matrices were used to compare differences in bacterial compositions between treatments and sample types. Moreover, NMDS based on Bray–Curtis dissimilarities was used for graphical analysis. All microalgae cocultivated treatments clustered separately from the control group (Figure 2A). Additionally, the cocultivation of different microalgae led to the establishment of significantly distinct bacterial community compositions (p < 0.05), as revealed by PERMANOVA. In accordance with the overall effect, the pairwise comparisons confirmed a significant difference (p < 0.05) in the bacterial communities between the four different treatments (Figure 2B). Furthermore, high variation according to the beta-dispersion analysis was observed in the control group, where the individual bacterial diversity appeared to be more widely distributed (Figure 2C).
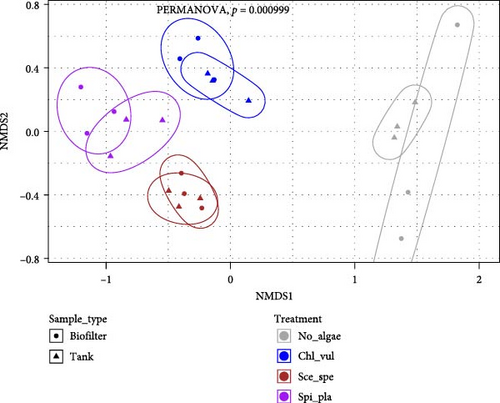
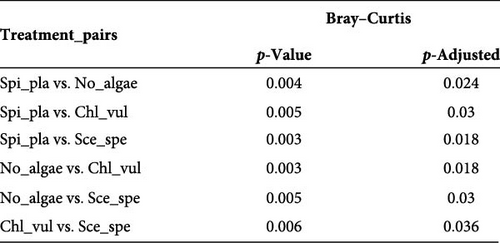
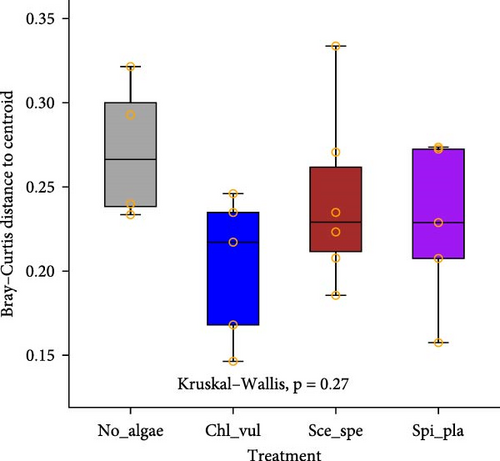
The results of the pairwise comparisons revealed that the treatments clustered significantly in distinct groups (p < 0.05). But the sample types, that is, the biofilter and tank samples were not significantly different (p > 0.05). The test for the homogeneity of the multivariate dispersions among the treatment groups using the Betadisper function found no significant differences in the variance homogeneity between the treatments (p = 0.27). The distance to the treatment group centroid measures showed that the samples harbored homogenous microbial communities.
3.3. Taxa Composition and Community Assembly by Heatmap
To explore the taxonomical composition of the bacterial communities, a heatmap was generated based on the Bray–Curtis dissimilarity matrix showing the abundance of bacteria at the phylum level (Figure 3).
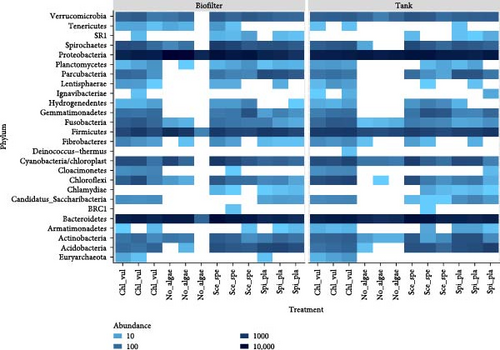
The heatmap showed variations in 26 bacterial phyla associated with treatment groups Chl_vul, Sce_spe, and Spi_pla, compared to the control (No_algae). It also demonstrated changes in abundance and distribution in response to different sample types and the treatments.
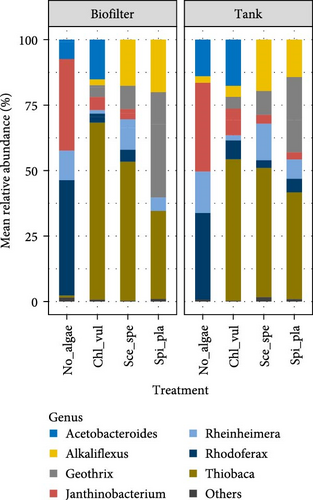
The bacterial community composition based on the relative abundance at the order and genus levels in the No_algae, Chl_vul, Sce_spe, and Spi_pla treatment groups were obtained in the biofilter and tank samples, as depicted in Figure 4. The taxa that account for at least 0.5% are included and the taxa that account for <0.5% are grouped into “Others.”
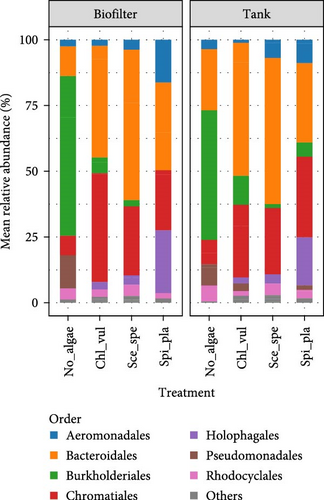
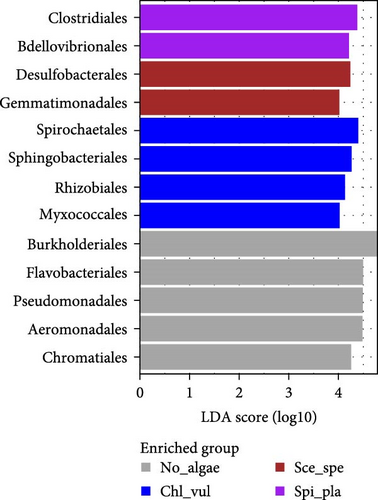
In this study, Burkholderiales, Bacteroidales, and Chromatiales were the three most abundant orders observed in the No_algae, Chl_vul, Sce_spe, and Spi_pla samples. However, an additional observation via LEfSe analysis showed that bacteria from the order Burkholderiales were the most abundant in the control treatment (No_algae), followed by Flavobacteriales, Aeromonadales, Pseudomonadales, Chromatiales, and Alteromonadales. In the Chl_vul treatment, Spirochaetales, Sphingobacteriales, Rhizobiales, and Myxococcales were the most differentially enriched orders. By contrast, Desulfobacterales and Gemmatimonadales were the most enriched orders in the Sce_spe treatment, while Clostridiales and Bdellovibrionales exhibited the highest degree of consistent differences in the relative abundance of the bacterial orders present in the Spi_pla treatment.
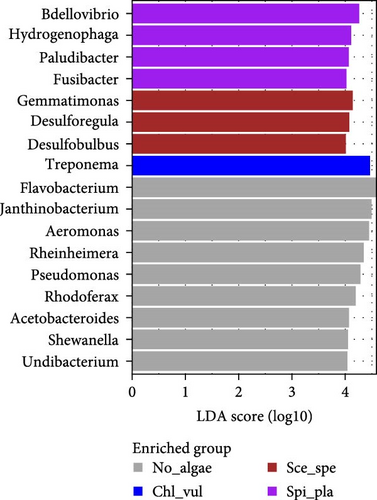
When visualizing the differences in the mean relative abundance, the LEfSe analysis of the enriched bacterial genera was characterized by nine genera in the No_algae group. More specifically, the LEfSe analysis confirmed that Flavobacterium, Janthinobacterium, Aeromonas, Rheinheimera, Pseudomonas, Rhodoferax, Acetobacteroides, Shewanella, and Undibacterium were significantly enriched in the No_algae group. The genus Treponema was the only bacterial genus enriched in the Chl_vul group. In the Sce_spe group, three genera—namely, Gemmatimonas, Desulforegula, and Desulfobulbus—were differentially enriched. However, the Bdellovibrio, Hydrogenophaga, Paludibacter, and Fusibacter genera were significantly enriched in the Spi_pla group.
The relative abundance of seven selected genera (Fusibacter, Alkaliflexus, Gemmatimonas, Geothrix, Janthinobacterium, Thiobaca, and Treponema) shared by all treatment groups is shown in Figure 5. Previous studies claimed that these bacterial genera were either associated with pathogenicity or nonpathogenic (or even beneficial) nature in the aquaculture environment [17–19].
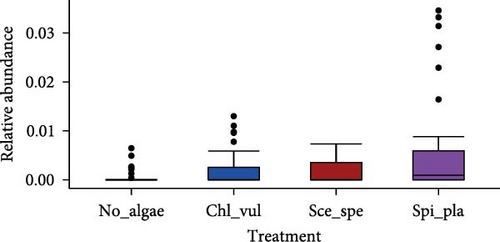
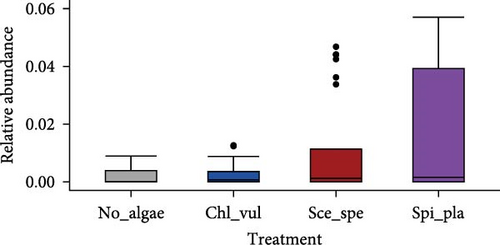
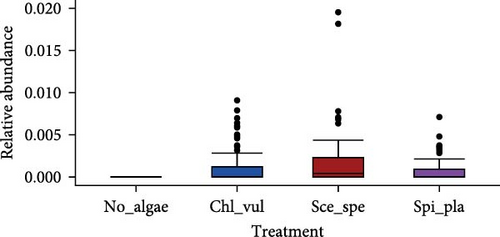
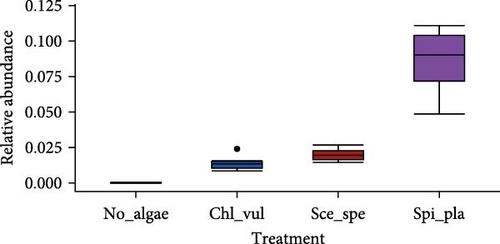
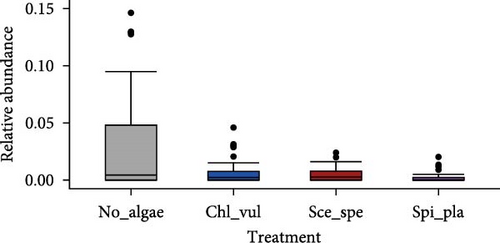
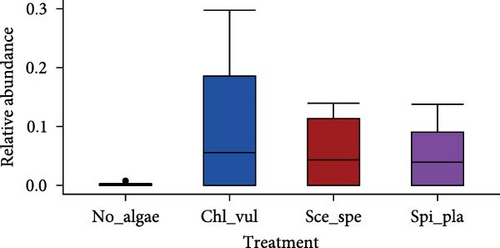
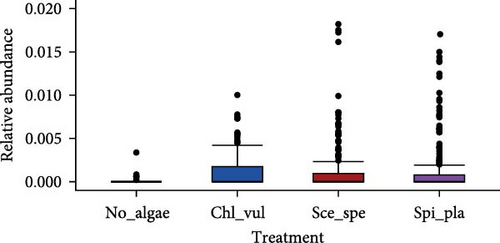
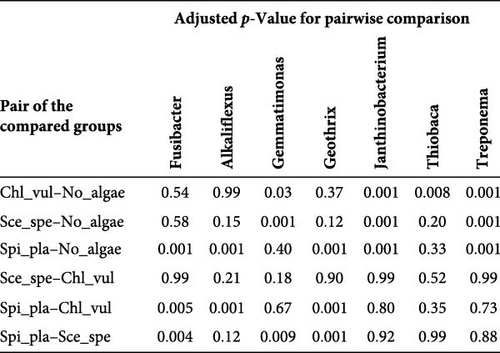
The relative abundance of the genera Fusibacter, Alkaliflexus, Gemmatimonas, Geothrix, Janthinobacterium, Thiobaca, and Treponema was significantly different (p < 0.05) in at least one treatment group comparison of No_algae, Chl_vul, Sce_spe, and Spi_pla samples. However, substantial differences in the mean relative bacterial abundances of the genera due to the microalgae species were observed (Figure 5).
The relative abundance of Fusibacter was significantly increased in the Spirulina platensis treatment in comparison to the other microalgae groups (Scenedesmus species, p = 0.004; C. vulgaris, p = 0.005) and the control (p = 0.001). However, no differences were found between the other treatments. The relative abundance of the genus Alkaliflexus was likewise significantly increased in the Spi_pla treatment, but only when compared to the control group (p = 0.001) and the C. vulgaris treatment (p = 0.001). The relative abundance of the genus Gemmatimonas revealed a distinct increase in the Sce_spe and Chl_vul samples when compared with the No_algae sample. Statistically significant differences were found in the comparisons between Chl_vul and No_algae (p = 0.03), Sce_spe and No_algae (p = 0.001), and Spi_pla and Sce_spe (p = 0.009). In contrast, the treatment group comparisons of Spi_pla–No_algae (p = 0.40), Sce_spe–Chl_vul (p = 0.67), and Spi_pla–Chl_pla (p = 0.80) did not reveal any statistically significant differences in the abundances of the genus Gemmatimonas. Further, the relative abundance of the genus Geothrix was significantly increased in samples from the Spirulina platensis treatment in comparison to the control (p = 0.001) and the other two microalgae treatments (Chl_vul and Sce_spe; each p = 0.001). The control group, when compared with the three microalgae treatment groups, exhibited a significant increase (p = 0.001) in the relative abundance of the genus Janthinobacterium. However, no significant differences were observed in the comparisons between Sce_spe–Chl_vul (p = 0.99), Spi_pla–Chl_vul (p = 0.80), and Spi_pla–Sce_spe (p = 0.92). The assessment of the relative abundance of the genus Thiobaca revealed a significant increase in the comparison between Chl_vul and No_algae (p = 0.008). No significant differences were found in the relative abundance of the genus Thiobaca between the Sce_spe–No_algae (p = 0.20), Spi_pla–No_algae (p = 0.33), Sce_spe–Chl_vul (p = 0.52), Spi_pla–Chl_pla (p = 0.35), and Spi_pla–Sce_spe (p = 0.99) comparisons. An evaluation of the relative abundance of the genus Treponema revealed a significant increase in the Chl_vul, Sce_spe, and Spi_pla samples when compared with the No_algae samples (p = 0.001), while no significant differences in the relative abundance of the genus Treponema were found among the three microalgae treatment groups.
4. Discussion
The present study evaluated the effects of cocultivating a garlic and Nile tilapia aquaponic system with three different microalgae species (Chlorella vulgaris [Chl_vul], Scenedesmus species [Sce_spe], and Spirulina platensis [Spi_pla]) on bacterial diversity and community structure in the rearing tanks and biofilter units of recirculating aquaponic systems. Feed intake, weight gain, and survival rates of Nile tilapia significantly improved in experimental groups cocultivated with microalgae compared to the control group, while garlic plant biomass, leaf number, and shoot length were not significantly different from the control (Supporting Information 1: Table S1 and Supporting Information 2: Table S2). Growth performance of Nile tilapia and garlic plants during the 56 days lasting experiment was comparable to previous studies [10, 12, 13]. Key water quality parameters (Supporting Information 3: Table S3), including dissolved oxygen, water temperature, pH level, and Chlorophyll-a, demonstrated an ideal aquaponics environmental condition [10, 12, 13]. Similarly, parameters for ammonia nitrogen, nitrite nitrogen, nitrate nitrogen, total nitrogen (TN), and total phosphorus (TP) were also within optimal and standard ranges for tilapia, as mentioned previously [10, 12, 13, 16, 17].
4.1. Microalgae Cocultivation Increases Bacterial Diversity
Bacterial richness and evenness in tank and biofilter samples from the microalgal cocultivated RAS units were significantly increased compared to the control group. From rarefaction curve analyses, we also concluded that the bacterial community in samples from all treatments was well represented. Although we found higher bacterial richness and evenness in the microalgae treatments compared to the control, no statistically significant differences in alpha diversity were observed between the three microalgae treatment groups (Figure 1B). More specifically, biofilters and rearing tanks from aquaponic systems cocultivated with Scenedesmus species exhibited the highest number of observed ASVs on average, while samples from RAS units without microalgae cocultivation had the lowest number of observed ASVs. The increased bacterial diversity in the microalgae cocultivated aquaponic systems represents clear evidence of an interdependent or positive relationship between the microalgae and bacteria. The cocultivation seems to encourage a typical mutualistic interaction between the microalgae and bacteria [29, 30]. The microalgae are assumed to contribute to nutrient cycling and eventually provide a habitat for the microbial communities, which potentially influences the overall bacterial diversity in the aquatic system [15, 31, 32]. Previous studies have shown that microalgae species and bacterial coculture can only benefit from the symbiotic relationship between the microalgae and bacteria [15, 33, 34].
Microalgae host-specific bacterial populations are frequently associated with the microalgae strains. Several studies have highlighted the increased bacterial richness in microalgal cultures of C. vulgaris to play a dominant role in the removal of nitrogen and phosphorus [34–36], and they have demonstrated the stable associations of C. vulgaris with specific bacterial species, such as the presence of Flavobacterium sp., Terrimonas sp., Sphingobacterium sp., Rhizobium sp., and Hyphomonas sp. [36]. Several interactions between microalgae species and bacterial taxa for the purpose of mutualism, parasitism, predation, or competition have been revealed in various environmental scenarios, which demonstrated that the bacterial populations were highly diverse and could be influenced by environmental conditions such as the temperature, nutrient availability, fish stocking density, and pH [37–39].
When comparing the biofilter with tank samples, our study found no significant differences in the evenness and richness of either bacterial community, indicating similar effects in both RAS compartments. The biofilter in an aquaponic system can influence the microbial richness, as the biofilter harbors more diverse bacterial communities than the corresponding tank or sump [39–41]. The biofilter provides a medium for microbial attachment, forming also an algal biofilm that integrates aerobic and anaerobic microbial processes to internally treat water contaminated by both, dissolved organics and ammonia [41–43]. Algal–bacteria interactions in this so-called “phycosphere” promote functional microbial communities [29, 31, 33], with species-specific bacterial diversity influenced by microalgal species and their physiological stages, aiding water quality regulation in aquatic environments [44–46].
4.2. Bacterial Community Structure Depends on the Microalgae Species
Despite having the same enhancing effects on bacterial richness and evenness, the bacterial community structures were significantly different between each of the microalgae treatments. Beta-diversity analysis revealed a microalgae species-specific selection of the bacterial community, as well as for the control. The clustering pattern observed in the NMDS analysis implies that the microalgae can exert species-specific associations and have a strong influence on the phycosphere dynamics of bacterial communities, as suggested in previous studies [29, 31, 34, 35]. Our findings could be explained by the production and/or secretion of specific organic or inorganic compounds by individual microalgal strains, which can be metabolized by certain bacterial taxa, thereby promoting their growth. Prior studies have shown that microalgae cocultivation can significantly regulate the spatial variation in bacterial assemblages associated with a particular microbial habitat for growing on a microalgae strain [35, 45], with the influence of characteristic properties due to nutritional and environmental factors [37, 47], or even with an opportunistic symbiotic relationship or mutualism with microalgae [15, 48]. Therefore, the biotic microenvironments on the microalgal surface are an inherent part of the bacteria in nature [37, 49]. The observed microalgae species-specific bacterial community structure might be explained by an association between specific bacteria and distinct microalgae, thereby influencing nutrient availability, conferring defense mechanisms against competitors, or providing protective functions in aquatic environments [34, 35, 49]. Complex interactions in aquaponics systems contribute to variations in bacterial beta diversity, with key determinants not yet fully understood [48, 50, 51]. In our system, microalgae cocultivated treatments showed significantly higher bacterial beta diversity dissimilarity compared to the control. The specific factors driving these variations, however, remain unclear.
In our aquaponic system, heterotrophic Proteobacteria, Bacteroidetes, and Firmicutes were the main bacterial phyla, which were aligned with previous investigations [30, 31, 52, 53]. The phyla Proteobacteria and Bacteroidetes are primarily responsible for nitrogen cycling in aquaponic systems [39, 52]. These studies reported that Proteobacteria and Bacteroidetes rapidly respond to carbon sources and can be considered both fast-growing bacteria and dominant representatives in various aquaponics systems with varying relative abundances. The diverse bacteria within the Proteobacteria typically belong to nitrifying and denitrifying genera [41, 53–55]. For instance, Kersters et al. [55] found that members of the phylum Proteobacteria consist of a diverse group of bacteria that are important players in nutrient recycling and the remineralization of organic matter in a functional microbiota under the influence of nitrifying and denitrifying genera [41, 55–57]. Members of the phylum Firmicutes include metabolically versatile species that reoccur in the nitrifying biofilters of marine aquaculture systems. Previous studies have also confirmed that these taxa are not only limited to the biofilters but are found in all compartments of RASs [41, 53, 58].
Both Bacteroidetes and Proteobacteria have been defined as beneficial microbial indicators of the proper health status of a RAS, as well as essential phyla for the optimal functioning of aquaponics systems [40, 59, 60]. They revealed that Bacteroidetes convert nitrate into various nitrogen compounds and are essential for degrading complex organic matter, including proteins, carbohydrates, and pollutants, significantly impacting host metabolism. They also promote polymer degradation in biofilms, maintain aerobic conditions, and specialize in organic matter processing to aid in aquaponic environment [52, 56]. However, currently, only a very limited understanding exists in this regard [39, 40, 43, 60]. The relative abundance of the order Bacteroidales was higher in the Chl_vul, Sce_spe, and Spi_pla samples than in the control treatment (No_algae). By contrast, Burkholderiales were more abundant in the control treatment (No_algae) than in the Chl_vul, Sce_spe, and Spi_pla samples. Previously, Burkholderiales were also observed in aquaponics potentially associating with plant roots [39]. The members of order Bacteroidales, known for degrading complex polymers and plant polysaccharides, play a key role in nutrient recycling by breaking down microalgal-derived organic matter [56]. In aquaponic systems, this function may enhance biological filtration and nutrient mineralization, promoting optimal plant growth [40, 61].
4.3. Suppression of Key Pathogenic Bacterial Genera Is Associated With Microalgal Cocultivation
Significant differences in LDA scores were observed in LEfSe analysis at order and genus levels for several distinct taxa between treatments, identifying potential biomarkers [27, 28]. Bacteria from the orders Burkholderiales, Flavobacteriales, Pseudomonadales, Aeromonadales, Chromatiales, and Alteromonadales were identified as dominant in the control treatment (No_algae) in LEfSe analysis. In the Chl_vul treatment, Spirochaetales, Sphingobacteriales, Rhizobiales, and Myxococcales were the most differentially enriched orders, and Desulfobacterales and Gemmatimonadales were the most enriched orders in the Sce_spe treatment. Clostridiales and Bdellovibrionales exhibited the most pronounced differential enrichment in the Spi_pla treatment. The abundance of the genera Flavobacterium, Janthinobacterium, Aeromonas, Rheinheimera, Pseudomonas, Rhodoferax, Acetobacteroides, Shewanella, and Undibacterium was significantly increased in the control treatment. These findings align with previous studies performed without microalgal cocultivation, which identified Flavobacterium, Aeromonas, Pseudomonas, Rhizobium, Sphingobacterium, Comamonas, and Acinetobacter as common bacteria in RASs and aquaponic systems [58]. Some of these bacterial genera, such as Flavobacterium, Pseudomonas, Achromobacter, Aerobacter, Acinetobacter, Bacillus, Brevibacterium, Proteus, and Micrococcus sp., have been found to participate in denitrification processes [40, 41, 61, 62]. Despite their positive role in the denitrification process in the aquaculture context, some opportunistic pathogens within the genera Aeromonas, Pseudomonas, Flavobacterium, and Acinetobacter have been linked to fish pathogenicity [41, 63], emphasizing the importance of both biosafety measures and effective control strategies. Indeed, the pathogenicity of certain bacterial genera, including Janthinobacterium [64, 65], Pseudomonas [39, 66, 67], Flavobacterium [68], and Aeromonas [69, 70] has been observed in a wide range of freshwater fish species, including Nile tilapia (O. niloticus) and rainbow trout (Oncorhynchus mykiss), where it has led to increased fish mortality rates and economic losses due to the infections [64, 66–70]. Due to the characteristics of being highly opportunistic and fatal to aquatic animals, the need for pathogen suppression has been argued [32, 67, 69–71]. Aeromonas, Flavobacterium, Pseudomonas, and Janthinobacterium have all historically been associated with negative economic and ecological effects, but our experiment demonstrates the potential of avoiding these impairments by cocultivating microalgae species. In our study, the relative abundances of the genera Flavobacterium, Janthinobacterium, Aeromonas, and Pseudomonas were either significantly low or nonexistent in the microalgae cocultivated samples of Chl_vul, Sce_spe, and Spi_pla when compared with the control. Furthermore, even though we did not observe signs of infection, fish from the Spirulina platensis treatment had significantly reduced mortalities than fish from the control group, supporting our conclusion that microalgae cocultivation can suppress potential pathogenic bacteria. Treponema was the bacterial genus significantly enriched in the Chl_vul group, the genera Gemmatimonas, Desulforegula, and Desulfobulbus in the Sce_spe group, and the genera Bdellovibrio, Hydrogenophaga, Paludibacter, and Fusibacter were significantly enriched in the Spi_pla group.
Previous studies revealed that C. vulgaris exhibits an enhanced ability to either eliminate or reduce the pathogenic bacterium Vibrio sp. [71]. Chlorella sp. have been identified as producers of a potent antibacterial compound known as “Chlorellin” [72, 73]. Such bioactive compounds are assumed to exhibit robust antibacterial properties, which could serve as an effective defense mechanism against pathogenic bacteria [31, 71–73].
Further, the antimicrobial compound “phycocyanin” produced by Spirulina platensis was found to suppress various pathogens [74]. They observed a fragmentation of Aeromonas hydrophila cell wall leading to the permeabilization and collapse of bacteria cells after 2 h of Spirulina application. Another study found a significant reduction in mortality caused by A. hydrophila in Nile tilapia due to an increased dietary supplementation of S. platensis [75]. In addition, S. platensis supplementation was found to enhance the immune response in Nile tilapia [69, 75], and Watanuki et al. [76] observed a decrease in A. hydrophila in common carp due to a dietary supplementation of S. platensis. Incorporation of a microalgae mix containing Nannochloropsis oculata, Schizochytrium sp., and Spirulina sp. in the diet of Nile tilapia resulted furthermore in a reduction of A. hydrophila, Vibrio, and Staphylococcus species and an increase in the activities of antioxidant enzymes [77]. These findings indicate the potential of S. platensis also as a beneficial dietary supplement in aquaculture, which could contribute to enhanced fish health and mitigation of the impact of bacterial pathogens.
4.4. Enrichment of Key Beneficial Bacteria Might Enhance Water Purification and Nutrient Recycling in Aquaponic Systems
In comparison to the control, the genera Fusibacter, Alkaliflexus, and Geothrix were significantly enriched in the Spi_pla treatment, Thiobaca in the Chl_vul treatment and Gemmatimonas in both, the Sce_spe and Chl_vul treatments. The genus Thiobaca comprises anoxygenic phototrophic organisms within the Chromatiaceae, as characterized by purple sulfur bacteria [78]. Previous studies indicated that purple sulfur bacteria can be considered key players in the biological sulfur cycle, fulfilling multiple beneficial functions in terms of sulfur-related metabolic processes and the reductive assimilation processes of photosynthesis [78]. Some studies [79, 80] suggested that the iron-reducing bacterial genus Geothrix plays a significant role in oxidizing organic compounds with the reduction of Fe (III), which is capable of metal respiration using the electron acceptors Fe (III) oxide and Mn (IV) oxide and nitrate to immobilize environmentally harmful compounds. Such a phenomenon is important in aquaponic environments due to playing a vital role in the ecological niches in which they have demonstrated the ability to degrade toxic wastes. The bacterial genus Fusibacter inhabits a broad range of aquatic systems. Fusibacter comprises thiosulfate-reducing bacteria that reduce elemental sulfur or thiosulfate to sulfide, thereby playing an important role in the biogeochemical sulfur cycle [81]. This ability with regard to thiosulfate and sulfur oxidation could have the potential to reduce the sulfur-related nutrient loads stemming from aquaponic effluents in the microalgae cocultivated samples of Chl_vul, Sce_spe, and Spi_pla. The bacterial genus Treponema consists of a diverse bacterial group ranging from opportunistic species of a pathogenic nature to symbiotic or free-living species [82]. In our experiment, the prevalence of the genus Treponema was notably higher in the Chl_vul, Sce_spe, and Spi_pla treatments when compared with the control treatment, indicating treatment-specific variations in the bacterial community abundance. Treponema has been extensively reported in ruminants due to its interaction with cellulolytic bacteria [83], and another study revealed the presence of Treponema in muddy environment [84]. However, its role in aquatic environments remains unclear. Still, previous studies of Treponema cocultures have revealed the development of pure cultures of cellulolytic organisms, signifying Treponema’s capability to engage in nutrient scavenging through fermentation processes [82–84]. These functions are of leading importance in the context of aquaponics, as they can significantly contribute to the decomposition and recycling of feed residues as well as fish feces within recirculating setups, supporting the overall ecological dynamics of the system. The capability of the bacterial genera Fusibacter, Geothrix, Thiobaca, and Treponema in terms of degradation and decomposition of the abovementioned waste intermediates in aquaponic environments is an immediate consequence of the assimilation and nutrient recycling by the cocultivated microalgae C. vulgaris, Scenedesmus sp., and Spirulina platensis used in this study. Greater knowledge and understanding of the mechanistics involved in microalgal–bacterial communication and substrate exchange could assist in constructing a symbiotic system for the microalgal strains, bacterial nutritional interactions, and possible nutrient swapping, which not only favors fish growth and health, but could also have a significant impact on the plant developmental functions and required fitness parameters [37, 40, 58, 60], making it an important consideration in relation to the potential beneficial interactions, ecological balance, and microbiological safety of aquaponics products.
Many studies have shown that the bacterial genera Fusibacter, Geothrix, Thiobaca, and Treponema exhibit significant potential in degrading and decomposing waste intermediates in aquatic environments [79, 80, 83, 84]. Their activity, coupled with the nutrient recycling capabilities of cocultivated microalgae (C. vulgaris, Scenedesmus sp., and Spirulina platensis), can facilitate efficient micro- and macronutrient exchange. This interaction minimizes the need for frequent water exchanges, promoting water conservation and fostering a balanced and resilient aquatic environment by optimizing waste management in recirculating water systems.
5. Concluding Remarks
This study investigated the effects of a microalgae cocultivation with Chlorella vulgaris, Scenedesmus sp., and Spirulina platensis on the bacterial community dynamics of the biofilter and rearing tanks in a Nile tilapia and garlic aquaponic system. We found significantly increased bacterial ASVs as well as significantly increased Shannon diversity in samples taken from RAS units cocultivated with microalgae compared to the control group, independently from the microalgae species. However, the bacterial community structure was significantly dependent on the applied microalgae species, resulting in distinct bacterial community compositions on phylum, order, and genus level. To date, only very limited research has focused on live microalgae cocultivation in aquaponics systems; however, this study revealed the strong potential of microalgae cocultivation in suppressing potentially pathogenic bacteria such as Janthinobacterium, Aeromonas, Pseudomonas, and Flavobacterium, while enhancing bacterial groups that are known for their contribution to increase waste water purification and their important role in RAS nutrient cycling, such as Fusibacter, Geothrix, Thiobaca, and Treponema. We therefore conclude that microalgae cocultivation in Nile tilapia aquaponics can have a significant impact on the health and welfare of fish by fostering the production of antimicrobial substances produced by the RAS microbial community, as well as on efficient nutrient cycling, although the precise mechanisms underlying the functional microalgae–bacteria associations require further research.
Ethics Statement
The present study was conducted in strict accordance with the ethical guidelines outlined in EU Directive 2010/63/EU for animal experiments, meaning that it adhered to the EU guidelines for the care and use of animals in scientific research. According to the German Animal Welfare Act (TierSchG) and validated by the Animal Welfare Officer of Kiel University, the experimental procedures of this study were not classified as an animal experiment and, therefore, no ethics approval was required. The collection of the Nile tilapia used in the study followed the standard ethical principles governing the treatment of animals in research, as specified in EU Directive 2010/63/EU. The fish were fed a diet appropriate to their needs and only kept for this trial to produce biomass for the aquaponic system. All the animal handling procedures accorded with the relevant institutional and national guidelines for the care and use of laboratory animals (German Animal Welfare Act; TierSchG and Regulation for the protection of animals used for experimental and other scientific purposes; and TierSchVersV as the national implementation of Directive 2010/63/EU). At the end of the trial, Nile tilapia were stunned by percussion and killed by cutting the spinal cord, in accordance with national ethical guidelines and Section 8a (1) No. 3b of the German Animal Welfare Act; §12 Ordinance on the Protection of Animals in Connection with Slaughter or Killing; and Implementation of Council Regulation (EC) No 1099/2009, Animal Protection Slaughter Ordinance. The number of animals killed at the end of the experiment was announced to the Animal Welfare Officer of Kiel University according to §4 TierSchG.
Disclosure
All authors have reviewed, discussed, and agreed to the publication of this research.
Conflicts of Interest
The authors declare no conflicts of interest.
Author Contributions
Surya Prasad Tiwari and Carsten Schulz designed the project. Surya Prasad Tiwari, Carsten Schulz, and Stéphanie Céline Hornburg were responsible for funding. Surya Prasad Tiwari performed the experiment, prepared the microbiome samples, and wrote the draft manuscript. Corinna Bang performed the DNA extraction, 16S rRNA library preparation and sequencing, and data processing. Surya Prasad Tiwari, Stéphanie Céline Hornburg, and Marvin Suhr performed the statistical analysis, data interpretation, and data curation. Surya Prasad Tiwari, Carsten Schulz, Stéphanie Céline Hornburg, and Marvin Suhr contributed to the preparation, reviewing, and editing of the manuscript. All authors have read and agreed to the final version of the manuscript.
Funding
Open access funding enabled and organized by Projekt DEAL. We acknowledge Evangelisches Studienwerk e.V. Villigst and the International Center of CAU Kiel for providing a doctoral scholarship to Surya Prasad Tiwari, which contributed to the completion of this research. Further, Stéphanie Céline Hornburg received funding from the H. Wilhelm Schaumann Stiftung for conducting the microbiome analysis. Microbiome sequencing received infrastructure support from the DFG Excellence Cluster 2167 “Precision Medicine in Chronic Inflammation” (PMI) and the DFG Research Unit 5042 “miTarget.”
Acknowledgments
We would like to express our sincere appreciation to the Fraunhofer Research Institution for Individualized and Cell-Based Medical Engineering (IMTE), Büsum, Germany, for providing the biofilter substrate and to the Botanical Institute and Botanical Gardens of CAU Kiel for providing the algae species and laboratory cultivation of the algae. We would further like to thank Michael Schlachter and Petra Rettmann of IMTE, Germany, for their laboratory support and necessary guidance, as well as the staff of the microbiome lab of the Institute of Clinical Molecular Biology (CAU Kiel), for their assistance during laboratory procedures. We would also like to thank Mario Hasler (CAU Kiel) for providing valuable advice on the statistical analysis. English Academic Editing has been performed by Scribendi Inc., during the preparation of the original manuscript. Minor corrections to the English language and grammar have been made using DeepL Write in the preparation of the revised manuscript.
Supporting Information
Additional supporting information can be found online in the Supporting Information section.
Open Research
Data Availability Statement
Raw sequencing files are available from the NCBI Sequence Read Archive (SRA) via the BioProject accession number PRJNA1114669.


