Effect of Salinity on Nursery Bi-Culture of Pacific White Leg Shrimp (Litopenaeus vannamei) and Giant Prawn (Macrobrachium rosenbergii) in a Biofloc System
Abstract
The current study was carried out to examine the effects of four different experimental salinities (T1 = 0‰, T2 = 5‰, T3 = 10‰, and T4 = 15‰) on growth, water quality, proximate composition, total bacterial (TB), and hemocyte counts of white leg shrimp (Litopenaeus vannamei) and giant prawn (Macrobrachium rosenbergii) in biofloc based nursery bi-culture system for 6 weeks. A total of 12 cylindrical plastic tanks (125 L) filled up 100 L water for rearing L. vannamei and M. rosenbergii post-larvae (PLs) at an equal ratio: (50 L. vannamei: 50 M. rosenbergii). At the end of the experiment, for L. vannamei, the significantly higher (p < 0.05) growth rate was recorded in T4 (15‰) compared to the other treatments. For M. rosenbergii, a significantly higher (p < 0.05) growth rate was recorded in T2 (5‰) than in other treatments. Similar to growth, the best (p < 0.05) feed conversion ratio (FCR) for -L. vannamei was found at T4 (15‰) while it was at T2 (5‰) forM. rosenbergii. Gross return, net profit, and benefit–cost ratio (BCR) analysis revealed higher profit T4 (15‰) than T3 (10‰), T2 (5‰), and T1 (0‰). TB counts were found to be significantly greater (p < 0.05) in T4 than other treatments. Hemocyte counts for L. vannamei were significantly higher (p < 0.05) in T4 (15‰) than T3 (10‰), T2 (5‰), and T1 (0‰) and for M. rosenbergii hemocyte was significantly higher (p < 0.05) in T1 (0‰) than T2 (5 ‰), T3 (10 ‰), and T4 (15‰). Therefore, it can be suggested that 15‰ salinity will be the best condition for the nursery bi-culture of white leg shrimp (L. vannamei) and giant prawn (M. rosenbergii) in the biofloc system.
1. Introduction
Salinity is one of the vital ecological factors affecting the growth, survival, and dispersal of many aquatic animals [1–3]. Despite many crustaceans being euryhaline [4], the ideal salinity range for optimum growth, survivability, and production competency differ among species [1, 3, 5–7]. The optimum salinity range affects not only the growth performance of a species but the entire production, biology, and well-being of that species [8]. Thus, continuous efforts are made to find out the ideal/optimum salinity range of farmed aquaculture species to maximize production performance and profit [9]. In order to meet the growing demand of increasing global populations, innovative approaches that promote resilience, increase profitability, assist conservation and environmental preservation, and enable sustainable aquaculture development must be put into practice [10].
Biofloc technology (BFT), an eco-friendly cultivation method, represents a major technological revolution in aquaculture [11, 12]. BFT reduces the environmental effect of intensive aquaculture by providing little to no water renewal [13]. Moreover, the minimum or zero water exchange in BFT [14] significantly reduces production costs and also reduces the environmental impact (minimizing the discharge/effluents). BFT involves beneficial microbes (bacteria, fungi, protozoa, and also algae, and zooplankton) in a mixture with particulate organic matter [15]. BFT enriches water quality, helps in waste management and helps to minimize disease outbreaks in the case of intensive farming systems [16]. In addition, the microorganisms used in BFT produce bacterial protein from inorganic nitrogen (that is readily utilized as food for the aquaculture species, reduces feeding costs, and lowers the carbon footprints) [17–20]. As a result, the target species grows more quickly and enhances immunity without antibiotics, which reduces the adverse effects on the environment [14, 21–24]. The successful farming with BFT relies on careful species selection, focusing on demandable species that flourish and perform well in this system.
The Pacific white-leg shrimp (Litopenaeus vannamei) is a euryhaline species, currently the highest-produced crustacean species globally (53%) [25]. Giant prawn (Macrobrachium rosenbergii) contributes only 3% to the global crustacean production but has a premium market price and consumer preference due to its larger size and delicious taste [26]. L. vannamei is an indigenous species to the western Pacific coast of Latin America, extending from Peru to Mexico [27] and Asian countries for its potential to grow at different salinity environments with higher stocking densities [28]. Although a marine species (inhabits 20−45‰ salinities), L. vannamei can tolerate salinities ranging between 0 and 60‰, and farming is currently practiced in a wide variety of salinity levels [29]. This extensive salinity tolerance ability of shrimp has attracted global shrimp farming intrapreneurs to produce this species at an industrial scale [30, 31]. On the other hand, the giant prawn (M. rosenbergii) is the most widely farmed freshwater crustacean species, contributing significantly to the global freshwater aquaculture production [32, 33]. M. rosenbergii is a freshwater species that requires brackish water (6−12‰) for larval development but can tolerate up to 20‰ salinity [34–37]. L. vannamei is a mid-layer inhabitant, while M. rosenbergii is a bottom inhabitant [29, 34]. Due to their utilization of different water layers, there is huge potential to test these two species in a bi-culture system, which has not been thoroughly investigated. Both species constitute their own special attributes as good aquaculture candidates; as such, L. vannamei and M. rosenbergii can be farmed together (bi-culture) for maximizing production and profit. In achieving this goal, optimum farming conditions must be sought out for the bi-culture of these two commercially important species.
BFT has been found to be an effective approach for intensified production of L. vannamei and M. rosenbergii production separately [13]. However, this technology can be used for the bi-culture of L. vannamei and M. rosenbergii to maximize production and profit through the efficient use of different water columns. For the successful implementation of BFT for any species, different parameters must be optimized for the sustainable production of target species, including stocking density, salinity levels, feeding frequency, feeding rate, carbon:nitrogen (C:N) ratio (source of carbohydrate) and probiotic species/type/strain. As L. vannamei and M. rosenbergii have differences in salinity preferences, in-depth research is required to optimize the salinity levels for maximum production and profit.
Nursery rearing is considered one of the prime steps for the successful farming of different crustacean species to achieve uniform growth, better immunity, higher survival rate, and coping up with climatic or environmental stressors. BFT-based nursery-rearing systems can potentially be more efficient in saving production costs by reducing feed conversion ratio (FCR) and nitrogen metabolite accumulation, improving survival performance, and producing healthy juveniles [38]. Therefore, the aim of this study was to compare the production performance (nursery rearing) of Pacific white leg shrimp (L. vannamei) and giant prawn (M. rosenbergii) at four different investigational salinity levels (0‰, 5‰, 10‰, and 15‰) as an attempt to optimize the salinity level for maximizing production or profit margins.
2. Materials and Methods
2.1. Acclimation Periods and Species Acquisition
The current study was carried out over a 6 weeks’ time frame (from February to April, 2023) at the International Institute of Aquaculture and Aquatic Sciences (I-AQUAS), University Putra Malaysia (UPM). Two round fiber tanks (1000 L) were prepared for the nursery acclimation phase for the post-larvae (PLs) of two target species (L. vannamei and M. rosenbergii). Prior to the preparation of acclimation tanks, seawater (30‰) and freshwater (0‰) were collected (preserved in two separate water holding tanks: 2000 L each), UV treated, and mixed in equal volumes to prepare 15‰ water. Then, two round fiber tanks (1000 L each) were filled with 15‰ water for acclimating M. rosenbergii and L. vannamei. Three air stones were placed in each acclimation tank to vigorously aerate the water. In total, 1200 individuals of L. vannamei (PL10) and 1200 M. rosenbergii (PL10) were collected from KG Acheh Setiawan Peraka and Hilex Aquatic Sdn Bhd, Jeram Kuala Selangor, respectively. L. vannamei and M. rosenbergii were stocked and maintained in two the separate tanks (1000 L round fiber tanks) containing 15‰ water for 4 days of acclimation. A commercial pellet feed (40% crude protein, miniscule crumbs: 0.25–1 mm in size) was given at the rate of 75% body weight to the PLs three times daily (at 09:00, 14:00, and 18:00).
2.2. Starter Preparation
Two probiotic strains (Lysinibacillus fusiformis SPS11, Enterococcus hirae LAB3) were collected from the Laboratory of Fish Health, Department of Aquaculture, Faculty of Agriculture, UPM in this experiment for using in the biofloc system. The biofloc starter was prepared by mixing 55 mL molasses (as carbohydrate source), 1 L probiotics consortium (5×10⁸ CFU mL−1) of L. fusiformis SPS11, and E. hirae LAB3 in 5.50 L of 15‰ water in a plastic bucket [39, 40]. The entire mixture was covered with the aluminum foil paper (in an aerobic condition) to keep it free from contamination and maintained at ambient temperature for 6 days for fermentation (a sweet smell indicated the growth of target probiotic bacteria). This fermented starter was used as the stock or mother solution for experimental purposes; added immediately (within 1 h) in the 12 experimental tanks containing water of four different salinities (0‰, 5‰, 10‰, and 15‰).
2.3. Experimental Design and Procedure (Tank Setting)
A total of 12 cylindrical plastic tanks (125 L each) were cleaned and prepared for this experiment: bi-culture for the nursery rearing of white leg shrimp (L. vannamei) and giant prawn (M. rosenbergii) in replicated tanks (Table 1) for 6 weeks. Initially, the 12 tanks were filled up to 100 L with 15‰ water, and an equal number of experimental animals (100/tank: 50 L. vannamei + 50 M. rosenbergii) were randomly allocated in each tank. Following this stocking in experimental tanks, attempts were made to achieve four different salinity levels (T1 = 0‰, T2 = 5‰, T3 = 10‰, and T4 = 15‰) with three replicated tanks per salinity. Salinities were reduced by adding freshwater (dechlorinated tap water) in the tanks. Salinity was reduced by 2.50‰ per day by adding freshwater in the tanks to achieve the target salinities. It took 6 days to achieve 0‰, 4 days to achieve 5‰, and 2 days for 10‰. Therefore, salinity reduction started 4 days early for T1 (0‰) and 2 days early for T2 (5‰) compared to T3 (10‰) to achieve the target treatment salinities simultaneously. Then, a 546.25 mL starter was added in each experimental tank. The floc concentration was found in the range of 0.50–1mL/L after 4 days of adding the starter, which is suitable for stocking PL [17]. In parallel, shrimp and prawn PLs were challenged with gradual salinity reduction in separate tanks to finally transfer them to the experimental tanks containing bioflocs. Immediately after achieving the target salinities, 100 PLs (50 L. vannamei + 50 M. rosenbergii) were stocked in each experimental tank containing bioflocs to maintain the stocking density of 1 PL per L [41]. L. vannamei and M. rosenbergii PLs were maintained in the replicated experimental tanks (T1 = 0‰, T2 = 5‰, T3 = 10‰, and T4 = 15‰) for 6 weeks to compare the production performance. These salinities were chosen because both of these two species are able to tolerate this salinity range [42–47]. All the experimental tanks were maintained with continuous aeration using air stones (connected to an aerator): one air stone for each tank. The initial body weight of L. vannamei was 23.4 ± 0.5 mg, and for M. rosenbergii 40.10 ± 0.35 mg during stocking in the experimental tanks.
| Experimental groups | Descriptions | Stocking ratio | Shrimp/prawn PLs (PLs × replicate) |
|---|---|---|---|
| T1 (0‰) | Freshwater (0‰) based biofloc system | 50V:50M | (V = 50+M = 50) × 3 = 300 |
| T2 (5‰) | Low salinity (5‰) based biofloc system | (V = 50+M = 50) × 3 = 300 | |
| T3 (10‰) | Medium salinity (10‰) based biofloc system | (V = 50+M = 50) × 3 = 300 | |
| T4 (15‰) | Medium-high salinity (15‰) based biofloc | (V = 50+ M = 50) × 3 = 300 |
- Note: M, prawn (M. rosenbergii); V, shrimp (L. vannamei).
- Abbreviation: PLs, post-larvae.
2.4. Feed Application
A commercial shrimp feed manufactured by CRP Dindings (40% crude protein, 5% fat, 4% crude fiber, and 12% moisture) was given to the experimental L. vannamei and M. rosenbergii PLs four times daily (08:00, 12:00, 03:00, and 06:00). Initially, feed was given at the rate of 20% of total biomass, which was gradually adjusted to 10% according to the methods outlined in [38, 48].
2.5. Carbon Source Used in the Experimental Tanks
Molasses was added daily in the experimental tanks to keep the nitrogen-to-carbon ratio at 10:1 [49]. The contents of the feed (CRP Dindings) were 90% of dry matter (moisture = 10%) and 30% digestibility. Normally, every feed contains 50% carbon when it is formulated [50, 51]. The daily amount of C:N ratio was calculated according to the feed supply’s overall protein level. Molasses was mixed with 50 mL of water and kept at ambient temperature overnight in an anaerobic environment. By multiplying the quantity of carbon by 0.31 (molasses contains 31.88% organic carbon, according to the test results of Material Characterization Laboratory, UPM), the daily amount of molasses was estimated as T1 = 0.89 ([T1R1 = 0.29] + [T1R2 = 0.28] + [T1R3 = 0.32]), T2 = 1.00 ([T2R1 = 0.33] + [T2R2 = 0.35] + [T2R3 = 0.32]), T3 = 0.96 ([T3R1 = 0.32] + [T3R2 = 0.31] + [T3R3 = 0.33]), and T4 = 1.16 ([T4R1 = 0.38] + [T4R2 = 0.38] + [T4R3 = 0.40]). In the morning (10:00 a.m.), molasses was poured into 12 biofloc tanks according to the above-mentioned amount.
2.6. Measuring Water Quality Parameters
Water pH and temperature were measured daily at 09:00 h using a Digital pH Meter (YIERYI 3 In 1 PH Tester, Yieryi Tools, China). Ammonia (NH3/NH4+), nitrate (NO3−), and nitrite (NO2) were measured every day at 10:30 h using an API test kit (MARS Fishcare North America). Dissolved oxygen (DO) (ppm) was measured once in a week at 08:30 h using a Doc SMART SENSOR Digital Dissolved Oxygen Meter. Bioflocs volume (BFV) was assessed with the support of Imhoff cones (after 30 min precipitation of 1 L of water samples) every day according to the methods of [52].
2.7. Concentration of Microorganisms in the Biofloc
2.8. Total Hemocyte Counts (THC)
2.9. Proximate Composition Analysis
2.10. Growth Parameters and Economic Analysis
2.11. Statistical Analysis
Initially, raw data (body weight, proximate composition, survivability, hemocyte counts, etc.) were loaded in Microsoft Excel 2011. Different types of statistical analyses were carried out with SPSS (version 25) software. The homogeneity and normality of the variances were assessed using the Shapiro–Wilks and Levene’s tests. One way analysis of variance (ANOVA) tests was used to investigate the variations between the experimental salinities. The post hoc assessment of the mean across distinct salinity groups was done using Duncan’s multiple range tests, while significant variations were found at the 5% level of significance (p < 0.05). Every data point in the tables was shown as mean ± SD (standard deviation), with a significant difference at α = 5%.
3. Results
3.1. Water Quality Parameters
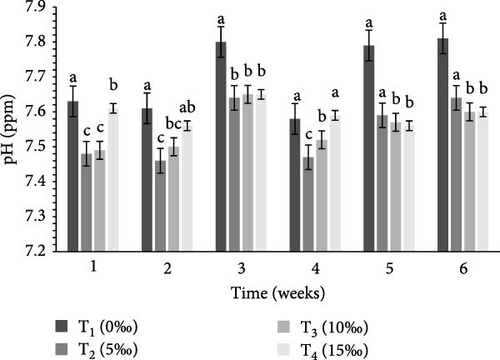
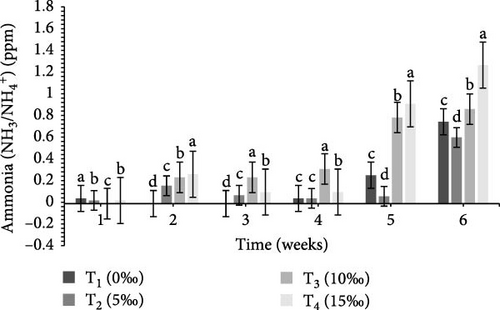
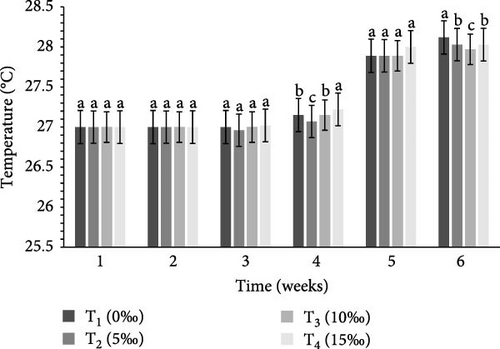
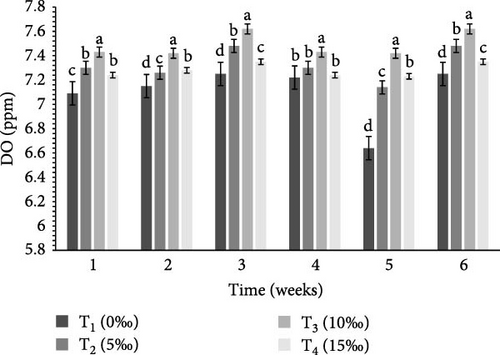
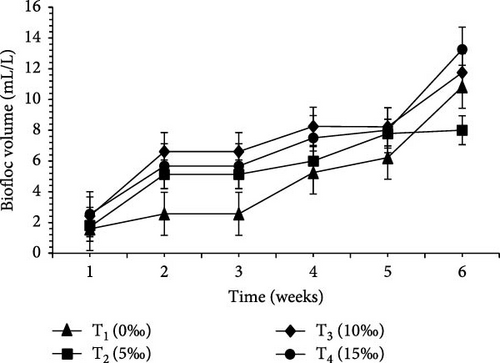
Table 2 and Figure 1 indicate the water quality parameters recorded in this study. Among the tested parameters, pH (ppm) and ammonia (NH3/NH4+) (ppm), temperature (°C), DO (ppm), nitrate () (ppm), nitrite () (ppm), and floc volume (mL/L) levels varied significantly (p < 0.05) between the four salinities.
| Parameters | T1 (0‰) | T2 (5‰) | T3 (10‰) | T4 (15‰) | p-Value |
|---|---|---|---|---|---|
| pH (ppm) | 7.70 ± 0.02a | 7.40 ± 0.25c | 7.55 ± 0.05b | 7.59 ± 0.06b | 0.001 |
| Ammonia (ppm) | 0.20 ± 0.1a | 0.19 ± 0.08a | 0.35 ± 0.16b | 0.45 ± 0.17c | 0.001 |
| Temperature (°C) | 27.43 ± 0.07a | 27.42 ± 0.05a | 27.39 ± 0.04b | 27.44 ± 0.07a | 0.003 |
| DO (ppm) | 7.10 ± 0.23c | 7.33 ± 0.17b | 7.49 ± 0.16a | 7.28 ± 0.23b | 0.001 |
| Nitrate (ppm) | 2.84 ± 0.72a | 2.41 ± 0.55b | 3.12 ± 0.82c | 4.38 ± 0.85d | 0.001 |
| Nitrite (ppm) | 0.05 ± 0.01a | 0.03 ± 0.01a | 0.11 ± 0.03b | 0.13 ± 0.05b | 0.001 |
| Floc volume (mL/L) | 5.67 ± 2.37a | 5.74 ± 0.40a | 8.11 ± 3.06a | 8.02 ± 0.97a | 0.001 |
- Note: Data present at means ± standard deviation. The different letters in the same row indicate significant differences at p < 0.05.
- Abbreviation: DO, dissolved oxygen.
3.2. Total Microbial Loads in the Biofloc
Experimental salinity treatments significantly affected (p < 0.05) the microbial loads (12.05–132.67 × 10⁹ CFU/mL) in the biofloc system (Table 3). An increasing trend was observed for the total microbial loads with increasing salinity and ranked as T1 (0‰ = 12.05 ± 0.93 × 10⁹) < T2 (5‰ = 38.32 ± 7.04 × 10⁹) < T3 (10‰ = 59.77 ± 4.90 × 10⁹) < T4 (15‰ = 132.67 ± 21.14 × 10⁹) (Table 3).
| Parameter | T1 (0‰) | T2 (5‰) | T3 (10‰) | T4 (15‰) | p-Value |
|---|---|---|---|---|---|
| Total bacteria | 12.05 ± 0.93d | 38.32 ± 7.04c | 59.77 ± 4.90b | 132.67 ± 21.14a | 0.001 |
- Note: Data present at means ± standard deviation. The different letters in the same row indicate significant differences at p < 0.05.
3.3. THC of the Two Species
Experimental salinity treatments significantly affected (p < 0.05) the THC (cells/mL) of the Pacific whiteleg shrimp (1.48–3.10 × 10⁵) and giant prawn (3.99–1.53 × 10⁵) in the biofloc system (Table 4). For L. vannamei an increasing trend was observed for the total hemocyte with increasing salinity and ranked as T1 (0‰ = 1.48 × 10⁵) < T2 (5‰ = 2.50 × 10⁵) < T3 (10‰ = 2.68 × 10⁵) < T4 (15‰ = 3.10 × 10⁵) (Table 4) but for M. rosenbergii decreasing trend was observed for the total hemocyte with increasing salinity and ranked as T1 (0‰ = 3.99 × 10⁵) > T2 (5‰ = 3.54 × 10⁵) > T3 (10‰ = 2.76 × 10⁵) > T4 (15‰ = 1.53 × 10⁵) (Table 4).
| Species | T1 (0‰) | T2 (5‰) | T3 (10‰) | T4 (15‰) | p-Value |
|---|---|---|---|---|---|
| L. vannamei | 1.48 ± 0.14d | 2.50 ± 0.11c | 2.68 ± 0.15b | 3.10 ± 0.12a | 0.001 |
| M. rosenbergii | 3.99 ± 0.08a | 3.54 ± 0.03b | 2.76 ± 0.17c | 1.53 ± 0.06d | 0.001 |
- Note: Data present at means ± standard deviation. The different letters in the same row indicate significant differences at p < 0.05.
3.4. Proximate Composition Analysis
Within different salinities, there were significant differences (p < 0.05) in the crude protein, lipid, ash, and carbohydrate contents of the L. vannamei and M. rosenbergii muscle (Table 5). For L. Vannamei, significantly (p < 0.05) higher levels of crude protein, lipid, and ash were found in T4 (15‰) compared to T1 (0‰), T2 (5‰), and T3 (10‰) (Table 5). The highest level of carbohydrate (p < 0.05) was found in T1 (0‰) compared to T2 (5‰), T3 (10‰), and T4 (15‰) (Table 5). For M. rosenbergii, significantly (p < 0.05) higher levels of crude protein and lipid were found in T4 (15‰) compared to T1 (0‰), T2 (5‰), and T3 (10‰) (Table 5). Moreover, the highest levels (p < 0.05) of ash and carbohydrate were found in T1 (0‰) compared to T2 (5‰), T3 (10‰), and T4 (15‰) (Table 5).
| Species | Parameters | T1 (0‰) | T2 (5‰) | T3 (10‰) | T4 (15‰) | p-Value |
|---|---|---|---|---|---|---|
| L. vannamei | Protein | 64.14 ± 0.15d | 66.75±.0.12c | 66.80 ± 0.09b | 68.56 ± 1.09a | 0.001 |
| Lipid | 2.96 ± 0.06d | 4.37 ± 0.07c | 5.21 ± 0.04b | 6.36 ± 0.08a | 0.001 | |
| Ash | 17.25 ± 0.80d | 17.42 ± 0.70b | 17.56 ± 0.65c | 17.64 ± 0.95a | 0.001 | |
| Carbohydrate | 15.65 ± 0.50a | 11.46 ± 0.65b | 10.43 ± 0.80c | 7.44 ± 0.65d | 0.001 | |
| M. rosenbergii | Protein | 63.20 ± 0.04c | 65.27 ± 0.09b | 65.75 ± 0.05a | 65.76 ± 0.08a | 0.001 |
| Lipid | 3.76 ± 0.03d | 4.10±.05c | 4.57 ± 0.07b | 4.95 ± 0.08a | 0.001 | |
| Ash | 15.92 ± 0.85a | 15.63 ± 0.90b | 15.55 ± 0.85c | 15.50 ± 0.50d | 0.001 | |
| Carbohydrate | 17.12 ± 0.75a | 15.00 ± 0.45b | 14.13 ± 0.25b | 13.79 ± 0.70b | 0.001 | |
- Note: Data present at means ± standard deviation. The different letters in the same row indicate significant differences at p < 0.05.
3.5. Proximate Composition of Biofloc
Table 6 demonstrates that the crude protein, fat, ash, and carbohydrate content of the biofloc varied significantly (p < 0.05) depending on the salinity levels. A decreasing trend was observed for the crude protein, lipid, and ash with increasing salinity and ranked as T1 (0‰) > T2 (5‰) > T3 (10‰) > T4 (15‰) but vice versa for carbohydrates (Table 6).
| Parameters | T1 (0‰) | T2 (5‰) | T3 (10‰) | T4 (15‰) | p-Value |
|---|---|---|---|---|---|
| Protein | 24.90 ± 0.73a | 23.96 ± 0.83b | 23.95 ± 0.80b | 17.70 ± 0.96c | 0.001 |
| Lipid | 0.60±.03a | 0.26 ± 0.01b | 0.22 ± 0.02ab | 0.15 ± 0.01b | 0.001 |
| Ash | 23.60 ± 0.85a | 23.55 ± 0.70b | 22.45 ± 0.90c | 22.40 ± 0.30d | 0.001 |
| Carbohydrate | 50.90 ± 0.25a | 52.23 ± 0.75b | 53.38 ± 0.70c | 59.75 ± 0.90d | 0.001 |
- Note: Data present at means ± standard deviation. The different letters in the same row indicate significant differences at p < 0.05.
3.6. Growth Parameters
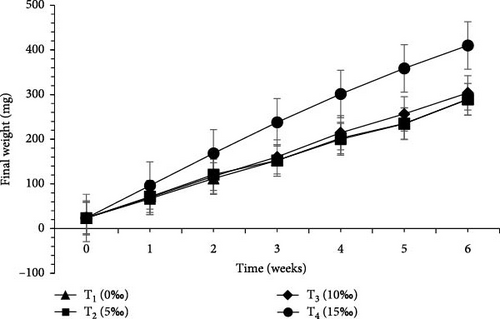
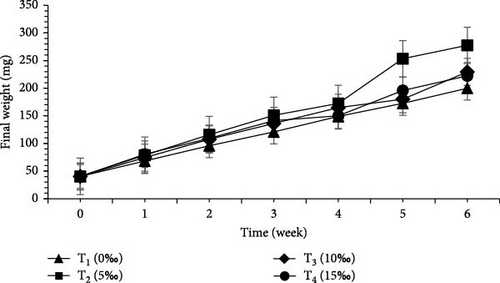
Growth performance and economic analysis of L. vannamei and M. rosenbergii raised in four different salinities were presented in Tables 7 and 8 and Figure 2. Survival rate (%) of L. vannamei was found to be significantly higher (p < 0.05) in T4 (15‰) (75.33 ± 5.03) than T3 (10‰) (44.67 ± 3.61), T2 (5‰) (26.67 ± 1.61), and T1 (0‰) (24.00 ± 2.00). Significantly higher (p < 0.05) survival rate (%) of M. rosenbergii was found in T2 (5‰) (93.33 ± 1.15) compared to T3 (10‰) (92.00 ± 3.46), T4 (15‰) (88.67 ± 7.57) and T1 (0‰) (87.33 ± 6.43).
| Parameters | T1 (0‰) | T2 (5‰) | T3 (10‰) | T4 (15‰) | p-Value |
|---|---|---|---|---|---|
| Initial length (mm) | |||||
| V | 13.10 ± 0.1b | 12.93 ± 0.23c | 13.10 ± 0.10b | 13.17 ± 0.06a | 0.001 |
| M | 14.70 ± 0.10c | 14.77 ± 0.12a | 14.73 ± 0.06b | 14.63 ± 0.12d | 0.001 |
| Initial weight (mg) | |||||
| V | 23.40 ± 0.20b | 23.47 ± 0.23b | 23.67 ± 0.50a | 23.67 ± 0.50a | 0.001 |
| M | 40.20 ± 0.20b | 40.40 ± 0.35a | 40.27 ± 0.12ab | 40.10 ± 0.26b | 0.017 |
| Final length (mm) | |||||
| V | 31.73 ± 4.15c | 34.47 ± 5.75b | 35.00 ± 3.61b | 40.07 ± 0.90a | 0.001 |
| M | 29.00 ± 1.97a | 28.47 ± 2.86ab | 27.80 ± 3.33b | 28.33 ± 1.50ab | 0.112 |
| Final weight (mg) | |||||
| V | 289.20 ± 42.91c | 289.53 ± 73.24c | 303.87 ± 60.93b | 409.93 ± 6.25a | 0.001 |
| M | 199.93 ± 4.69d | 277.60 ± 93.58a | 229.47 ± 76.37b | 222.40 ± 44.55c | 0.001 |
| Survival rate (%) | |||||
| V | 24.00 ± 10.00d | 26.67 ± 13.61c | 44.67 ± 13.61b | 75.33 ± 5.03a | 0.001 |
| M | 87.33 ± 6.43d | 93.33 ± 1.15a | 92.00 ± 3.46b | 88.67 ± 7.57c | 0.001 |
| FCR | |||||
| V | 2.59d | 2.21c | 1.40b | 1.21a | 0.001 |
| M | 1.36d | 1.12a | 1.28b | 1.34c | 0.001 |
| SGR, (%/day) | |||||
| V | 5.86d | 5.92c | 6.04b | 6.79a | 0.001 |
| M | 4.73a | 4.50b | 4.05c | 4.04c | 0.001 |
| Weight gain (%) | |||||
| V | 1076.66 ± 105.72d | 1135.71 ± 315.70c | 1187.57 ± 279.11b | 1632.26 ± 10.40a | 0.001 |
| M | 397.34 ± 12.97d | 585.86 ± 224.74a | 470.13 ± 190.81b | 454.15 ± 107.94c | 0.001 |
| DWG (mg/day) | |||||
| V | 6.00 ± 0.59b | 6.34 ± 1.74b | 6.67 ± 1.46b | 9.20 ± 0.14a | 0.001 |
| M | 3.80 ± 0.13d | 5.65 ± 2.22a | 4.50 ± 1.82b | 4.34 ± 1.05c | 0.001 |
| Biomass gain (mg) | |||||
| V | 251.93 ± 24.74d | 266.27 ± 73.00c | 280.20 ± 61.38b | 386.27 ± 5.75a | 0.001 |
| M | 159.73 ± 5.41d | 237.20 ± 93.24a | 189.20 ± 76.45b | 182.30 ± 44.29c | 0.001 |
| Production (g) | |||||
| V | 10.41 ± 0.30d | 11.58 ± 0.95c | 21.27 ± 1.34b | 46.32 ± 0.28a | 0.001 |
| M | 26.19 ± 0.24d | 38.86 ± 4.40a | 31.67 ± 3.51b | 29.58 ± 9.79c | 0.001 |
| Total production (g) | 36.60 d | 50.44 c | 52.94 b | 75.90a | 0.001 |
- Note: Data present at means ± standard deviation. The different letters in the same row indicate significant differences at p < 0.05. M, prawn (M. rosenbergii); V, shrimp (L. vannamei).
- Abbreviations: DWG, daily weight gain; FCR, feed conversion ratio; SGR, specific growth rate.
| Parameters | T1 (0‰) | T2 (5‰) | T3 (10‰) | T4 (15‰) | p-Value |
|---|---|---|---|---|---|
| Total cost (USD) | 5.85b | 5.86b | 5.86b | 5.88a | 0.035 |
| Gross return (USD) | 10.08d | 10.55c | 13.02b | 16.91a | 0.001 |
| Net profits (USD) | 4.25d | 4.69c | 7.16b | 11.02a | 0.001 |
| BCR | 0.72c | 0.80c | 1.22b | 1.87a | 0.001 |
- Note: The different letters in the same row indicate significant differences at p < 0.05. PL rate 0.029 USD, feed 0.924 USD/kg, and selling price 0.263 USD/L. vannamei and 0.158 USD/M. rosenbergii. 1 RM = 0.21 USD.
- Abbreviation: BCR, benefit–cost ratio.
FCR for L. vannamei was found to be noticeably (p < 0.05) better in T4 (15‰) (1.21) than T1 (0‰) (2.59). For M. rosenbergii, significantly better FCR (p < 0.05) was found in T2 (5‰) (1.12) compared to T1 (0‰) (1.36). SGR (%/day) for L. vannamei was significantly higher (p < 0.05) in T4 (15‰) (6.79) than T1 (0‰) (5.86). In contrast, significantly higher (p < 0.05) SGR (%/day) was observed for M. rosenbergii in T1 (0‰). Weight gain (%) for L. vannamei was significantly higher (p < 0.05) in T4 (15‰) (1632.26 ± 10.40) compared to T3 (10‰) (1187.57 ± 279.11), T2 (5‰) (1135.71 ± 315.70), and T1 (0‰) (1076.66 ± 105.72). Daily weight gain (mg/day) for L. vannamei was significantly higher (p < 0.05) in T4 (15‰) (9.20 ± 0.14) than T3 (10‰) (6.67 ± 1.46), T2 (5‰) (6.34 ± 1.74) and T1 (0‰) (6.00 ± 0.59). Weight gain (%) and daily weight gain (mg/day) for M. rosenbergii were significantly higher (p < 0.05) in T2 (5‰).
Biomass gain (mg) for L. vannamei was significantly higher (p < 0.05) in T4 (15‰) (386.27 ± 5.75) over T3 (10‰) (280.20 ± 61.38), T2 (5‰) (266.27 ± 73.00), and T1 (0‰) (251.93 ± 24.74). Biomass gain (mg) for M. rosenbergii was recorded as significantly higher (p < 0.05) in T2 (5‰) than other treatments. Total production (g) both (L. vannamei + M. rosenbergii) was significantly higher (p < 0.05) in T4 (15‰) (75.90 g) than T3 (10‰) (52.94 g), T2 (5‰) (50.44 g), and T1 (0‰) (36.60 g).
3.7. Economic Analysis
The higher (p < 0.05) gross return, net profit, and benefit–cost ratio (BCR) were found in T4 (15‰) (1.87) and followed by T3 (10‰) (1.22), T2 (5‰) (0.80), and T1 (0‰) (0.72), respectively (Table 8).
This financial evaluation did not take into account the lab equipment that provided by I-AQUAS or the Department of Aquaculture, Universiti Putra Malaysia.
4. Discussion
4.1. Water Quality Parameters
BFT is known to improve water quality by reducing nitrogenous waste [59] and minimizing excessive water use and environmental concerns through reduced effluent discharge [60, 61]. The efficiency of BFT depends on optimizing different parameters for target species, of which C:N ratio is very crucial. Earlier investigations indicate that the optimum range of different water quality parameters for different crustaceans includes: DO = 5–8 ppm, pH = 6.80–8.20, ammonia = 0.06–0.20 ppm, temperature = 26−30°C, nitrate = 0.30–1.20 ppm, nitrite = 0.02–0.10 ppm, and floc concentration (mL/L) = 6–80 mL/L [24, 36, 62–72]. In this study, all of these water quality parameters (DO, temperature, pH, ammonia, nitrate, nitrite, and floc concentration) were found to be within the optimum range (Table 2) in the experimental tanks, clearly indicate the important functions of BFT in maintaining water quality within the optimum range for the study species. In the current study, ammonia, nitrate, and nitrite were significantly higher (p < 0.05) in T4 (15‰) (Table 2) that were similar to the findings of earlier studies [58, 67].
4.2. Biofloc Microorganisms
The presence of a beneficial microbial community in BFT is known to enhance feed utilization and animal growth by providing feed supplements and improving water quality via detoxifying excessive nutrients [73]. Abundance of the microbial protein in the BFT contains heterotrophic bacteria that serve as a nutritional source, improve immunity and also help to reduce the loads of harmful microbes [19, 62, 74–76]. Moreover, the heterotrophic bacteria in the BFT control the presence of ammonia and other nitrogenous metabolites and convert wastes into additional food sources for the rearing of target species [71, 77]. Some earlier investigations found that even at a higher stocking density of target crustacean species, Vibrio load was lower in the biofloc system compared to the conventional system while exhibited a higher abundance of beneficial bacteria, including Bacteroidia, Bacteroidales, Flavobacteriia, Flavobacteriales, and Mollicutes [78–80]. In the current study, TB load (109CFU/mL) was significantly higher (p < 0.05) in T4 (15‰) (132.67 ± 21.14) than T3 (10‰) (59.77 ± 4.90), T2 (5‰) (38.32 ± 7.04), and T1 (0‰) (12.05 ± 0.93) (Table 3), which is likely due to these bacteria being more brackish/marine [81]. Salinity is a primary determinant of the growth of heterotrophic bacteria and the nitrification processes [82, 83]. In the current study, the highest (p < 0.05) amount of ammonia, nitrite, and nitrate was found in T4 (15‰), indicating a higher intensity of nitrification processes, which was similar to an earlier investigation [58]. The heterotrophic and nitrifying bacteria appear to be more active in higher salinities [84]. This suggested that more bacterial loads were found at T4 (15‰) due to increased salinity. According to Hosain et al. [67], the highest abundance of TB load was observed at 15‰ when only the giant prawn (M. rosenbergii) PLs reared at four different salinities (0‰, 5‰, 10‰, and 15‰). Another study on O. niloticus revealed changes in the abundance of TB loads when grown at varying salinities (0‰, 10‰, or 20‰) [85].
4.3. THC of the Two Species
Hemocyte counts generally indicate the immunity status of crustaceans; higher levels of hemocyte counts represent better immunity, while lower counts represent poor immunity [8, 86, 87]. Therefore, the amount/number of circulatory hemocyte cells has been recognized as an effective immunological index [88]. Crustacean hemocyte cells consist of hyaline, semi-granular, and big granular cells that participate in cellular immune reactions (such as phagocytosis), which is the main mechanism for fighting against or killing germs and pathogens [88–90]. Some earlier investigations indicate that healthy L. vannamei and M. rosenbergii normally constitute THC levels of 103 ± 4.6 × 10⁵cells/mL [91]. In this study, THC of L. vannamei and M. rosenbergii were found within this range (Table 4), clearly indicating good immunological or immunity status of the two species in the BFT system. For L. vannamei, significantly (p < 0.05) higher hemocyte counts were found in T4 (15‰) compared to T3 (10‰), T2 (5‰), and T1 (0‰), respectively (Table 4). According to [92–94], salinity is one of the important environmental stressors that can affect the physiology, immunology, growth, and survival of any aquatic species. Large-scale salinity change imposes osmotic stress on organisms that, in turn, reduce the THC of crustaceans and weakens the immunity system [95–98]. For M. rosenbergii, significantly (p < 0.05) higher hemocyte was found in T1 (0‰) compared to T2 (5‰), T3 (10‰), and T4 (15‰) (Table 4); these findings are similar to the earlier investigations [96, 99]. In-depth research is required to determine the change in THC is caused by cell proliferation, tissue-to-blood cell migration, or water osmosis between the medium and hemolymph for osmotic regulation [100].
4.4. Proximate Composition of PLs and Bioflocs
Salinity is known to play an important role in the biochemical makeup (moisture, lipid, and protein) of farmed crustaceans [82, 101, 102]. The findings of this study showed a similar trend with the earlier studies where protein, lipid, and ash contents of L. vannamei were significantly (p < 0.05) higher in T4 (15‰) compared to T3 (10‰), T2 (5‰), and T1 (0‰) (Table 5). Carbohydrate was highest at T1 (0‰), with significant differences (p < 0.05) among the salinity treatments. According to Liang et al. [102], there was an inverse association between the amount of protein and carbohydrate content of crustaceans. For L. vannamei, crude protein, and lipid levels were considerably higher (p < 0.05) in T4 (15‰) compared to T3 (10‰), T2 (5‰), and T1 (0‰) (Table 5). An earlier investigation [98] found no significant variation in the body protein content of prawns within the salinity range of 0−20‰ but observed a positive relationship with increasing salinity, similar to the current research. For M. rosenbergii, ash and carbohydrate levels were considerably higher (p < 0.05) in T1 (0‰) compared to T2 (5‰), T3 (10‰), and T4 (15‰) (Table 5); these results are similar to the findings of [67]. Higher salinities can also negatively impact the growth of prawns due to osmotic stress that increases energy expenditure and lipid reserve depletion [44, 99]. In addition, the protein, lipid, and ash content of the bioflocs tended to increase with decreasing salinity (Table 6); showing similarity with the findings of [58, 103].
4.5. Growth Performance
L. vannamei exhibits good growth and production performance under a good farming environment with a wide range of salinities (5−40‰) [44]. In this study, the best survival rate for L. vannamei was in T4 (15‰) (75.33 ± 5.03) and the lowest in T1 (0‰) (24.00 ± 2.00) (Table 7). Some earlier studies obtained the best growth performance of L. vannamei at 10−15‰ salinity range, while the highest survival was found at 20‰ [28, 43, 83]. As L. vannamei is a marine species, lower salinities may have an adverse effect on physiology, which could lead to a decline in survival rate [104]. Survival rate (%) for M. rosenbergii was found to be significantly higher (p < 0.05) in T2 (5‰) (93.33 ± 1.15) and T3 (10‰) (92.00 ± 3.46) compared to T4 (15‰) (88.67 ± 7.57) and T1 (0‰) (87.33 ± 6.43) (Table 7). The best survival for M. rosenbergii was obtained at T2 (5‰) (93.33) after 42 days of rearing, which was found to be similar with earlier investigations [105–107]. Adult M. rosenbergii can tolerate salinities ranging from 0 to 15‰, but the optimum range is ≈5‰ [99, 108]. Therefore, the highest survival rate of M. rosenbergii in T2 (5‰) (Table 7) reflects the optimum salinity for this species, which is corroborating with earlier studies [109]. In the current study, FCR for L. vannamei was noticeably lower (p < 0.05) in T4 (15‰) (1.21) than the other salinities which is similar to the findings of previous experiments [83, 101, 110]. In contrast, FCR for M. rosenbergii was observed to be noticeably lower (p < 0.05) in T2 (5‰) (1.12) compared to the other salinities. In this experiment, lower SGR (%/day) for L. vannamei was recorded in T1 (0‰) but M. rosenbergii exhibited significantly lower (p < 0.05) SGR in T4 (15‰) (Table 7). Low salinity (≤5‰) negatively impacts the SGR of L. vannamei for nursery rearing in a biofloc system, while no such impact is observed for M. rosenbergii [58]. In this study, the growth performance of L. vannamei was negatively affected by the low-salinity, and M. rosenbergii was positively affected for nursery bi-culture in the biofloc system (Table 7). Earlier research [111] revealed that higher production of L. vannamei was obtained at high salinity conditions of 15–30‰. In a recent study, M. rosenbergii females raised at lower salinities of 0−6‰ produced more larvae than those raised at higher salinities of 12−18‰ [112]. According to [113–115], M. rosenbergii is an osmoregulator in freshwater; the iso-osmotic point is at medium salinity range (14−15‰), but is an osmoconformer at higher salinities (15−30‰). According to Tarlochan [116], freshwater prawns may grow in salinity as high as 17‰, with the greatest growth occurring in salinity between 0 and 5‰. Apart from the physiological stress, the growth of freshwater species can be impacted in higher salinities by increased energy consumption and protein sparing [45]. Energy in the form of protein [117–119] and/or lipids [120, 121] is known to be necessary for hyper-osmoregulation in aquatic crustaceans. Marine crustacean species grow less when exposed to low salinities due to decreased appetite and assimilation of food, respectively [120, 121].
5. Conclusion
The current study successfully investigated the nursery bi-culture potential of L. vannamei and M. rosenbergii in a biofloc system over a period of 42 days. Findings clearly indicate the highest level of production in T4 (15‰). Typically, L. vannamei PL is grown at medium-to-high salinity environments, while M. rosenbergii PL is grown at freshwater conditions. Results obtained from this study clearly indicate that in the biofloc system, both species can be combined (bi-culture) in the T4 (15‰), which will support better production and induction of aquaculture sustainability. It can be considered a climate-smart or climatically resilient technology. The findings of this study may improve the L. vannamei and M. rosenbergii in bi-culture by lowering feed costs and zero water exchange. It is important to note that successful BFT requires optimization of salinity, species ratio, density, feeding rate, and frequency, as well as C:N ratio. This study successfully optimized the salinity requirement for these two commercially important species (bi-culture for nursery rearing) using BFT. The remaining other factors require optimization in the future to make this technology more profitable and sustainable.
Ethics Statement
The Institutional Animal Care and Use Committee (IACUC) at Universiti Putra Malaysia (UPM), Malaysia, approved the experimental methods involving animals (shrimp and prawn) in this study.
Conflicts of Interest
The authors declare no conflict of interest.
Author Contributions
Md. Abdul Halim, Aziz Arshad, Dania Aziz, and Nur Leena W.S. Wong contributed to conceptualization, methodology, investigation, data record, and formal analysis. Murni Karim, Md. Ariful Islam, Fadhil Syukri, and Md. Lifat Rahi contributed to data curation, checked journal format, and visualization. All authors have reviewed the published version of the manuscript and given their approval.
Funding
This work was funded by Universiti Putra Malaysia (UPM) through the Research University Grant Scheme (RUGS) with grant number GP-IPB/2020/9687900 (Pusat Kos: 9687900).
Acknowledgments
The authors gratefully acknowledge the International Institute of Aquaculture and Aquatic Sciences (I-AQUAS) at UPM, Port Dickson, Malaysia, for providing laboratory facilities and support. The authors are also thankful to the Bangabandhu Science and Technology Fellowship Trust, Ministry of Science and Technology, Bangladesh, for providing the scholarship.
Open Research
Data Availability Statement
The information of this research is available from the corresponding author upon reasonable request.


