The Effects of Seawater Temperature on the Performance of the Tropical Sea Urchin Lytechinus variegatus (Lamarck, 1816)
Abstract
As seawater temperatures rise in the ocean due to global temperature change, altered mean precipitation, and weather patterns, native species face uncertain futures. The alteration in thermal tolerance was assessed in wild-captured tropical sea urchins (Lytechinus variegatus) from the Caribbean Sea and then maintained under controlled conditions. Three experiments were performed: (1) favorable growth temperature: after maintaining wild sea urchins at three different seawater temperatures (22, 24 and 26°C) for 70 days, it was observed that 22°C was the best temperature for growth performance. Sea urchins showed daytime behavior (higher activity at 9:00−10:00 h), during this time period; (2) thermal preference (TP): determined with the help of a horizontal camera with a thermal gradient (19–30°C), it showed that the acclimation temperature influenced the TP of sea urchins, since a significantly higher number of animals opted for the temperature at which they had been acclimated; and (3) critical thermal maximum (CTmax) and critical thermal minimum (CTmin): sea urchins exposed to a progressive temperature change, starting from the acclimation temperature, tolerated the increase in temperature (up to 14°C) better than the decrease (up to 12°C). These results thus contribute to our knowledge of sea urchin thermal biology and provide information about the assessment of thermal comfort conditions in sea urchin farming.
1. Introduction
Currently, there are several studies that assess the influence of environmental parameters on aquatic species and to understand their physiological requirements under controlled conditions. Temperature is one of the abiotic factors that influence the physiology and behavior of marine ectotherms, which determines growth performance and survival rate, as well as the speed of metabolic processes. Temperature is one of the most important factors to be considered in the natural environment or in aquaculture, as individuals react by avoiding extreme temperatures until they find optimal conditions [1–5].
The unprecedented seawater temperature increases associated with the current global warming of the planet represent a significant challenge in terms of animal welfare and marine farming [6]. Among the high number of marine species depicting attention in the field of aquaculture, sea urchins have gained recognition due to their economically and ecologically significance as a prized delicacy worldwide (in “sushi”, “sashimi,” or “cazuela”) [7–10] and as a regulator of seagrass and rocky reef communities [11].
For the past few years, the world’s wild sea urchin stock has been decreasing [11–14], and two determining factors have been found: (1) the increase in temperature due to global warming, which has modified the distribution of many marine resources in search of their optimal conditions for growth, modifying in turn the ecological interactions of species in the ecosystems, as well as their biology, ethology, and even their physiology [15, 16]; and (2) overfishing and ineffective fishery policies and management, as sea urchin roe is a prized seafood product worldwide due to its nutritional, medicinal, and aphrodisiac properties [15–17].
Lytechinus variegatus is distributed from the United States to Brazil [18] and inhabits substrates characterized by seagrass meadows and sandy or muddy bottoms. The species live on the intertidal coastline and are regularly exposed to fluctuating conditions, which makes them a useful indicator of the impact of temperature changes [8, 10, 11, 19–21]. This species exhibits rapid growth, with its gonads maturing in a relatively short period, and it is easily managed and breeding in captivity, making it a potential candidate for aquaculture [22–24].
Understanding the effect of more frequent and longer extreme temperature events on physiological responses and growth performance of native species such as L. variegatus is essential for developing suitable mitigation methods against climate change and ensuring that sea urchin farming remains a major income opportunity in developing countries in the future. Furthermore, the physiological response of L. variegatus, in relation to osmotic properties, is also addressed. Indeed, as described by Vernberg and Silverthon [25], the condition temperature fluctuations impact the osmotic properties of fluids in living organisms, as they are influenced by seawater movement through cellular membranes and ionic exchange. The assessment of ions (Na+, K+, Cl−) in tropical sea urchin will provide a physiological indicator that will increase the fundamental understanding of the effects of thermal changes on this species cultivated on a small scale.
So far, no studies have been carried out on the behavior and thermal tolerance of tropical echinoids from the Colombian Caribbean Sea, so characterizing this type of response in this species will allow us to determine the effects of temperature by estimating the intervals that favor its biological performance under small scale aquaculture. This is especially important, as the sea urchin is a new target species for aquaculture in a number of Latin American countries [26–32].
2. Materials and Methods
2.1. Ethical Treatment of Animals
All experimental procedures complied with the Guidelines of the Ethical Committee of the Universidad del Magdalena for the use of laboratory animals in research projects.
2.2. Sea Urchins and Experimental Conditions
In the Colombian Caribbean Sea, two climatic periods have been identified: (1) the dry season—upwelling (December–April), during which the northeast trade winds exert a greater influence, resulting in a decrease in seawater temperature (20–25°C); and (2) the rainy season—upwelling is absent (May–November), the trade winds weaken, allowing the Panama countercurrent to prevail. This phenomenon results in an increase in seawater temperature, varying between 27 and 29°C [33, 34]. The sea urchin L. variegatus lives under extreme temperatures ranging from 22 to 29°C [35]. This interval was considered when developing the experiments described below.
Sea urchins were collected manually during the morning (25°C and salinity ≥35 ppt), within areas of low wave action, with the help of artisanal fishermen from the Bay of Rodadero (11°12′32″ N - 74°14′12″ O), and rapidly transported (20 min by car) in 25-L tanks with ice-cooled seawater to the Universidad del Magdalena Aquaculture facilities.
Once in the laboratory, the sea urchins were acclimated to the average ambient seawater temperature at the time of collection. The day after the individuals were sampled for biometric measurements (mean ± SE) of wet body weight (24 ± 1 g) and test diameter (4.2 ± 1 cm), and randomly placed in the rearing tanks. They were adapted (0.5°C/h) for 20 days at three temperatures (22, 24 and 26°C) in 250-L aquariums supplied with filtered (1 µm) seawater (36 ppt), sterilized with UV, and maintained with constant aeration.
The seawater temperature of each experiment was adjusted and maintained using heaters (Sunlike, 100 W) with an electronic thermostat and an inverter air conditioner (12.000 BTU). The temperature was measured twice a day using a HACH LANGE 5130 thermometer, while the pH (7.9 ± 0.07) was verified with a HACH LANGE 5130 pH meter. A HACH 85004 oximeter was used to measure dissolved oxygen (DO) rate (6.5 ± 0.3 mg/L), whereas salinity (36 ± 0.5 ppt) was evaluated using a HACH 5500 refractometer. The sea urchins were reared under natural photoperiod conditions (13 h light:11 h dark).
2.2.1. Favorable Growth Temperature
The favorable growth temperature was determined based on the growth performance and survival rates of the sea urchins. To that end, 108 sea urchins were randomly allocated to three different groups, distributed among 12 18-L aquariums (nine individuals/aquarium; four replicates per group), and each group exposed to one of three different temperatures: 22, 24, and 26°C for 70 days.
Aquariums were filled with natural seawater (36 g/L) filtered with a 1-µm filter, sterilized by UV light, and continuously aerated with an air blower (1 HP). As needed, salinity was adjusted by adding aerated tap water. The temperatures were maintained using an inverter air conditioner (12.000 BTU) and heaters (Sunlike, 100 W) with electronic thermostats.
The sea urchins were fed Ulva lactuca once a day, at 10% of their live weight. The biological performance of sea urchins was evaluated in terms of increase in growth, specific growth rate (SGR), and survival (%). Daily, a 10% replacement of the seawater was carried out, ensuring that the temperature remained consistent throughout each experiment. Feces and food debris were removed, as part of aquarium maintenance.
2.2.1.1. DO Concentration Rate (DO Rate)
During the favorable growth temperature trial, the seawater DO concentration rate was measured every hour for 24 h of the 12 experimental aquariums using a HACH 85004 oximeter.
2.2.2. Thermal Preference (TP)
In order to assess sea urchin TP, a temperature channel was built based on the modified design by Hall et al. [36]. For this purpose, a 3-m long, horizontal PVC piping (6 in. diameter) and two Sunlike 100 W quartz heaters with an electronic thermostat were placed at one end, and bags of frozen hydrogel were placed at the opposite end to achieve the thermal gradient. Ten digital thermometers with a thermocouple (TPM-10) were positioned along the chamber to monitor the temperature gradient. A hose providing diffused air in the seawater created enough circulation to prevent vertical thermal stratification. The system was tested for 3 days before the experiment, recording the temperature every 15 min for 3 h to ensure that the temperatures within the gradient were maintained between the limits of 20–29°C.
The TP study was carried out using six sea urchins from each experimental temperature (22, 24 and 26°C) and was run in triplicate and separately for each temperature. The individuals selected were exposed in a chamber with a thermal gradient matching their acclimation temperature. After a 20-min transition period to allow for handling stress to subside, sea urchin positions and temperature were recorded every 30 min for 24 h. Recordings were always done by the same person from a hidden observation post 1.5 m above the gradient chamber. After each test, the seawater was changed and renewed to prevent the accumulation of metabolic waste.
2.2.3. Thermal Tolerance
The upper and lower critical temperatures were based on the acclimation temperature of the sea urchin culture (22, 24 and 26°C) as stated in section on 2.2.1 Favorable growth temperature. The baseline acclimation temperature determined the starting temperature of the critical thermal minimum (CTmin) and the critical thermal maximum (CTmax). The animals were fasted for 24 h prior to the experiment to reduce metabolic waste and its effect on seawater quality and facilitate the observation of the responses being evaluated. The behavioral responses in sea urchins to temperature changes have been previously described by Hernández et al. [37]. These trials were run in triplicate for each acclimation temperature.
2.2.3.1. CTmin
Sea urchins (23 ± 1 g, mean ± SD) were placed in 18-L aquariums with frozen hydrogel bags attached to an aeration hose used to distribute the cooled seawater. In each test, the temperature was reduced at a rate of 1°C per min [38]. The experiment finished when 50% of organisms lost their ability to move and adhere to walls, and they began to display different behavioral responses to the cold. The CTmin of the sea urchin for each acclimation temperature (22, 24 and 26°C) was evaluated separately.
2.2.3.2. CTmax
Sea urchins (23 ± 1 g, mean ± SD) were placed in 18-L aquariums with two quartz heaters (Sunlike 25 W) attached to an aeration tube to distribute the heat. The seawater temperature was increased at a rate of 1°C per min [38]. The experiment was concluded when 50% of the animals ceased movement, and they began to display different behavioral responses to the heat. The CTmax of the sea urchin for each acclimation temperature (22, 24 and 26°C) was evaluated separately.
2.2.4. Ion Concentrations
After having observed that the urchins stopped moving and their spines relaxed, the celomic fluid (CF) of each individual was collected through the peristomial membrane, using an insulin syringe. The ion concentrations were determined following the Standard Methods for the Examination of Water and Wastewater [39]. For the determination of Cl–, silver nitrate was employed as the titrant, while potassium chromate served as the indicator. The Na+ and K+ ions were analyzed through acid digestion using nitric acid, followed by measurement via flame atomic absorption spectrometry (Thermo Electron Corporation—S Series AA Spectrometer).
2.3. Statistical Analysis
The data were processed using the Statgraphics Centurion XVI statistical software version 16.1.18 and were expressed as the mean ± standard deviation. Normality tests were carried out using the Kolmogorov–Smirnov test, and homogeneity of variance was confirmed with the Levene test on all data. As a result, one-way parametric ANOVA tests were used to determine the effect of the different temperatures on growth (weight and diameter) and ion concentration, and a Fisher’s least significant difference (LSD) test was applied to detect significant differences among the experimental treatments.
For the TP experiment, the data did not meet the assumption of normal distribution. Consequently, the Kruskal–Wallis test was employed to compare the preferred temperatures of sea urchins that had been previously acclimated to 22, 24, and 26°C. Frequency histograms were generated to assess the TPs of the animals. The thermal tolerance test was descriptive; thus, no statistical analysis was conducted. Additionally, ion concentration was analyzed using analysis of variance (ANOVA) and multiple range tests to identify significant differences. All tests were conducted at a significance level of α 0.05.
3. Results
3.1. Favorable Growth Temperature
Behavioral recordings evidenced that sea urchin spines could move at different speeds: increased movement (>32 oscillations/min); moderate movement (<18 oscillations/min); and little or no movement (5-0 oscillations/min). The position of the spines and tube feet, the animals’ position in the aquarium, and their ability to adhere to the aquarium walls were also recorded.
The first 2 days of the experiment, the individuals exhibited normal behavior: a fair amount of movement, the ability to adhere to the walls of the aquarium, a number of different postures—face down, face up, sideways and inverted (attached by the siphon)—and spines and tube feet completely upright. At the end of the experiment, the sea urchins acclimated at 24 and 26°C were observed to exhibit little movement at the bottom of the aquarium, while those exposed to 22°C remained on the surface of the aquarium at the seawater level and exhibited moderate movement; however, they presented black spots on their shell and fragile spines.
3.1.1. Growth and Survival Rates
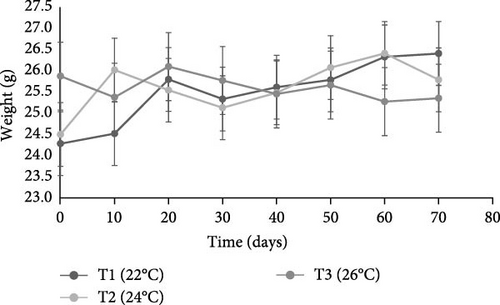
In terms of weight, the sea urchins in the 26°C treatment showed a tendency toward a decrease in body weight, resulting in a loss of ~1.5 g, whereas a positive tendency was seen in those acclimated at 22 and 24°C, with a weight gain of 2 and 1.3 g, respectively (Figure 1 and Table 1).
| Parameter | T1 (22°C) | T2 (24°C) | T3 (26°C) | p Value |
|---|---|---|---|---|
| Initial weight (g) | 24.3 ± 4.6 | 24.5 ± 4.1 | 25.9 ± 4.3 | p > 0.05 |
| Final weight (g) | 26.5 ± 5.2 | 25.8 ± 5.0 | 25.5 ± 4.1 | p > 0.05 |
| Initial diameter (mm) | 42.1 ± 3.4 | 42.8 ± 4.5 | 43.7 ± 3.1 | p > 0.05 |
| Final diameter (mm) | 40.4 ± 2.6 | 40.5 ± 2.5 | 39.9 ± 2.0 | p > 0.05 |
| SGR (%) | 0.14 | 0.09 | −0.03 | 0.6921 |
| Survival (%) | 100 | 100 | 91.66 | 0.4053 |
- Note: Animals exposed to 70 days of culture. n = 36 animals per treatment.
- Abbreviation: SGR, specific growth rate.
At the end of the trial, there were no statistically significant differences (p = 0.7) between the initial and final weights of acclimated animals at 22, 24 and 26°C. On the other hand, the most favorable temperature for sea urchin growth was found to be 22°C, as animals exposed to this temperature showed the highest SGR value (0.14%), as compared to 0.09% at 24°C and −0.03% at 26°C. Moreover, the survival rate of sea urchins at 22 and 24°C was 100%, while in the tank acclimated to 26°C it was 91.66%.
3.1.2. DO Seawater Rate
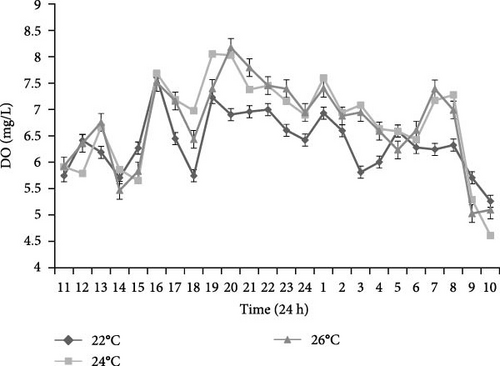
L. variegatus demonstrated diurnal behavior, based on the increased movement of Aristotle’s lantern, tube feet and spines, tank coverage, displacement, and eating behavior during these hours. This is confirmed in Figure 2, where the lowest rate concentration of DO in the seawater was recorded during the day and was seen between 9:00 and 10:00 in the morning in all three treatments, coinciding with higher animal activity.
3.2. TP
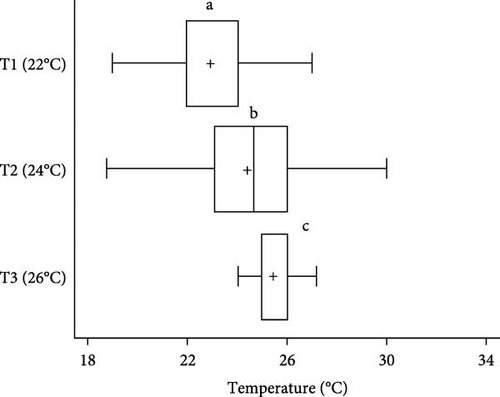
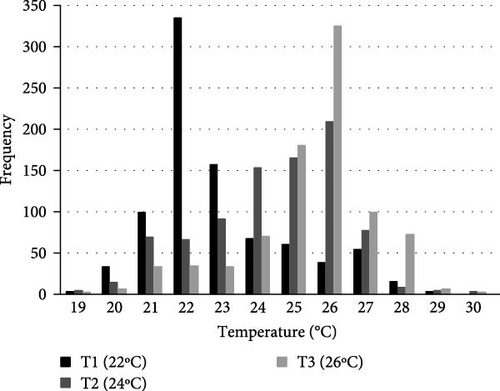
Statistically significant differences (p < 0.05) in TP were seen in sea urchins exposed to the different acclimation temperatures. Sea urchins acclimated at 22°C preferred a temperature of 22 ± 0.1°C (66.78% of the individuals). Animals maintained at 24°C were dispersed along the gradient, albeit 82.99% of them opted for tank areas at a temperature of 25 ± 2°C (Figures 3 and 4). Finally, 68.98% of the specimens exposed to 26°C stayed at 26 ± 0.1°C. Sea urchins moved through different temperatures along the gradient throughout the study; however, most individuals remained close to their acclimation temperature, with those acclimated at 24°C, showing a greater dispersion.
3.3. Thermal Tolerance
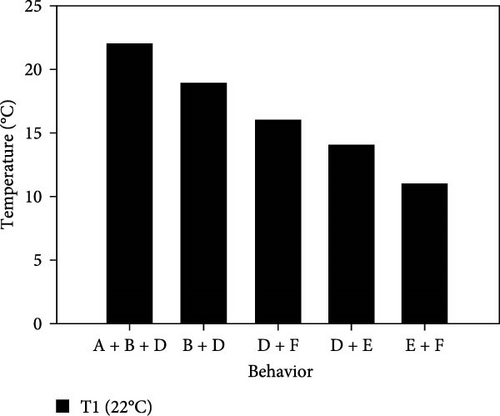
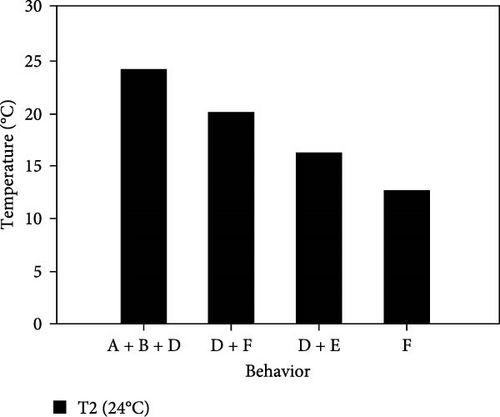
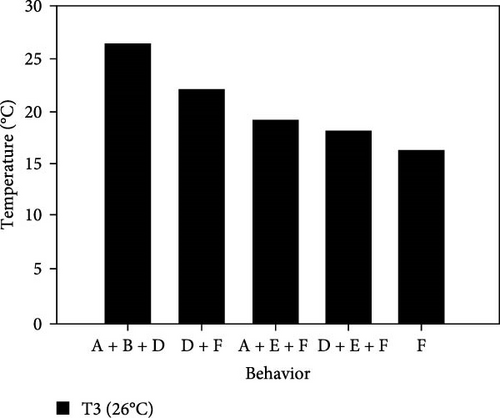
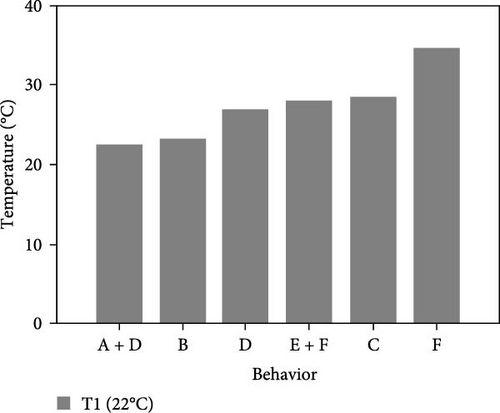
During the experiment, the sea urchins showed different behaviors, which are presented in Figure 5.
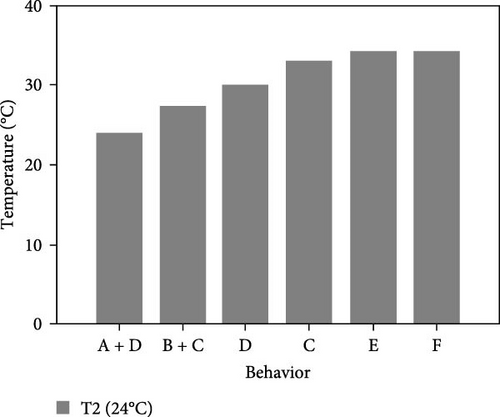
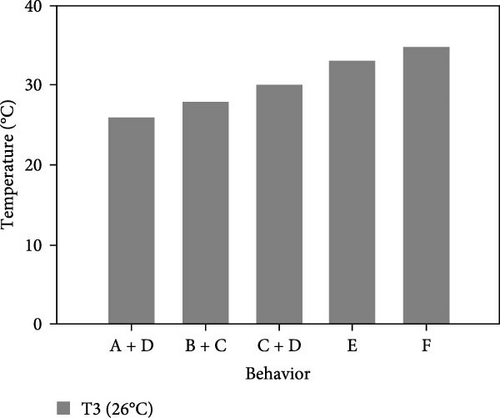
3.3.1. CTmin
- A.
Start and increase in motion
- B.
Attached to the surface at the seawater level
- C.
FUBP: Face-up and face-down body position and sideways body position
- D.
Fully extended ambulatory feet and retracted ambulatory feet
- E.
Flat-lying spines and spines covering the mouth
- F.
Loss of adhesion capacity, decreased movement and ceasing movement
3.3.1.1. Treatment at 22°C
- I.
This experiment started at 22°C with all animals placed together at the bottom of the aquarium. Their behavior was normal, with their spines and tube feet completely upright, and showing moderate movement and normal retraction of Aristotle’s lantern. After 5 min at this temperature, they began to disperse and climb the walls of the aquarium.
- II.
At 19°C, there was a moderate decrease in the sea urchins’ movement, while still remaining attached to the aquarium wall, with erect spines and fully elongated tube feet.
- III.
At 16°C, sea urchins began to descend the wall; they slightly retracted their tube feet, so that they were similar in size to the spines; the upper spines showed no movement.
- IV.
At 14°C, all individuals were at the bottom and 75% of them had completely retracted their tube feet; the spines were flattened, and they stopped retracting Aristotle’s lantern. They had covered their mouths with the lower spines, which showed moderate movement.
- V.
At 11°C, all animals were at the bottom, with little or no movement of the lower spines; this was selected as the CTmin. They were observed for 30 min, at which time 66.7% of individuals stopped showing any movement.
3.3.1.2. Treatment at 24°C
- I.
After placing them together at the bottom of the aquarium at 24°C, sea urchins exhibited a great deal of movement and had fully upright spines, upright tube feet, and retracted Aristotle’s lantern. After 6 min at the same temperature, they began to disperse toward the aquarium walls.
- II.
At 20°C, 25% of the individuals began to move down the wall, and 50% decreased their movement and retracted their tube feet so that they were similar in size to the spines.
- III.
At 16°C, the sea urchins retracted their tube feet, laid down their spines, showed little or no movement of the upper spines, and began to cover their mouth with the lower spines.
- IV.
At 14°C, 83.3% of the individuals were at the bottom, the movement of the lower spines had decreased moderately, and they stopped contracting their Aristotle’s lantern.
- V.
At 11°C, 66.7% of the sea urchins completely stopped moving their lower spines. They were observed for 30 min, during which time no change in their behavior was observed. Therefore, the experiment was considered finished and 11°C was selected as the CTmin at this level.
3.3.1.3. Treatment at 26°C
- I.
The experiment started at an acclimation temperature of 26°C with all individuals placed together at the bottom of the aquarium. They presented completely upright spines and tube feet, a moderate amount of movement, and a normal retraction of Aristotle’s lantern. After 30 min, at 25°C, the sea urchins began to disperse and move toward the walls of the aquarium, where they began to adhere to the wall.
- II.
At 22°C, the movement of the sea urchins began to slow down; they remained attached to the aquarium wall and retracted their tube feet to a size similar to that of their spines.
- III.
At 19°C, 58.3% of individuals began to cover their mouth with the lower spines, their upper spines showed little or no movement while their tube feet exhibited moderate movement; sea urchins began to descend the wall.
- IV.
At 18 ± 1°C, all individuals were at the bottom, had retracted their tube feet, and folded down their spines; there was no movement of the upper spines, and they no longer retracted Aristotle’s lantern.
- V.
At 16°C, 66.7% of the sea urchins completely stopped moving their lower spines. They were observed for 30 min, during which time they presented no movement. However, none of the organisms died, so we assumed that they entered a state of lethargy or hibernation. Therefore, 16°C was selected as the CTmin at this level.
3.3.2. CTmax
During the experiment, different behaviors adopted by the sea urchins were observed. The acronyms used to refer to them are the same as described above (Figure 5).
3.3.2.1. Treatment at 22°C
- I.
This experiment started at 22°C with all animals placed together at the bottom of the aquarium. The individuals showed normal behavior, with their spines and tube feet completely straight, a great deal of movement and normal retraction of Aristotle’s lantern. The group of sea urchins then dispersed and 50% of them began to climb up the aquarium walls, proceeding to continuously move up and down the walls.
- II.
At 23°C, 100% of the sea urchins were attached to the surface at the seawater level or halfway up the water level, and most were congregated together. Sea urchins adopted different positions, such as face up, face down, side by side, and inclined.
- III.
At 26°C, the above positions were still observed; the sea urchins were on the surface of the aquarium at the seawater level, and the first signs of the loss of adhesion appeared. However, after a few minutes, the animals began to climb up and down the walls of the aquarium, and they repeated this behavior up to 33°C.
- IV.
At 33°C, 12.5% of the sea urchins had lost their adhesion capacity, however, they still presented the above-mentioned postures and decreased movement of spines and tube feet. These behaviors increased to 37.5% at 36°C.
- V.
At 36°C, 75% of individuals stopped moving; their spines flattened, and the tube feet were retracted; therefore, 36°C was selected as the CTmax.
3.3.2.2. Treatment at 24°C
- I.
This experiment started at 24°C with all sea urchins placed together at the bottom of the aquarium. Their behavior was normal, and their spines and tube feet were completely upright, with a great deal of movement and normal retraction of Aristotle’s lantern. After a few minutes, the sea urchins separated and 58.3% of them began to climb the aquarium walls; 25% of the individuals showed postures such as face up, face down, lying down, and inclined.
- II.
At 28 ± 2°C, the urchins began to move up and down the aquarium walls; these behaviors were reproduced up to 36°C. The sea urchins folded their spines down and presented slower movements.
- III.
At 33 ± 2°C, a loss of adhesion was observed in 16.7% of individuals, who also exhibited decreased movement of spines and tube feet.
- IV.
At 36°C, 75% of the organisms had stopped moving and exhibited flat spines (folded spines) and retracted tube feet; they had also lost the ability to move and adhere to the walls. Therefore, 36°C was selected as the CTmax.
3.3.2.3. Treatment at 26°C
- I.
This experiment started at 26°C with all the sea urchins placed together at the bottom of the aquarium. Their behavior was normal, and they displayed completely upright spines and tube feet, with a great deal of movement and normal retraction of Aristotle’s lantern. After 10–20 min, 60% of the animals began to disperse and climb the aquarium walls.
- II.
At 27 ± 2°C, 80% of the individuals were on the surface of the aquarium at the seawater level, and positions such as face up, face down, sideways, and inclined body were observed.
- III.
At 30°C, the above positions increased in frequency as the temperature increased. This behavior occurred in 70% of the animals.
- IV.
Starting at 33°C, these positions were no longer displayed; however, the sea urchins showed a constant climbing and descending behavior on the aquarium wall, and 10% of them also started to lose their adhesion capacity.
- V.
At 36°C, 80% of the individuals had lost their adhesion capacity and fell to the bottom, and fully folded spines and retracted tube feet were observed. Therefore, 36°C was selected as the CTmax.
3.3.3. Ion Concentration
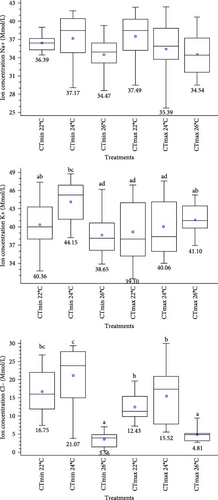
The ANOVA showed no statistically significant changes (p < 0.05) in the concentration of Na+ present in the CF of the urchins exposed to the CTmin (p = 0.1441). On the contrary, significant differences were observed for Cl− and K+ (p > 0.05) concentrations at the three experimental temperatures (Figure 6). Sea urchins acclimated at 26°C presented significantly lower concentrations for both ions than those exposed to 22 °C and 24°C. The lowest values were seen for Cl−. No statistically significant changes (p < 0.05) were seen either in the concentration of K+ and Na+ ions present in the CF of sea urchins exposed to CTmax, (p = 0.6 and p = 0.3, respectively). On the contrary, Cl− concentrations showed significant differences at the different acclimation temperatures tested (p > 0.05).
4. Discussion
4.1. Favorable Growth Temperature
The favorable growth temperature is defined as the one at which an organism naturally performs its biological and physiological processes [2, 40, 41]. In this study, three thermal treatments (22, 24 and 26°C) were evaluated to achieve the most favorable growth and survival rates. TP and thermal tolerance of L. variegatus were also assessed which enables us to improve aquaculture and conservation programs and enhance our knowledge of its thermal physiology in light of climate change and the threats faced to marine life.
In all three treatments, sea urchins showed a similar behavioral response, but it was manifested on different days. This response was expressed in terms of their location in the aquarium. Their position (face up, face down, sideways, etc.), the movement of their spines, tube feet, and Aristotle’s lantern, etc., which according to McClintock [42], are normal behaviors in their natural habitat.
After 70 days of exposure, there were no significant differences between the weights of the sea urchins acclimated at the different temperatures; however, those kept at 22°C showed a higher SGR, while those exposed to 26°C experienced a negative SGR. This response showed an inverse relationship between favorable temperature and SGR as was reported by Cui et al. [43]. This would indicate that temperature is a growth-limiting factor within a range of 22–24°C for short range studies and may be a relevant parameter in tropical sea urchin farms.
There is a limited number of studies examining the thermal conditions of sea urchins in both natural and captive environments. Most research focuses on assessing the effects of climate change, ocean warming, and acidification on reproductive characteristics, gene expression or fertilization [21, 24, 44–47], as well as larval development and settlement [48, 49], food [5, 50], immune response [51], highlighting the impact of these changes on the ecological, genetic, biological, physiological, and behavioral aspects of echinoderms. However, it can be stated that in certain species, there is no variation in growth when temperature increases (S. neumayeri) [47, 52], which will also depend on the species origin, thermal change, and other conditions.
A similar study was conducted by Hernández et al. [37], on the effect of the temperature on the behavior and the osmotic pressure of the red sea urchin S. franciscanus, a western Pacific Ocean coast echinoderm. The authors state that temperature affects sea urchin resistance and osmoregulation and those that were subjected to elevated temperatures experienced an increase in the osmotic pressure of their body fluid.
Some authors have reported that L. variegatus decreases its food consumption when exposed to a relatively high-water temperature (26°C), which in turn decreases the SGR because its metabolic rate increases. This may be associated with the ion and osmotic exchange, as exposed below, which would result in the loss of body weight [53–55]. This was clearly the case in sea urchins exposed to temperature of 26°C, where negative SGRs were recorded. Similar result was found in Strongylocentrotus intermedius when exposed to conditions of ocean acidification and warming [43].
Survival is one of the most common parameters considered when determining seawater quality variables that influence the well-being of aquatic organisms or culture yield [56]. In this study, survival was not an indicator for choosing the favorable growth temperature of L. variegatus because there were no significant differences in survival rates among the experimental temperatures. The only mortality was observed in sea urchins exposed to 26°C, but it was attributed to the manipulation of the animals.
4.1.1. DO Consumption Rate
The changes in DO level in the seawater of the experimental aquarium confirms that L. variegatus, unlike most sea urchins, exhibits diurnal behavior [42]. A lower concentration of oxygen was measured in the seawater, parallel to a greater movement of the tube feet, spines, and Aristotle’s lantern, as well as increased tank coverage, displacement, and feeding behavior during the daytime hours (8:00h–16:00h). Meanwhile, during twilight or nighttime hours, the DO concentration in water was higher, coinciding with lower animal activity levels. In this case, the three tested temperatures and oxygen concentration positively influenced the metabolism and welfare of animals. As stated by Fry [57], temperature and oxygen are strong controlling and limiting factors of fish metabolism, and they interact through their joint effect on the metabolic scope. In addition, knowing the type of behavior (diurnal or nocturnal) and, in particular, the time of the day when the individuals are most active, would allow us to improve the results of cultured aquatic species by feeding the animals at the right time. This increases production and decreases food waste, as has been reported by many authors for fish and crustaceans [58, 59].
Several researchers have investigated oxygen consumption in sea urchins. Their findings indicate that specific oxygen consumption decreases with increasing size and increases with rising temperature. However, other studies have shown that oxygen consumption remains relatively unaffected by temperature within specific temperature ranges [60–64]. Future studies should be conducted to determine the oxygen consumption of L. variegatus at various temperatures in order to clarify whether it is temperature-dependent.
4.2. TP
The TP of the species varies according to their thermal history record, so the preferred temperature will be directly related to favorable growth. A change in the seawater temperature of the medium in which they are found triggers an adaptive response of the animals’ physiological processes. Furthermore, the TP will depend on factors such as age, sex, time of year, body status, species, etc. [65]. Therefore, each species will have a characteristic thermal range; for example, females of Poecilia sphenops prefer temperatures around 30°C, while males of the same species prefer 28°C [66]. On the other hand, juvenile Holothuria scabra prefer acclimation temperatures ranging from 24 to 27°C [67] and Kumara et al. [68] defined an optimal temperature range of 26–29°C for larva and animals of the same species. Thus, the selection of a temperature of preference allows organisms to adapt to new environments with characteristics similar to their natural habitat, in order to feed or reproduce [66].
Several authors have stated that the TP of many aquatic species is primarily a function of the thermal history of the individuals’ acclimation [1, 2, 66]. The TP was established at different acclimation temperatures in sea urchins cultured within a thermal gradient in a controlled environment. According to Johnson and Kelsch [69], when species that live in areas with low annual thermal fluctuations are exposed to seasonal temperature variations, they will choose temperatures of preference independently from those of acclimation. However, this was not the case for the native sea urchins, commonly found in tropical areas, as the acclimation temperature had an influence on the preferred temperature of this species. We found that juvenile L. variegatus opted for temperatures in the thermal gradient that were near those used for acclimation, confirming what has been reported by Fry [70], who stated that TP is influenced by the acclimation temperature.
4.3. Thermal Tolerance
The thermal tolerance was determined through the CTmax, at which the sea urchins withstood maximum temperature variations of 14°C (22°C), 12°C (24°C) and 10°C (26°C). Variations in the CTmin were smaller, withstanding temperature decreases of 11°C (22°C), 13°C (24°C) and 10°C (26°C). Sea urchins acclimated to 26°C and exposed to low critical temperature (LCT) and high critical temperature (HCT) had the same thermal tolerance (10°C).
Sea urchins have a greater resistance to increased rather than decreased seawater temperature. Vinagre et al. [71] showed differences in HCT in tropical versus temperate species, as species that live in tropical areas had higher rates of HCT than those living in temperate zones. The former, however, face the greatest risk in light of the current projections for global warming, because tropical species inhabit areas with temperature ranges closer to their upper thermal limits. The minimum and maximum critical temperatures are the average thermal points at which locomotive activities as a whole become destabilized; the organism loses its ability to escape a threatening condition—a constant rate of increase or decrease from a previous acclimation temperature—that ultimately results in its death [37].
After increasing or decreasing the temperature by 4°C, juvenile sea urchins exposed to the critical temperatures adopted different body positions. In HCT, they started crawling up and down the aquarium walls, whereas in LCT, they showed decreased movement of Aristotle’s lantern, mouth coverage, and retracting of the tube feet. Sea urchins exposed to the increase in temperature lost their adhesion capacity and exhibited reduced movement of Aristotle’s lantern, spines, and tube feet at 36°C. On the other hand, those exposed to the decrease in temperature were at the bottom of the aquarium and had lost their ability to move at 11 ± 1°C. Similar results were also obtained by McClintock [42]. These authors found that chronically exposing L. variegatus to 32°C altered behaviors associated with the functioning of the Aristotle’s lantern, the tube feet, and the spines (e.g., the lantern reflex). These effects have been widely documented. However, the reason for this behavior remains speculative, but it is attributed not only to temperature but also to abiotic and biotic factors (pH, diseases, among others). Other similar neuromuscular-driven responses (e.g., righting response) can be used as organismal level “indicators” of the sea urchin’s ability to protect itself from UV radiation [42, 72].
As they are exposed to increasing temperatures, adult Strongylocentrotus franciscanus [37] have been reported to go through a behavioral sequence that can be divided into five stages, starting from active movement to its loss. This sequence was also observed in this study. However, the thermal performance and behavior of all animals will not be exactly the same, as it will depend on different factors like exposure time, age, size, and species, among others [37].
4.3.1. Ion Concentrations
Thermoregulation studies in osmotically challenged echinoderms are scarce, and progress on this topic has been limited. Most echinoderms are osmoconformers, and their internal osmolarity changes are influenced by different biotic and abiotic factors [73, 74]. Temperature is one of the factors affecting osmoregulation [37]. It alters the permeability of the membrane causing changes in the flow of seawater, as well as of potassium, sodium and chloride ions, which contribute to the regulation of osmotic pressure and basic acid balance, as is the case of L. variegatus.
L. variegatus is an osmoconformal and isosmotic species, which shows no difference between internal ion concentrations in relation to seawater [55]. Binyon [75] evaluated the ionic regulation of the starfish Asterias rubens L., showing that the ion concentrations in the body fluids of this echinoderm were almost identical to those of seawater. It is likely that the concentrations in sea urchins were close to those of the external medium. In turn, Vidolin et al. [73] evaluated Na+, Cl–, K+, and Mg+ concentrations at different salinities in L. variegatus, Echinometra lucunter, and Arbacia lixula. At 35 ppm, the authors found 479 mmol Na+, 559 mmol Cl–, and 10.2 mmol Mg+, while lower values were found for all these ions at CTmin and CTmax. Potassium values, on the other hand, were higher. The authors explained why echinoderms cannot be fully estuarine or freshwater animals, pointing out that there are distinct responses to ions, depending on the species, habitat, or size. As stated above, a constant decrease in the seawater temperature of the culture resulted in significant changes in the concentration of all the ions analyzed, while its increase only modified the concentrations of Cl– and K+ ions. A decrease or increase in the ambient temperature affects the organisms’ biological rates, causing physiological disorders, triggering an osmotic pressure increase in their body fluids in order to avoid cell rupture, and forcing urchins to retain both organic and inorganic solutes [37, 76, 77].
Chloride concentration values were altered in sea urchins exposed to CTmax and CTmin. A difference of 35 ± 8 mmol/L was found between the control sea urchins and those exposed to an increase and decrease in temperature. According to Bishop et al. [55], these differences may be the same that exist with respect to the extracellular fluid, as they occur as the result of an effort of the cells to maintain the ionic concentrations (Donnan equilibrium). In addition, osmotic stress can disrupt osmotic equilibrium by modifying the diffusion of ions through membrane channels, causing mortality due to the loss of one or more specific ions. In our experiments, we observed no mortality in the sea urchins. On the other hand, according to Kurbel [78], active transport of sodium and potassium maintains the intracellular concentrations of these ions constant in order to maintain the cell volume, transepithelial potential, cytoplasm, and an appropriate ionic environment. High potassium and low sodium concentrations thus allow for the stability of the organic macromolecules that constitute the enzymatic, genetic, and mechanical machinery. However, low chloride values are attributed to the increase and decrease in temperature since these influence the transport of ions through cell membranes, affecting their homeoviscous adaptation, which is responsible for maintaining membrane fluidity at all times.
In conclusion, experimental seawater temperatures influenced sea urchin SGR and survival. Aquaculture farmers can raise sea urchins in waters between 22 and 24°C, but not in waters with a temperature of 26°C or higher, and the animals should be fed during daylight hours. The authors suggest 22°C as the most favorable farming temperature, as it demonstrates superior SGRs in this thermal environment. L. variegatus showed greater tolerance to increasing than to decreasing temperatures: they are able to withstand a greater range of temperature increase (up to 14°C above the acclimation temperature) as compared to those exposed to a reduction of the temperature (as much as 12°C below the acclimation temperature).
Native sea urchins L. variegatus face a great risk, in light of the current projections for global warming, since tropical species inhabit areas with temperatures closer to their upper thermal limits and are not able to adapt to temperatures higher than 26°C.
Conflicts of Interest
The authors declare no conflicts of interest.
Funding
This work was supported by a Fonciencias Grant from the vice-chancellor’s research office at the Universidad del Magdalena.
Acknowledgments
This work was supported by a Fonciencias Grant from the vice-chancellor’s research office at the Universidad del Magdalena. The authors would like to thank sea urchin fisherman Jorge Polo, who helped to collect echinoderms and to the Research and Technological Development Group in Aquaculture (GIDTA).
Open Research
Data Availability Statement
The data that support the findings of this study are available from the corresponding author upon reasonable request.


