Tenacibaculosis Caused by Tenacibaculum maritimum Is Not Transmitted From Atlantic Salmon (Salmo salar L.) to Canadian Chinook Salmon (Oncorhynchus tshawytscha W.) in a Cohabitation Model
Abstract
Canadian salmonid aquaculture provides a sustainable protein source; however, there are concerns that Atlantic salmon (Salmo salar L.) mariculture reduces wild Pacific salmon survival through interspecific disease transfer. Tenacibaculosis, caused by species of Gram-negative bacteria in the genus Tenacibaculum, has the potential to be transmitted interchangeably between farmed Atlantic salmon and wild Pacific salmon, though there is a lack of corroboration establishing transmission. To provide evidence for interspecific horizontal transmission of tenacibaculosis from Atlantic salmon to Pacific salmon, Atlantic salmon were bath-exposed to an isolate of Tenacibaculum maritimum and cohabitated with naïve Atlantic or Chinook salmon (Oncorhynchus tshawytscha W.) for 25 days. Exposed and naïve cohabitant Atlantic salmon exhibited morbidity with multifocal superficial and ulcerative epidermal lesions with intralesional T. maritimum (culture, histology, and qPCR). At 108 CFU mL−1, exposed and naïve cohabitant Atlantic salmon had 43% and 60% mortality, respectively. Contrastingly, cohabitant Chinook salmon experienced no morbidity or mortality, despite successful culture of T. maritimum (108 CFU mL−1n = 5/6 fish; 106 CFU mL−1n = 0/6 fish) from skin swabs. These findings suggest that BC Chinook salmon do not develop clinical tenacibaculosis through interspecific horizontal transmission from farmed Atlantic salmon with mouthrot under the tested conditions and that the presence of T. maritimum alone is insufficient for disease. Further research needs to clarify the genetic differences between hosts and pathogens in different geographical locations, and investigate additional T. maritimum isolates, alternative Tenacibaculum species, environmental variables, and temporal scales that could lead to clinical tenacibaculosis in Chinook salmon.
1. Introduction
Aquaculture is an increasingly productive form of agriculture, particularly since wild-caught fisheries are overutilized [1], and captive-cultured species represent a potentially sustainable long-term source of protein. Aquaculture practices offer numerous benefits [1, 2], with the highest conversion ratio of provided feed to gained flesh weight [3] and one of the lowest carbon usages among all agricultural practices [4]. However, interpretations of environmental sustainability regarding aquaculture practices are complex, with polarized outcomes [5–7]. Canada is the fourth largest producer of aquaculture salmon [8], with the Canadian industry generating a billion dollars annually [9]. Declines in salmon production in Canada are occurring due to “government-mandated farm closures in British Columbia” [10], surrounding concerns that Atlantic salmon (Salmo salar L.) aquaculture negatively influences wild Pacific salmon (i.e., Chinook, coho, pink, sockeye, and chum salmon [11, 12]) populations in BC [13].
One perceived concern is that S. salar transmit diseases to wild Pacific salmon, resulting in reduced survivability [13–16]. Tenacibaculosis was initially used to describe disease induced by the marine bacteria Tenacibaculum maritimum [17], but the term has been expanded to encompass disease caused by the genus, given similar clinical presentations induced by multiple species [18–20]. Tenacibaculum species are opportunistic, obligate marine bacteria found on healthy and diseased organisms, with current theories of infection influenced by dysbiosis [21, 22]. Diseases associated with Tenacibaculum species are reported globally among innumerable marine species, from algae to fish [23]; with several peer-reviewed articles describing Tenacibaculum bacteria on diseased farmed Pacific salmon from the United States [24], Chile [25], and New Zealand [26–28].
Tenacibaculum species are abundant around stocked S. salar netpen sites [29, 30], and when members of the genus, like T. maritimum, are detected using qPCR on BC Chinook salmon (Oncorhynchus tshawytscha W.), there is a negative perceived association with size and survival [31]. Controlled laboratory experiments may aid in inferring the pathogenicity of T. maritimum to BC Chinook salmon, as controlled experiments can reduce environmental influences, help establish more direct evidence of pathogenicity and infectivity [32–34] and add context to epidemiological observations [35]. In the single experimental study performed in the Americas (i.e., Chile) with Tenacibaculum using a bath-immersion model and coho salmon (Oncorhynchus kisutch W.), no morbidity or mortality was reported [36]. However, morbidity in farmed Chilean coho salmon associated with Tenacibaculum species has been reported based on bacterial cultures, 16S rDNA sequencing, and multi-locus sequence analysis [25]. Contrarily, another study demonstrated the susceptibility of farmed O. tshawytscha to T. maritimum and T. dicentrarchi through bath immersion in New Zealand [28]. Despite a critical need, there are no investigations into Pacific salmon susceptibility to tenacibaculosis through exposure models in Canada. Further, no research to date has studied interspecific transmission of tenacibaculosis from any two fishes using in vivo laboratory practices. Intraspecific studies on tenacibaculosis transmission have focused on S. salar, and when using BC-derived bacterial isolates, research has utilized bath-immersion exposures to T. maritimum [19, 37], T. dicentrarchi [19], and T. finnmarkense [19] paired with naïve fish cohabitation. In these studies, clinically afflicted S. salar displayed variously severe epidermal ulcerations and yellow plaques, often associated with the mouth, gill, and flank [19, 37].
Given the lack of research investigating interspecific transmission of tenacibaculosis from BC farmed S. salar to wild Pacific salmon, the objective of this research was to expose Atlantic salmon to T. maritimum using previously established methods [19] and interpret the potential for transmission of the resultant bacteria and disease to Pacific salmon. This work focused specifically on O. tshawytscha, given their widespread production and cultural importance in BC.
2. Methods
2.1. Animal Ethics Statement
All methods involving animals occurred at Vancouver Island University (VIU, Nanaimo, BC, Canada) following the Canadian Council on Animal Care guidelines and was approved under an institutional animal use protocol (AUP; #102059).
2.2. Fish Collection and Husbandry
All fish were from T. maritimum-free facilities and held in a T. maritimum-free facility until the exposure. The Department of Fisheries and Ocean’s (DFO) Tenderfoot Creek Hatchery (Squamish, BC) provided smolted freshwater O. tshawytscha (n = 130, ~14 g). This population of O. tshawytscha belongs to the Cheakamus stock and is under the stock conservation unit index of CK-20; all fish are from wild-caught broodstock. Fish welfare, temperature (°C), and dissolved oxygen (% saturation and mg × L−1) were recorded every 30 min during transport. Upon arrival at VIU, fish were split into two full saltwater (~26.3 g × L−1) recirculating aquaculture systems (RAS) in two of four connected 200 L tanks for 2 weeks. Twenty-four hours before the bacterial exposure, smolted S. salar (n = 110, ~145 g, at 3 g × L−1 salinity) were collected from Mowi Canada West’s Big Tree Creek Hatchery (Sayward, BC), transported, and split into the remaining 200 L tanks like O. tshawytscha. For all fish transfers between tanks (see Post-Exposure and Post-Trial sampling), a maximum of 10 fish were moved at a time using disinfected, saltwater dipped nets and buckets of aerated saltwater.
Throughout the experiment, fish resided in saltwater RAS system tanks with 12 h light and dark cycles in humidity and temperature-controlled rooms. Water was UV-treated (35 mJ × cm−2) and monitored in real-time for dissolved oxygen (97.0% ± 3.42% saturation [average ± standard deviation]), flow (L × hr−1), pH (7.89 ± 0.21), oxidative reductive potential (282.4 ± 50.84), salinity (26.3 ± 0.91 g × L−1), and temperature (11.4 ± 0.71°C). Each tank connected to the RAS had an air-stone to ensure an oxygenated water supply. Water changes occurred to keep ammonia, unionized ammonia, and nitrite less than 1, 0.0125, and 1 mg × L−1, respectively, with saltwater collected directly from Departure Bay at the DFO’s Pacific Biological Station (Nanaimo, BC). Assessments of fish health occurred thrice daily by research personnel and two times daily by Animal Care staff. Fish were fed 1% body weight per day, using 1 and 3 mm pellets (Skretting) for O. tshawytscha and S. salar, respectively.
2.3. Bacterial Information and Propagation
The T. maritimum isolate (2.1C) used in this study was collected from an S. salar mouthrot outbreak in BC and was previously used in a prior intraspecific S. salar exposure trial [19]. Core-genome alignments and MLST indicated that this isolate belongs to one of two existing BC T. maritimum clades, the TmarCan2 clade described by Frisch et al. [38] (data not shown). The same putative virulence factors of T. maritimum NCIMB 2154T [39] were reported in this isolate using local BLAST comparisons [40]. Briefly, the isolate was cultured in Flexibacter maritimus media (30 g × L−1) supplemented with kanamycin (FMM + K) at 12°C, and diluted to an A600 of 0.025 and 0.535, corresponding to ~108 and 1010 CFU mL−1. Culture purity was determined using morphology, Gram-stains, and a species-specific qPCR assay for T. maritimum [19, 41].
2.4. Naïve Fish Sampling (Pre-Exposure)
Pre-exposure sampling of 10 naïve S. salar and O. tshawytscha occurred to establish a baseline health status of both fish populations immediately before the exposure. Euthanasia was conducted using a two-step process as outlined by the Canadian Council of Animal Care guidelines [42]: overdose using tricaine methanesulfonate (Syndel, Ferndale, WA, USA) buffered with sodium bicarbonate, followed by a blunt strike to the head. After euthanasia, fork-length and weight of each fish were measured, with Fulton’s condition factor calculated [43], and blood was collected via caudal venipuncture into lithium heparin coasted (0.1 mL of ~200 USP × unit−1 [Sigma-Aldrich, St. Louis, MO, USA]) syringes. During necropsy examination of each fish, gross lesions were assessed using a categorical scoring system (Table 1). The number of scored lesions and the cumulation of lesion scores were used to infer severity, with cumulative values greater than 1 used to indicate morbidity.
| Lesion scoring system | Lesion category | |||
|---|---|---|---|---|
| 1 | 2 | 3 | ||
| Includes | Erosion, scale-loss, edema | Ulcerations that penetrate the basement membrane | Deep ulcerations exposing muscle, cartilage, and/or bone | |
| Score | 1 | Unifocal | Unifocal | Unifocal |
| 2 | Multifocal | Multifocal | Multifocal | |
| 3 | Regionally extensive (over 20% of fish) | Regionally extensive (over 20% of fish) | Regionally extensive (over 20% of fish) | |
- Note: Scores only focused on external surfaces of the fish, excluding the gill.
Sterile, single-use inoculating loops were used to isolate potential bacteria from the jaw, gill, spleen, kidney, and up to four external lesions (if present) on FMM + K and incubated at 18°C. Bacterial isolates with T. maritimum-like morphologies were selected, re-streaked for isolation, and grown in FMM + K broth for storage and qPCR testing (see details below). Isolates were frozen at −80°C in FMM + K broth with 25% glycerol.
From each fish sampled, a tissue section of the jaw, skin, gill, spleen, and kidney was placed in 500 µL of RNALater (Invitrogen [Thermo Fisher Scientific], Waltham, MA, USA) using sterile dissection equipment for downstream applications. RNALater preserved tissues were refrigerated at 4°C for 24 h and then stored at −80°C until needed. Finally, tissue sections of both species (bisected head or jaw, gill, skin, liver, spleen, and, when possible, the kidney) were placed in 10% neutral buffered formalin (Surgipath, Richmond, IL, USA) for downstream histopathological examination.
2.5. Hemoglobin Concentration and Osmolality
Immediately following blood collection, a 2 µL aliquot was placed in a separate tube and refrigerated, and the remaining blood was centrifuged (16 K rcf, 18°C, 10 min) to collect plasma. For hemoglobin concentration, each 2 μL aliquot of heparinized blood was diluted in 198 µL molecular grade H2O and subjected to a hemoglobin colourimetric assay (Hemoglobin Assay Kit [Sigma-Aldrich, St. Louis, MO, USA]) according to the manufacturer’s guidelines, except that micro-cuvettes were used with 400 µL of reagent and 100 µL of diluted blood sample. Absorbance (400 nm) was read for each sample (Eppendorf BioSpectrometer, Model 22331 Hamburg, Eppendorf, Hamburg, Germany). Osmolarity was determined using vapor-pressure osmometry (VAPRO, Model 5600, ELITechGroup Inc., Logan, UT, USA) and 10 μL of plasma was loaded onto membranes as described in the provided guidelines. Excess plasma was stored at −20°C.
2.6. Bath Immersion Exposure
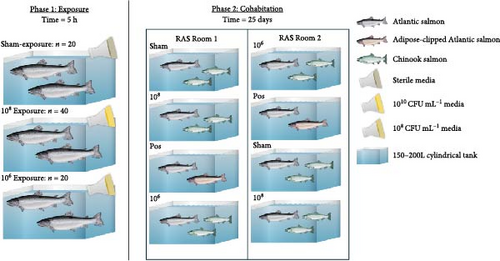
Static bath exposures of Atlantic salmon (n = 80) were accomplished in three isolated (i.e., not part of the RAS system) 150 L tanks containing saltwater (~26 g × L−1) (Figure 1). Twenty S. salar were exposed to 700 mL of sterile FMM + K (sham control). Twenty S. salar were exposed at 106 CFU mL−1 (using 350 mL of bacterial culture at 109 CFU mL−1 at an A600 of 0.025), and 40 S. salar were exposed at 108 CFU mL−1 (using 700 mL of bacterial culture at 1010 CFU mL−1 at an A600 of 0.535). Each tank was covered and aerated through an air-stone. The sham-control exposure occurred in a separate room to prevent aerosol contamination. The exposure occurred for 5 h at ~11.0°C, wherein visual fish welfare checks, including temperature (°C), and dissolved oxygen (% saturation and mg × L−1) occurred every 30 min.
2.7. Post-Exposure and Post-Trial Sampling
Post-exposure fish were transferred equally between two identical environmentally controlled RAS rooms containing four 200 L tanks (Figure 1). Each tank consisted of either 10 sham-exposed S. salar that cohabitated with 20 naïve O. tshawytscha, 10 S. salar exposed to 106 CFU mL−1 that cohabitated with 20 naïve O. tshawytscha, 10 S. salar exposed to 108 CFU mL−1 that cohabitated with 20 naïve O. tshawytscha, and 10 S. salar exposed to 108 CFU mL−1 cohabitated with 10 naïve adipose-clipped S. salar (Figure 1). Tank assignments were randomly generated for each room. Post-exposure, moribund and dead fish were removed, euthanized if needed, and processed as described above (see Naïve Fish Sampling [Pre-Exposure] and Hemoglobin Concentration and Osmolality). Post-trial (i.e., 25 days) 10 fish of each treatment from each tank (if remaining) were euthanized and used for morphometric measurements (length and weight), while three haphazardly selected fish were necropsied processed as described above.
2.8. DNA Extractions
DNA from jaw and kidney tissues was isolated using an Omega E.Z.N.A tissue DNA extraction kit (Omega Bio-tek, Norcross, GA, USA) according to the manufacturer’s protocol with the following minor modifications: ~10 mg of kidney tissue was used for each extraction in contrast to the recommended 30 mg; and elution volumes were 100 µL. All extracted DNA was verified through spectrophotometry (A260/280, 260/230) and standardized to 14.5 ng × µL−1 using DEPC-treated molecular grade water (Sigma-Aldrich, St. Louis, MO, USA).
2.9. qPCR Application
Extracted tissue (jaw and kidney) DNA and suspended bacterial isolates underwent a species-specific 16S rDNA qPCR in a CFX96 thermocycler (Bio-Rad, Hercules, CA, USA) to identify and quantify T. maritimum [19, 41] (Table 1). For the application of qPCR, a single 20 µL reaction used 10 µL of probes master mix (Roche, Basel, Switzerland), 1 µL of MAR-4 forward primer (10 µM; 5′-TGCCTTCTACAGAGGGATAGCC-3′; Millipore Sigma), MAR reverse primer (10 µM; 5′-CTATCGTTGCCATGGTAAGCCG-3′; Millipore Sigma), and MAR probe (1 µM; 5′ FAM-CACTTTGGAATGGCATCG-BHQ1 3′; Eurofins Genomics), and 7 µL of DNA (14.5 ng × µL−1) or bacterial suspension (7 µL of each isolate suspended and diluted 3.5-fold in molecular H2O). The thermal profile consisted of 95°C for 15 min and 40 cycles of 95°C for 30 s and 52°C for 30 s. Extracted tissue samples were tested in triplicate for quantification, while bacterial isolates were tested in duplicate for identification. Each plate included a no-template control (7 µL of molecular grade H2O) and a positive control (DNA of the isolate utilized). A cycle quotient of 35 or less with a maximum standard deviation of 0.3 between technical replicates was used to interpret a positive reaction and used for further comparison. Relative bacterial loads were inferred by comparing differences in cycle quotients, with a difference of 3.3 representing a 10-fold difference.
2.10. Histopathology
Formalin-fixed tissues representing fish pre-exposure, post-exposure, and post-trial were processed, paraffin-embedded, sectioned (7 μm), and stained (hemotoxylin and eosin and Gram–Twort staining [44]) by a commercial laboratory (BC Centre for Aquatic Health Sciences, Campbell River, BC). Each cassette contained sections of jaw, gill, skin, muscle, and spleen.
2.11. Statistics
Statistical analysis was performed in R-Studio (version: Chocolate Cosmos, 2024.04.1, Build 748) [45]. A one-way ANOVA compared fish morphometries (i.e., weight, length, and Fulton condition factor), hemoglobin, osmolarity, mortality, and the Cq of the T. maritimum specific assay in each tissue between species (i.e., S. salar and O. tshawytscha), time points (i.e., pre- or post-exposure and post-trial), and treatment (sham [0], 106 CFU mL−1, 108 CFU mL−1). A Shapiro-Wilcoxon test and Levene test (car package) occurred to validate assumptions of an ANOVA; if violated, transformations occurred to meet the assumptions if possible. The above metrics underwent a correlation test against cumulative lesion scores to generate Pearson’s product-moment correlation to infer relationships between body or blood condition to lesion burden. A Kaplan-Meier analysis occurred to compare the probability of survival over time. All reported averages include the standard deviation.
3. Results
3.1. Feeding, Body Size, and Condition
All O. tshawytscha readily ate feed 24 h after transport to VIU until the end of the trial. S. salar involved in the sham exposure started to feed on day 7 of the 25-day trial. S. salar exposed at 106 CFU mL−1 began to feed on day 19, and the 108 CFU mL−1 treatment (exposed and cohabitant) did not show interest in feed for the entirety of the trial.
Overall, pooling each fish species together from pre-exposure to post-trial, S. salar were longer (23.6 ± 1.64 cm, F1,179 = 2710, p < 2e − 16), heavier (127 ± 25.6 g, F1,179 = 1180, p < 2e − 16), and had a lower condition factor (0.961 ± 0.0832, F1,179 = 79.94, p = 4.73e − 16) than O. tshawytscha (12.3 ± 0.976 cm, 20.9 ± 4.95 g, 1.10 ± 0.125). S. salar that died post-exposure (i.e., during the trial) were shorter (F2,107 = 4.743, p = 1e − 2, 22.9 ± 1.61 cm) and lighter (F2,107 = 8.241, p = 5e − 4, 114 ± 21.8 g) in comparison to S. salar pre-exposure (24.5 ± 1.57 cm, 145 ± 28.2 g) and post-trial (23.7 ± 1.57 cm, 130 ± 24.5 g) (Figure 2). Among treatments post-trial, sham control S. salar were heavier (F2,65 = 3.194, p = 0.0495, 140 ± 23.1 g) than S. salar involved at 106 and 108 CFU mL−1 exposures and cohabitation (106: 120 ± 22.3 g, 108: 130 ± 24.8 g), with no differences in length (F2,65 = 2.003, p = 0.143) (Figure 1). There were also no differences in condition factor among S. salar over time points (F2,107 = 1.856, p = 0.161) or treatments post-trial (F2,65 = 1.684, p = 0.194).


Post-trial O. tshawytscha were longer (F1,69 = 47.05, p = 2.4e − 9, 12.6 ± 0.788 cm) and heavier (F1,69 = 50.14, p = 9.5e − 10, 22.2 ± 4.01 g) than pre-exposure fish (10.8 ± 0.513 cm, 13.1 ± 1.88 g), with no differences in condition factor (F1,69 = 3.695, p = 0.0587) (Figure 2). There were no differences among O. tshawytscha between different treatments post-trial, comparing length (F2,58 = 0.2311, p = 0.108), weight (F2,58 = 0.422, p = 0.658) (Figure 2), and condition factor (F2,58 = 2.196, p = 0.12).
3.2. Mortality, Morbidity, and Clinical Signs of Infection
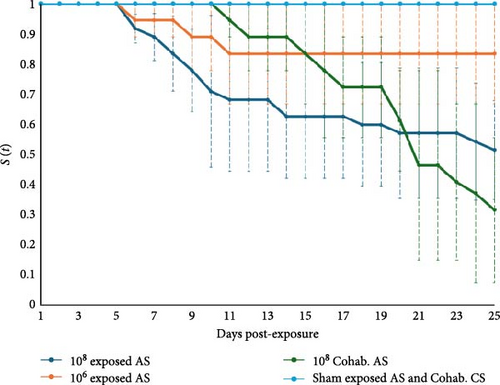
No mortality occurred in sham-exposed S. salar and naïve cohabitant O. tshawytscha (in any tank or treatment [i.e., sham, 106 or 108 CFU mL−1]), with a probability of survival to day 25 of 1 (Figure 3). Atlantic salmon exposed at 106 and 108 CFU mL−1 had 15% ± 15% and 43% ± 13% mortality, and a probability of survival to day 25 of 0.83 and 0.51, respectively (Figure 3). Naïve S. salar cohabitants grouped with 108 CFU mL−1 exposed fish had 60% ± 20% mortality and a probability of survival to day 25 of 0.31 (Figure 3). An ANOVA indicated differences in mortality between treatments (F5,10 = 8.8, p = 0.002) and the resultant Tukey test generated 3 different groups (group 1: Sham-exposed S. salar and naïve cohabitant O. tshawytscha; group 2: S. salar exposed at 108 CFU mL−1 and S. salar cohabitants at 108 CFU mL−1; and group 3: S. salar exposed at 106 CFU mL−1). Among O. tshawytscha, there was no mortality or morbidity reported (Figure 3).
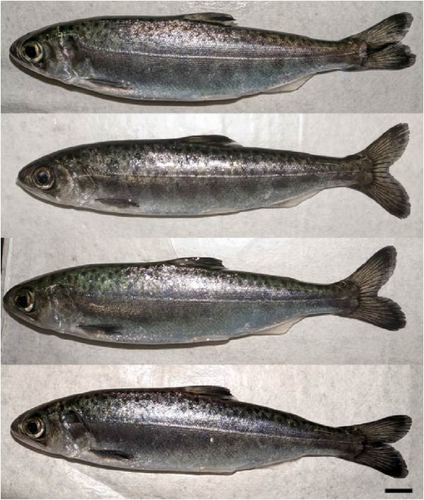
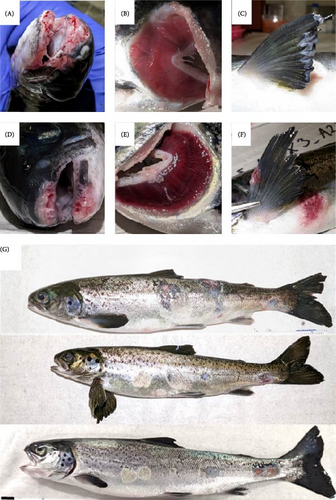
No morbidity (lesion scores ≤ 1) was reported among sham-exposed S. salar post trial with an average lesion score of 0.5 ± 0.5. No morbidity was also reported among O. tshawytscha in any utilized treatment, with a lesion score of 0.008 ± 0.091 (Figure 4). Morbidity of S. salar involved in bacterial exposures was at or above 75%, with an average lesion score of 3.58 ± 1.68. Gross examination of moribund and deceased S. salar revealed multifocal to regionally extensive, moderate to severe epidermal erosions and ulcerations on the jaws, fins, and flanks (Figure 5). On several fish, epidermal lesions possessed a pale, yellow-tinged film or plaque covering the exposed surface, and gill lesions were characterized by small to moderate sized, raised, pale yellow plaques, and multifocal erosion at the distal tips of scattered filaments (Figure 5).
3.3. Histopathology
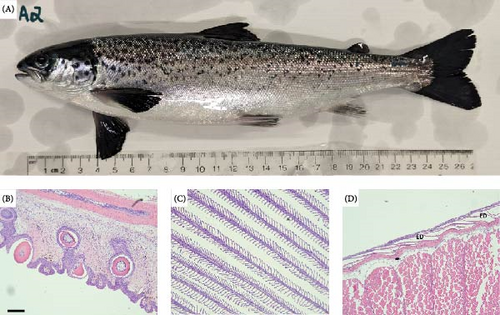
Histopathology of pre-exposure S. salar (Figure 6) and O. tshawytscha identified few, very mild lesions among jaw, gill, and skin tissues. Histopathological lesions identified among Atlantic salmon include very mild, focal to multifocal branchitis, and mild, edematous expansion of scattered scale pockets (Figure 6).
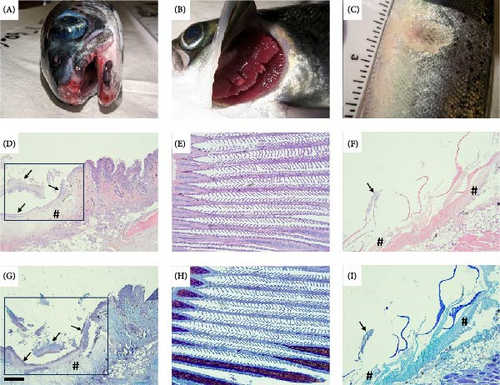
Histopathology of oral lesions in bath-exposed and cohabitant S. salar varied in severity, with most fish exhibiting regionally extensive, severe erosive and ulcerative lesions accompanied by intralesional mats of thin, elongated, rod-shaped, Gram-negative bacteria morphologically similar to that of T. maritimum (Figure 7). External oral and flank lesions were characterized by abrupt transition between intact epidermis adjacent to the exposed hypodermis, deep dermis, and frequently exposed bone, and or muscle (Figure 7). Oral lesions were further characterized by multifocal to regionally extensive areas of erosion, epidermal clefting and lifting, to ulcerative loss of epidermis and basement membranes with underlying expansive dermal necrosis (Figure 7). Large and small intralesional mats of bacteria were observed directly lining exposed bone of the vomer, surrounding teeth, and extending into gingival pockets. Moderate to severe hemorrhagic, ulcerative lesions with intralesional mats of Gram-negative filamentous bacteria were also observed in multiple sections of tissue taken from the lateral flank, pectoral, and tail fins of numerous direct exposed and cohabitant Atlantic salmon. Multifocal to locally extensive, mild to moderate necrotizing branchitis accompanied by hydropic degeneration was observed within gill sections in a small number of bath-exposed and cohabitant S. salar (Figure 6).
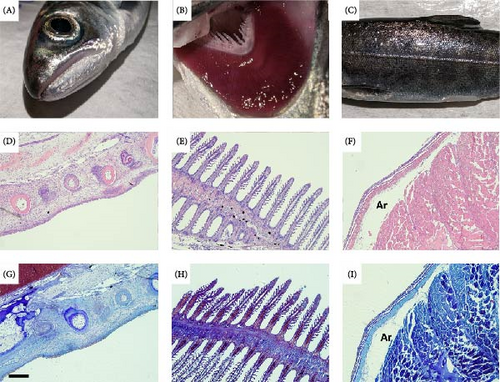
Histopathology of cohabitant O. tshawytscha smolts were all mild in severity and consisted of small focal areas of epidermal erosion in jaw and flank samples and very mild multifocal branchitis on scattered gill filaments (Figure 8). No intralesional bacteria or ulcerative lesions were observed in any of the Chinook salmon histological tissues sections examined.
3.4. Bacterial Isolate Identification
Pre-bacterial exposure, no T. maritimum-like isolates were identified from S. salar or O. tshawytscha skin swabs cultured on FMM + K. However, six Tenacibaculum-like isolates were cultured from pre-exposure skin swabs from S. salar and O. tshawytscha. All isolates were Gram-negative, rod-like to filamentous, yellow, and translucent. All six isolates were tested using qPCR assays targeting T. maritimum, T. dicentrarchi, T. finnmarkense, and T. ovolyticum [41, 46, 47]. Of the six isolates, four were qPCR positive for T. ovolyticum and were cultured from an Atlantic and Chinook salmon from each RAS system pre-exposure, and the other two were negative for all four assays (data not shown).
Post-exposure and trial, 144 isolates were collected. All were Gram-negative, elongated to filamentous rods, pale yellow, with uneven colony edges, and a rippled appearance. Colonies were also mucoid and adhesive on agar plates. All 144 isolates were positive for T. maritimum-specific qPCR assay. Isolates recovered from S. salar primarily originated from the mouth, gill, and external lesions, but 14 isolates were cultured from the spleen or kidney of infected fish. Post-trial, six T. maritimum isolates were collected from five O. tshawytscha (mouth, flank, or gill) involved in the 108 CFU mL−1 treatment.
3.5. Bacterial Presence and Load in Tissues
T. maritimum was not identified using qPCR from pre-exposure S. salar and O. tshawytscha jaw and kidney tissues. Post-exposure, 32/32 S. salar jaws and 12/32 S. salar kidneys were qPCR positive for T. maritimum. Post-trial, 25/29 S. salar jaws and 0/29 S. salar kidneys were qPCR positive. Among O. tshawytscha post-trial, 3/18 jaws and 0/18 kidneys were qPCR positive.
Upon removing fish that were negative for the T. maritimum-specific qPCR assay, T. maritimum bacterial loads in jaw tissues were 1000x greater among S. salar in contrast to O. tshawytscha (F1,56 = 15.9, p = 1.9e − 4; S. salar Cq: 23.7 ± 4.10; O. tshawytscha Cq: 33.5 ± 0.623). Statistical comparison was not possible for kidney tissue bacterial loads as no O. tshawytscha kidney tissues were positive (S. salar Cq: 32.5 ± 1.59). Among S. salar, there were no differences in bacterial loads within tissues between treatments (Mouth: F2,52 = 2.03, p = 0.141; Kidney: F1,10 = 0.046, p = 0.84), between exposed and cohabitant fish (Mouth: F1,53 = 0.517, p = 0.475; Kidney: F1,10 = 0.628, p = 0.446), or between post-exposure and post-trial (Mouth: F1,53 = 2.86, p = 0.097; Kidney: comparison not possible). Statistical comparisons were not possible among O. tshawytscha due to too few positive samples identified using this qPCR assay.
3.6. Hemoglobin and Osmolarity
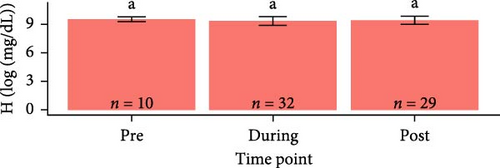
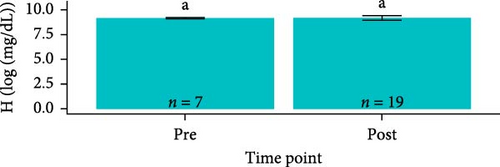
Hemoglobin concentrations required natural log-transformations to maintain normality and homogeneity of variance. Log-transformed hemoglobin concentrations were greater for S. salar compared to O. tshawytscha (F1,95 = 7.242, p = 8.4e − 3, S. salar = 9.41 ± 0.420 [log (mg × dL−1)], O. tshawytscha = 9.18 ± 0.202 [log (mg × dL−1)]). When comparing within S. salar, there were no changes over time (F2,68 = 7.84, p = 0.46); and when comparing treatments post-trial, the sham control S. salar had greater values (9.30 ± 0.249 [log (mg × dL−1)]) than that of the other exposed treatments (F2,26 = 9.259, p = 9.2e − 4, 106 CFU mL−1: 9.08 ± 0.212 [log (mg × dL−1)], 108 CFU mL−1: 9.17 ± 0.221 [log (mg × dL−1)]) (Figure 9). There were no differences among O. tshawytscha over time (F1,24 = 0.122, p = 0.73) and between treatments post-trial (F2,16 = 1.432, p = 0.268) (Figure 9).
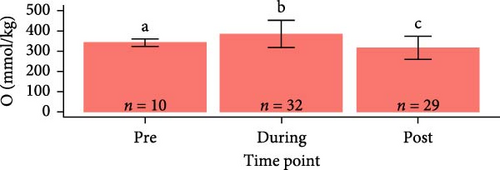


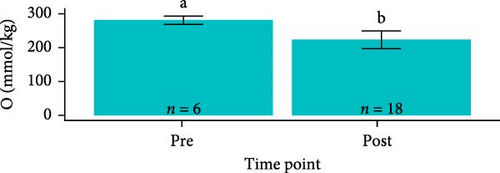


Osmolarity was greater in S. salar than in O. tshawytscha (F1,93 = 45.01, p = 1.5e − 9, S. salar = 363 ± 84.5 mmol × kg−1, O. tshawytscha = 243 ± 39.4 mmol × kg−1). Within S. salar, osmolarity was lower pre-exposure (342 ± 18.4 mmol × kg−1) and post-trial (316 ± 56.7 mmol × kg−1) compared to post-exposure (F2,68 = 13.69, p = 1.01e − 5, 412 ± 92.2 mmol × kg−1). Post-trial, osmolarity was lower among sham-exposed (283 ± 18.0 mmol × kg−1) and 106 CFU mL exposed S. salar (278 ± 38.1 mmol × kg−1) compared to S. salar exposed at 108 CFU ml−1 (342 ± 58.4 mmol × kg−1) (Figure 9). Within O. tshawytscha, osmolarity was lower post-trial (228.26 ± 33.8 mmol × kg−1) compared to pre-exposure (F1,22 = 15.72, p = 6.6e − 4, 286 ± 16.5 mmol × kg−1), with no differences reported post-trial among treatments (F2,15 = 2.675, p = 0.102) (Figure 9).
3.7. Associated Relationships
Among S. salar, there was a weak to moderate linear correlation between cumulative external lesion score compared to osmolarity (R = 0.44, R2 = 0.21, t1,68 = 4.32, p = 5.19e − 5), weight (R = −0.28, R2 = 0.07, t1,107 = −3.02, p = 3.14e − 3), and jaw bacterial load (R = −0.42, R2 = 0.18, t1,52 = −3.35, p = 1.51e − 3). Correlations between lesion scores and other S. salar traits were less than |0.2|. Such correlations were not possible among O. tshawytscha for any utilized trait (weight, length, condition factor, hematocrit, hemoglobin, and osmolarity) due to a lack of observable lesions from all fish in the experiment.
4. Discussion
4.1. Main Findings
This study is the first to demonstrate that BC O. tshawytscha did not develop tenacibaculosis via interspecific horizontal transmission from S. salar with mouthrot under the tested conditions. Throughout this study, morbidity and mortality were only observed among S. salar. Both salmon species, albeit very infrequently for O. tshawytscha, had T. maritimum identified from tissues using qPCR and classic bacterial culturing.
Currently, two other tenacibaculosis exposure studies using Pacific salmon are available to compare against. In Chile, resistance among Chilean coho salmon (Oncorhynchus kisutch W.) was interpreted through direct bath exposure to T. dicentrarchi at 3.78 × 10⁵ CFU ml−1 [36]. However, the same bacterial species was associated with rainbow trout (Oncorhynchus mykiss W.) and coho salmon mortality at netpen sites [25]. Another study demonstrated susceptibility among New Zealand O. tshawytscha due to elevated mortality, paired with macroscopic and histopathological examination, and species-specific droplet digital PCR using direct bath exposure to T. maritimum (2× 10⁸ cells × mL−1) and T. dicentrarchi (2× 10⁷ cells × mL−1) [27]. Differences in susceptibility among O. tshawytscha between Kumanan et al. [28] and the current study could be related to: the host (e.g., the lineage of Chinook salmon); bacteria (e.g., species and strain); experimental methods (e.g., use of naïve cohabitants [this study]; density of exposed fish (17–34 kg × m−3 [this study] vs. 60 kg × m−3 [28])); and environmental parameters like salinity (26 g × L−1 [this study] vs. 35 g × L−1 [28]) and temperature (11°C [this study] vs. 17°C [28]). Outbreaks associated with T. maritimum as observed in New Zealand Pacific salmon farms are not observed in Canada, with no Pacific salmon producers reporting issues associated with tenacibaculosis [48]. A lack of BC Chinook salmon presenting with tenacibaculosis from wild populations, production practices in situ, and results from this study, unlike New Zealand, would support a difference based on geography (i.e., Canada vs. New Zealand), potentially due to a single or combinative effect of the host, pathogen, and environment.
T. maritimum identified from New Zealand cultured O. tshawytscha comprises nine sequence types using MLST (19, 21, 178, 179, 186, 187, 188, 190, 191), three serotypes (O-AGC types: 2-1, 3-2, 3-0), and three clades (B-anz1, B-anz4, B-anz5) [49]. In Canada, the diversity of T. maritimum identified from S. salar includes two conserved clades (TmarCan1 and TmarCan2) and sequence types inferred through MLST (STCan1 and STCan2) [38]; recently supported through core-genome alignments of 30 BC T. maritimum isolates (data not available). It is unknown if there are different virulence factors between geographical groups of T. maritimum, as no studies have fulfilled Falkow’s molecular postulates [50]. Putative virulence factors described by Perez-Pascual et al. [39] have been identified in Canadian T. maritimum isolates, including 2.1C [40] used in this experiment. With greater diversity among New Zealand isolates relative to Canada and a gap in known virulence factors, the potential for increased pathogenicity based on geography could exist.
No salmonids naturally occur in the southern hemisphere; New Zealand Chinook salmon were transplanted from California (USA) and have been cultured for decades in a novel environment [51]. Chinook salmon used in this study are endemic to BC, of the Cheakamus stock, under the stock conservation unit index of CK-20. No study has compared the genetic divergence of the New Zealand Chinook salmon in contrast to North American counterparts. Potential mechanisms resulting in tenacibaculosis in BC S. salar and New Zealand O. tshawytscha, relative to this group of BC O. tshawytscha, could include different microbiomes, proteomes, and transcriptomes. Differences may also be due to a mismatch between the host and their endemic environment. Since diseased S. salar and uninfected O. tshawytscha cohabitated together and shared similar diets in this study, where shared environments and diets can help inform similar microbiomes [52–56]; the reduced/lack of T. maritimum in this group of O. tshawytscha may stem from altered regulation of bacterial establishment on external host tissues. Differences in susceptibility among BC Pacific salmon compared to BC cultured S. salar have been described in other viral and bacterial exposure studies. Using similar bath immersion methods to this study, BC sockeye salmon (Oncorhynchus nerka W.) were shown to have altered immune pathways and reduced mortality (≤ 5% mortality) [57] in contrast to S. salar (44% mortality) when using an isolate of infectious hematopoietic necrosis virus (IHNV, genogroup U, isolate BC93-057) [58]. Conversely, mortality may also be isolate-dependent for each host species as other strains of IHNV can induce variable mortality in S. salar [59]. In another study, reduced susceptibility of BC Pacific salmon compared to S. salar was demonstrated using two geographical isolates of infectious salmon anemia virus (Bremnes [Norwegian] at 107, 105, 103 TCID50, or CCBB [Canadian] strain at 107 TCID50) [60]. Similarly, sockeye salmon have also been shown to be more resistant to Piscirickettsia salmonis than S. salar or pink salmon [61]. Overall, there is not enough research between Canadian and New Zealand O. tshawytscha to inform host-influenced susceptibility.
Regarding the environment, high fish density (other fish disease models [62–64]) and alterations of water parameters (e.g., temperature, salinity, and dissolved oxygen [tenacibaculosis [18, 22, 30, 65, 66]]) can have key roles in the alteration, occurrence or absence of fish diseases. Among Pacific Chinook salmon in the field, optimal and lethal temperatures are estimated to be between 12–15°C [67, 68] and ~25°C and above [69–71], respectively. While variable salinities are tolerated among salmonids due to an euryhaline lifestyle, increasing salinity has a higher metabolic demand [72], and others have inferred increased pathogenicity of T. maritimum at higher salinities [17]. Research is also needed to establish how temperature and salinity influence the pathogenicity of Tenacibaculum isolates; currently, one study has informed that lower temperatures (12 and 18°C vs 24°C) but not salinity (25, 29, 33 g × L−1) increased the cytotoxicity of a Canadian isolate of T. maritimum when exposed to an intestinal fibroblast cell line of S. salar (ASimf20) [73]. Higher temperature (17°C), salinity (35 g × L−1), density (60 kg × m−3) and levels of mortality reported by Kumanan et al. [28] and lower temperatures (11°C), salinity (26 g × L−1), density (17–34 kg × m−3), and lack of mortality in this study need to be investigated further to infer environmental associations with mortality. Additional reasons for an absence of tenacibaculosis in this group of O. tshawytscha may include the use of appropriate stressors or a temporal component not achieved in this study. Since Tenacibaculum spp. are opportunistic pathogens, it is critical to establish factors that assist or prevent the development of tenacibaculosis. These stressors could include high-dose direct bath-exposure methods [28]; acclimation to novel environments; smolt transfer and smoltification [74]; interactions with netpen-bound and pelagic communities [41, 66, 75]; and other bacterial agents that may act synergistically to manifest disease [22, 76]. Therefore, it is imperative that more research determine the impact of the environment, host, and bacteria on salmonid susceptibility to tenacibaculosis.
4.2. Influence of Atlantic Salmon Size on Susceptibility to Tenacibaculosis
The mortality of naïve cohabitant S. salar grouped with 108 CFU mL−1 bath-exposed S. salar was 60% ± 20%, with histological, bacteriological, and molecular diagnostic results providing very strong evidence that horizontal transmission of tenacibaculosis between S. salar was successful. There was no statistical difference in mortality between exposed and cohabitant fish at 108 CFU mL−1; however, there was a correlation between cumulative lesion score and weight, and fish that died in the trial were proportionally smaller. Though larger S. salar (≥ 400 g) can present with tenacibaculosis [66, 77], there may be aspects of size that help resist or delay the development of disease. Life history and other traits like size influence the immunity of hosts [78–81]. Intraspecific studies have demonstrated size-related resistance in S. salar to infectious salmon anemia virus [82], Atlantic halibut (Hippoglossus hippoglossus) exposed to Vibrio anguillarum [83], and Nile tilapia (Oreochromis niloticus) exposed to Aeromonas hydrophila [84]. Relationships of size and disease resistance are complex and potentially altered by other variables. Previous work by authors using a similar exposure methodology (i.e., bacterial isolate, densities, and similar environmental conditions) but with smaller S. salar (~30 g), had much greater mortality (< 80%) among all treatments utilizing the same T. maritimum clinical isolate [19]. Comparative RNA-Seq using tissues stored from this study and previous intraspecific S. salar research [19], may inform if hosts respond differently based on size.
4.3. Differences in Acclimatization
Differences in saltwater acclimatization (i.e., 2 weeks for O. tshawytscha vs. 24 h for S. salar) between the two species were used to replicate a more natural transition to saltwater for O. tshawytscha and the abrupt transition of BC-produced S. salar. For example, West Coast populations of O. tshawytscha in North America may spend as little as several days to weeks in estuarine environments before making the transition to ocean environments [85–87]. Tenderfoot Creek Chinook salmon used in this experiment are released into surrounding freshwater river systems and are believed to take up 2 weeks to transition to full saltwater environments (Personal Communication – Salmon Enhancement Program Tenderfoot Creek Hatchery Personnel, 2024). The short acclimatization of S. salar replicates transport practices used by S. salar production companies moving smolts from freshwater or low salinity (i.e., 3 g × L−1) hatcheries to marine netpens [19]. Stress, in this case, a lack of acclimatization, may accentuate and accelerate the pathogenesis of tenacibaculosis in S. salar [19], though other research suggests that a stressor event may not be required [20].
4.4. Impacts of Another Tenacibaculum Species Pre-Exposure
T. maritimum was not identified pre-exposure, but T. ovolyticum was. T. ovolyticum has been infrequently identified on diseased marine fishes [22, 23, 47, 88, 89] and could be considered a putative opportunistic pathogen [23, 89]. Research has also identified T. ovolyticum on sardine eggs that were considered healthy [90, 91], with much lower relative abundances than in afflicted halibut eggs [21]. No research to date has fulfilled Koch’s postulates associated with T. ovolyticum. Further research has also shown that Canadian S. salar with mouthrot induced by T. maritimum had a low abundance of T. ovolyticum (< 0.1% mean abundance) [22], and T. ovolyticum may be excluded during T. maritimum dysbiotic events. The infrequent association with in-situ outbreaks and a lack of pathologies among pre-exposure fish and subsequently sham-exposed S. salar and cohabitant O. tshawytscha would suggest a nonpathogenic role under the tested conditions. It is unknown how the presence of a Tenacibaculum species impacts host immunity prior to infection through another Tenacibaculum species. Improved resistance could develop if there is a cross-reactive immune response; examples in other animals include cross-immunity of humans with cowpox and protection against smallpox [92]; cross-immunity of rhesus macaques infected with Leishmania spp. [93]; and cross-immunity of Nile tilapia vaccinated with Streptococcus agalactiae and S. iniae [94]. Reduced resistance may also occur through synergistic effects of pathogens and induced tolerogenic host responses; for example, increased mortality and decreased anti-S. iniae IgM levels in white sturgeon when exposed to Acipenserid herpesvirus 2 (AciHV-2) before S. iniae [95]; increased mortality when O. mykiss are exposed sequentially to hematopoietic necrosis virus (IHNV) and Flavobacterium psychrophilum [96], and increased severity of the M. viscosa [97] and ISAV [98] infections following sea-lice pre-infection in S. salar. More research is needed to understand if the presence of T. ovolyticum and other Tenacibaculum species have beneficial or detrimental interactions with the salmonid host and T. maritimum.
4.5. Impacts of Replication
Increasing the number of replicates generally produces increasingly accurate and reliable information in experimental research [99, 100]. Biological variation is substantially greater than the technical counterpart and often deems more replicates [99]. Too few biological replicates could lead to false positive or negative inferences and may mask other variables, such as environmental influence. In this work, there were two biological replicates (i.e., tanks) per treatment, and increasing replicate size may help draw more informed conclusions. Future work will attempt to increase the number of replicates for treatments to enhance interpretation.
4.6. Tenacibaculum maritimum Presence on BC Pacific Salmonids
Reports are available describing Tenacibaculum spp. on BC Pacific salmon [29, 31, 101–103], with one non-peer-reviewed article [103]. Nekouei et al. [101, 102] monitored numerous infectious agents in BC marine waters and reported an overall low prevalence of T. maritimum on wild coho salmon smolts (3.2%, 85/2622) from 2008 to 2018 and sockeye salmon (0.25%, 5/2006) smolts from 2012 to 2013. Similarly, Bass et al. [31] screened wild Chinook and coho salmon from 2008 to 2018, and reported a lower prevalence of T. maritimum in both species in the spring (Chinook [2.8%], coho [4.8%]) with higher instances in the fall (Chinook [11.6%], coho [11.1%]), demonstrating a seasonal influence on bacterial communities. Both Bass et al. [31] and Bateman et al. [29] employed extensive statistical modeling to understand if infectious agent prevalence was associated with aquaculture practices and a reason for impaired Pacific salmon survival. The epidemiological component used in models described by Bateman et al. [29] assumes all instances of identification of T. maritimum on fish using qPCR (qualitative assessment, with two reactions needing to provide a positive or negative result) infer a bacterial infection (i.e., tenacibaculosis). Further research is needed because the genus of bacteria has a cosmopolitan marine distribution and is identified among numerous marine organisms [23]. Similarly, other published reports [101, 102] only identify the presence of Tenacibaculum spp. and associated gross lesions or histopathology (i.e., infection) are not mentioned. The only occurrence of a described tenacibaculosis-like outbreak in BC Pacific salmon was in a non-peer reviewed study on O. tshawytscha [103]. However, the O. tshawytscha in this study became infected with T. dicentrarchi in captivity and had no apparent clinical signs of tenacibaculosis when previously angled at sea and transported to the holding facility [103], indicating issues relating to capture, handling, transport, or husbandry. A recent, pre-print (nonpeer reviewed) review article discuses an alternate perspective with regards to the impacts of pathogens identified from Atlantic salmon farm sites on BC Pacific salmon species; indicating that studies may overestimate the risk of aquatic pathogens at salmon farms, and that such risks have not significantly impacted wild salmon populations [104]. This review by Marty et al. [104] also discusses that the presence of the pathogen alone is insufficient for interpretations into health, with some exceptions. The above work describes an absolute need for laboratory-based exposure models to demonstrate the potential for this bacterial genus to negatively influence Pacific salmonid survival.
4.7. Bacterial Isolation and Systemic Presence of T. maritimum
Among the 144 cultured T. maritimum isolates from this study, 11 were from the kidney and 3 from the spleen of post-exposure S. salar. Debates on the internal systemic presence of T. maritimum in diseased S. salar exist due to a lack of historic and consistent isolation or detection from internal tissues such as the head kidney. Even with aseptic techniques, these isolates could occur through some metric of contamination. However, recent studies have inferred systemic invasion in infected S. salar based on cultured isolates [19, 105–107], histology [105], and positive RT-qPCR or qPCR reactions from internal tissues [19, 106]. Another recent study interpreted no internal presence in O. tshawytscha based on bacterial culturing but was able to detect T. maritimum using qPCR [28]. It is unknown if the difference in internal presence is related to the host, and further research and collaborative lab efforts are needed to help dissect the internal presence in salmonids. To confirm systemic infection of T. maritimum in S. salar from this study, techniques such as fluorescent in situ hybridization are needed.
4.8. Reduced Hemoglobin Concentration and Compromised Osmoregulation in Infected Fish
No changes in hemoglobin among O. tshawytscha were found in the present study, and there are few comparable published studies. However, hemoglobin concentrations reported in this work were similar to a recent study that utilized the same hemoglobin assay, investigating exercise training of O. tshawytscha to assess the physiological effect of heat waves [108]. Additionally, hemoglobin concentrations reported here for S. salar are similar to several experiments using the same hemoglobin assay [109–111]. Increased hemoglobin content of S. salar sham-controls is supportive of saltwater acclimatization [112]. The lack of an increase in the other S. salar treatments may indicate anemia, supported by low hematocrit values (data not shown, too few samples for statistical inference).
In aquatic environments, the epidermis of fish has numerous functions, including being a barrier to foreign agents and maintaining internal osmolarity. Osmoregulatory dysfunction paired with elevated skin lesions occurs in other fishes post-exposure to parasites [113] or infectious agents [114, 115]. In this experiment, S. salar with more lesions had increased plasma osmolarity in contrast to salmon without, indicating compromised osmoregulatory functions. Overall, hemoglobin content and osmolarity may be valuable additional parameters to infer the development of tenacibaculosis in clinically infected fish. Collection and assessment of blood parameters during outbreaks of tenacibaculosis at an S. salar netpen sites would be helpful to provide insight into these physiological changes and how they relate to morbidity and mortality in situ.
5. Conclusions
This is the first study to investigate interspecific horizontal transmission of T. maritimum between two salmonid species using a bath immersion cohabitation model. Atlantic salmon with tenacibaculosis did not transmit tenacibaculosis interspecifically to the Cheakamus stock of BC O. tshawytscha using T. maritimum 2.1C under tested conditions. Further, T. maritimum was infrequently transmitted to O. tshawytscha that grew well during the trial and were considered healthy without any signs of tenacibaculosis, indicating that the presence of Tenacibaculum bacteria is not an absolute for inferring health status. More bacterial isolates, families of fish, species of BC Pacific salmonids, and environmental conditions need to be investigated further. Future work will attempt to understand why O. tshawytscha did not experience the morbidity and mortality in this trial.
Conflicts of Interest
The authors declare no conflicts of interest.
Funding
This study was supported by the Department of Fisheries and Ocean’s Contribution Agreement, Ontario Veterinary College Scholarship, Ontario Graduate Scholarship, Natural Sciences and Engineering Research Council of Canada (Grant RGPIN-2024-06347).
Acknowledgments
This work could not have occurred without the help of several groups and individuals. We would like to acknowledge the individuals from Mowi Canada West’s Big Tree Creek Hatchery and the Department of Fisheries and Ocean’s Salmon Enhancement Program Tenderfoot Creek Hatchery for providing fish. We would also like to acknowledge Carl Butterworth and Jennifer Kebe (i.e., members of VIU’s animal care committee) who were involved in post-approval monitoring.
Open Research
Data Availability Statement
The data that support the findings of this study are available from the corresponding author upon reasonable request.


