Effects of Glycine Supplementation on Growth Performance, Antioxidant Activity, Immunity, and Muscle Tissue Structure of Whiteleg Shrimp (Litopenaeus vannamei) Under Fermented Soybean Meal Substitution
Abstract
Exogenous amino acid supplementation has become a nutritional strategy to improve the tolerance of whiteleg shrimp (Litopenaeus vannamei) to a high proportion of vegetable protein diets. In the present study, the effects of glycine in high-proportion fermented soybean meal (FSBM) feed for shrimp were verified. SBM fermented by Bacillus subtilis was used to replace 50%, 75%, and 100% of fish meal (FM), respectively. Concomitantly, 1% glycine was added to the diets containing FSBM. After an 8-week feeding trial, FSBM substitution significantly inhibited the growth parameters of shrimp, including weight gain rate (WGR) and specific growth rate (SGR). Glycine supplementation significantly alleviated the inhibition of growth performance induced by 50% FSBM substitution but not in the 75% and 100% FSBM substitution groups. Glycine significantly increased the level of glycine in the muscle. In addition, glycine supplementation improved the structure of hepatopancreas and increased the length of sarcomeres and myofiber density in muscle tissue. RT-qPCR results revealed that glycine inhibited the mRNA expression of smyhc1 and smyhc2. Further investigation revealed that glycine enhanced the antioxidant capacity in muscle tissue and inhibited the mRNA expression of immune genes, including traf6, toll, and lgbp, caused by FSBM substitution. In summary, the results indicated that appropriate glycine supplementation could ensure that 50% FSBM substitution of FM did not affect the growth performance of shrimp. Moreover, glycine may improve the structure of muscle tissue by enhancing antioxidant capacity and immunity. This study further emphasized the crucial role of glycine in the development of low FM feed for shrimp.
1. Introduction
The feed industry supports the sustainable development of aquaculture, which is an important guarantee of food security. Owing to its balanced amino acids and high palatability, fish meal (FM) is the most suitable protein raw material in aquatic feed [1]. Recently, the shortage of FM and the rising price of protein resources have become the bottleneck problems in the aqua feed industry [2]. Hence, vegetable protein, animal protein, and single-cell protein have become alternatives to FM [3, 4]. Among them, vegetable protein, especially soybean meal (SBM), is the main substitute for FM [5]. Moreover, fermentation technology has been developed to address the problems of antinutritional factors (ANFs) and palatability in SBM [6]. However, shrimp fed low-FM and high-SBM/fermented SBM (FSBM) diets have demonstrated poor growth performance (less dressing percentage and slow growth) [7, 8] and aberrant muscle structure [9].
In muscle, protein synthesis and decomposition activities occur frequently. Muscle-free amino acids and the protein pool are in a state of dynamic balance [10]. The most prevalent free amino acid in the hemolymph and whole body of whiteleg shrimp (Litopenaeus vannamei) is glycine (Figure S1) [10], which is abundant in animal-source protein [11], whereas all vegetable protein contains low levels of glycine [12]. Although glycine is a nonessential amino acid, as the most abundant free amino acid, glycine plays an important role in the growth and development of whiteleg shrimp [13, 14]. Glycine not only has anti-inflammatory [15] and antioxidant effects [16] but also promotes muscle growth by promoting protein synthesis and inhibiting protein degradation [17]. The muscle-promoting effect of glycine can be achieved by activating the mechanistic target of rapamycin complex 1 (mTORC1) signaling pathway [18] or by producing creatine together with arginine and methionine [19]. Hence, the lower content of glycine in high-SBM/FSBM diets may be one of the main reasons for impaired muscle structure.
Emerging evidence has shown that the focus on improving the utilization efficiency of plant-based proteins should not be limited to essential amino acids such as methionine and lysine, but functional amino acids such as glycine should also be given attention [20–22]. It was recently reported that high-FSBM and low-FM diets induced oxidative stress by impairing glycine, serine, and threonine metabolism in largemouth bass (Micropterus salmoides), which indicated that dietary glycine supplementation could increase the utilization of plant-based protein sources [23]. In addition, Xie et al. [13] reported that dietary glycine supplementation enhanced the weight gain and specific growth rate (SGR) of whiteleg shrimp. In the present study, we tested the hypothesis that adding glycine to FSBM-based diets may improve shrimp growth performance. On the basis of the preliminary laboratory results and published articles [24–26], we used FSBM to replace 50%–100% FM. About 1% glycine was supplemented in the diets containing FSBM. At the end of the feeding trial, growth performance, physiological, biochemical indicators, and histological analysis were performed to comprehensively evaluate the effects of glycine.
2. Materials and Methods
2.1. Feed Preparation
Seven isonitrogenous (38.23%) and isolipidic (8.50%) diets were prepared. The control diet (CON) contained 40% FM. SBM was fermented by Bacillus subtilis according to a published method [23]. In brief, after extended incubation, B. subtilis was inoculated into the sterilized SBM. The SBM was immediately placed in a shaker and fermented at 37°C, 100 rpm, and 80% humidity for 24 h. The FSBM was then placed in an oven and dried at 50°C for 6–7 h to maintain 8%–10% humidity. Finally, FSBM was crushed and stored at −20°C until use. FSBM was used to replace 50%, 75%, and 100% of FM, which were named 50FSBM, 75FSBM, and 100FSBM, respectively. The amino acid composition of FSBM and FM is detailed in Tables S1 and S2, respectively. To evaluate the effect of glycine on improving the utilization of plant-based protein, 1% glycine was added to the 50FSBM, 75FSBM, and 100FSBM groups, which were named 50FSBMG, 75FSBMG, and 100FSBMG, respectively. Alanine was used as the isonitrogenous control to balance the total nitrogen content in different experimental diets. The experimental diets were formulated with a previously published method [27]. In brief, the feed ingredients were crushed and sifted through a 60-mesh sieve. The ingredients were then weighed and combined with fish oil and distilled water. The mixture was subsequently formed into sinking pellets with diameters of 0.8 and 1.0 mm by a twin-screw extruder. The wet feed was then subjected to drying at 45°C for 24 h, followed by storage at −20°C for future use. The feed formulation and composition are presented in Table 1, and the composition of amino acids in the experimental feeds is shown in Table 2.
| Ingredients | CON | 50FSBM | 75FSBM | 100FSBM | 50FSBMG | 75FSBMG | 100FSBMG |
|---|---|---|---|---|---|---|---|
| Fish mealb | 40.00 | 20.00 | 10.00 | 0.00 | 20.00 | 10.00 | 0.00 |
| Chicken powderc | 10.00 | 10.00 | 10.00 | 10.00 | 10.00 | 10.00 | 10.00 |
| Fermented soybean meald | 0.00 | 26.00 | 39.00 | 52.00 | 26.00 | 39.00 | 52.00 |
| Alpha-starch | 20.00 | 20.00 | 20.00 | 20.00 | 20.00 | 20.00 | 20.00 |
| Fish oil | 2.00 | 2.30 | 2.60 | 2.90 | 2.30 | 2.60 | 2.90 |
| Soybean oil | 1.00 | 0.90 | 0.65 | 0.4 | 0.90 | 0.65 | 0.4 |
| Soybean lecithin | 1.00 | 1.00 | 1.00 | 1.00 | 1.00 | 1.00 | 1.00 |
| Cholesterol | 0.60 | 0.60 | 0.60 | 0.60 | 0.60 | 0.60 | 0.60 |
| Choline | 0.20 | 0.20 | 0.20 | 0.20 | 0.20 | 0.20 | 0.20 |
| Vitamin premixe | 1.00 | 1.00 | 1.00 | 1.00 | 1.00 | 1.00 | 1.00 |
| Mineral mixf | 1.00 | 1.00 | 1.00 | 1.00 | 1.00 | 1.00 | 1.00 |
| Monocalcium phosphate | 1.00 | 1.00 | 1.00 | 1.00 | 1.00 | 1.00 | 1.00 |
| Sodium alginate | 2.50 | 2.50 | 2.50 | 2.50 | 2.50 | 2.50 | 2.50 |
| Vitamin C | 0.05 | 0.05 | 0.05 | 0.05 | 0.05 | 0.05 | 0.05 |
| Mold inhibitor | 0.20 | 0.20 | 0.20 | 0.20 | 0.20 | 0.20 | 0.20 |
| Ethoxyquin | 0.01 | 0.01 | 0.01 | 0.01 | 0.01 | 0.01 | 0.01 |
| Microcrystalline cellulose | 18.44 | 12.24 | 9.19 | 6.14 | 12.24 | 9.19 | 6.14 |
| Glycine | 0.00 | 0.00 | 0.00 | 0.00 | 1.00 | 1.00 | 1.00 |
| Alanine | 1.00 | 1.00 | 1.00 | 1.00 | 0.00 | 0.00 | 0.00 |
| Proximate analysis | |||||||
| Moisture | 7.63 | 6.34 | 7.29 | 8.62 | 7.34 | 7.82 | 8.74 |
| Crude protein | 39.13 | 38.55 | 38.21 | 37.56 | 38.44 | 38.34 | 37.70 |
| Crude lipid | 9.73 | 8.48 | 8.51 | 8.15 | 8.24 | 8.09 | 8.32 |
| Ash | 8.19 | 7.46 | 6.67 | 5.91 | 7.31 | 6.67 | 5.97 |
- a50FSBM, 50% FM was replaced by FSBM; 75FSBM, 75% FM was replaced by FSBM; 100FSBM, 100% FM was replaced by FSBM; 50FSBMG, 1% glycine supplementation in the 50FSBM group; 75FSBMG, 1% glycine supplementation in the 75FSBM group; 100FSBMG, 1% glycine supplementation in the 100FSBM group.
- bThe chemical analysis of fish meal is presented as follows: crude protein: 68.19%; crude lipid: 6.82%.
- cThe chemical analysis of chicken meal is presented as follows: crude protein: 59.67%; crude lipid: 15.93%.
- dB. subtilis was used to ferment soybean meal and the amino acid composition in FSBM is presented in Table S1. The chemical analysis of FSBM is presented as follows: crude protein: 56.39%; crude lipid: 2.81%.
- eVitamin premix (g/kg): vitamin B12, 0.020; vitamin H, 0.225; vitamin B9, 0.337; vitamin D3, 1.370; vitamin A, 2.250; vitamin B1, 2.390; vitamin K, 8.900; vitamin E, 9.900; vitamin B5, 10.200; vitamin B3, 10.960; vitamin B6, 12.800; vitamin B2, 16.000; vitamin B8, 118.150; vitamin C, 19.100; cellulose, 787.400.
- fMineral premix (g/kg): NaSeO3, 0.038; MnSO4 · H2O, 1.040; CoCl2 · 6H2O, 2.217; CuSO4 · 5H2O, 9.260; ZnSO4 · 7H2O, 11.770; MgSO4, 12.800; KCl, 20.800; CaCO3, 24.180; NaCl, 90.720; FeSO4 · 7H2O, 118.370; Ca (H2PO4)2·H2O, 330.100; cellulose, 378.705.
| Amino acids | Diets2 | ||||||
|---|---|---|---|---|---|---|---|
| CON | 50FSBM | 75FSBM | 100FSBM | 50FSBMG | 75FSBMG | 100FSBMG | |
| Essential amino acids | |||||||
| Thr | 1.78 ± 0.02 | 1.42 ± 0.06 | 1.44 ± 0.07 | 1.42 ± 0.01 | 1.66 ± 0.15 | 1.60 ± 0.09 | 1.48 ± 0.06 |
| Val | 1.90 ± 0.03b | 1.37 ± 0.03a | 1.62 ± 0.14ab | 1.78 ± 0.05b | 1.77 ± 0.11b | 1.68 ± 0.03ab | 1.67 ± 0.07ab |
| Met | 1.17 ± 0.03b | 0.88 ± 0.08a | 0.83 ± 0.05a | 0.80 ± 0.02a | 0.89 ± 0.09a | 0.78 ± 0.03a | 0.72 ± 0.03a |
| Phe | 1.49 ± 0.01ab | 1.32 ± 0.01a | 1.63 ± 0.07bc | 1.74 ± 0.03c | 1.58 ± 0.05bc | 1.68 ± 0.00bc | 1.64 ± 0.08bc |
| Ile | 1.77 ± 0.03b | 1.40 ± 0.03a | 1.34 ± 0.13a | 1.38 ± 0.04a | 1.41 ± 0.02a | 1.39 ± 0.07a | 1.36 ± 0.04a |
| Leu | 3.00 ± 0.03b | 2.41 ± 0.03a | 2.44 ± 0.14a | 2.38 ± 0.04a | 2.52 ± 0.03a | 2.50 ± 0.09a | 2.38 ± 0.10a |
| Lys | 2.72 ± 0.03b | 2.03 ± 0.03a | 2.02 ± 0.16a | 1.90 ± 0.03a | 2.01 ± 0.08a | 2.05 ± 0.21a | 1.91 ± 0.14a |
| Arg | 2.52 ± 0.03b | 2.13 ± 0.06ab | 1.93 ± 0.17ab | 1.64 ± 0.02a | 1.89 ± 0.12ab | 1.87 ± 0.21a | 1.80 ± 0.18a |
| His | 0.80 ± 0.01 | 0.72 ± 0.01 | 0.76 ± 0.04 | 0.74 ± 0.00 | 0.75 ± 0.01 | 0.78 ± 0.03 | 0.76 ± 0.02 |
| Total EAA | 17.15 ± 0.20b | 13.66 ± 0.22a | 14.01 ± 0.70a | 13.80 ± 0.23a | 14.48 ± 0.25a | 14.32 ± 0.47a | 13.70 ± 0.41a |
| Nonessential amino acids | |||||||
| Asp | 3.70 ± 0.04 | 3.35 ± 0.06 | 3.53 ± 0.13 | 3.66 ± 0.06 | 3.24 ± 0.07 | 3.46 ± 0.19 | 3.31 ± 0.07 |
| Glu | 5.58 ± 0.06a | 5.62 ± 0.11ab | 6.26 ± 0.27abc | 6.70 ± 0.10c | 5.85 ± 0.09ab | 6.42 ± 0.13bc | 6.33 ± 0.29abc |
| Ser | 1.85 ± 0.02b | 1.59 ± 0.05ab | 1.59 ± 0.04ab | 1.46 ± 0.06a | 1.53 ± 0.09ab | 1.72 ± 0.09ab | 1.48 ± 0.09a |
| Gly | 2.59 ± 0.03bc | 1.94 ± 0.02a | 1.90 ± 0.06a | 1.79 ± 0.03a | 2.79 ± 0.13c | 2.72 ± 0.04bc | 2.48 ± 0.06b |
| Ala | 3.39 ± 0.04c | 2.63 ± 0.05bc | 2.15 ± 0.27ab | 1.83 ± 0.03ab | 1.66 ± 0.13a | 1.56 ± 0.21a | 1.45 ± 0.24a |
| Tyr | 1.13 ± 0.01b | 0.99 ± 0.05ab | 0.94 ± 0.01a | 0.91 ± 0.01a | 0.94 ± 0.04a | 0.96 ± 0.03a | 0.91 ± 0.04a |
| Pro | 3.95 ± 0.12bc | 4.27 ± 0.12c | 3.56 ± 0.18abc | 3.03 ± 0.17a | 2.93 ± 0.22a | 3.04 ± 0.13a | 3.23 ± 0.09ab |
| Total NEAA | 22.19 ± 0.32b | 20.40 ± 0.34ab | 19.95 ± 0.83a | 19.38 ± 0.10a | 18.94 ± 0.22a | 19.88 ± 0.57a | 19.18 ± 0.46a |
| Total AA | 39.34 ± 0.51b | 34.06 ± 0.53a | 33.96 ± 1.50a | 33.17 ± 0.27a | 33.42 ± 0.25a | 34.21 ± 1.04a | 32.89 ± 0.86a |
- Note: The superscript letters are used to indicate whether there is significance between different treatments.
- 1Tryptophan was destroyed during acid hydrolysis and could not be detected. The same as below. The data are presented as the mean ± SD and were analyzed using Tukey’s test (percentages bearing the same letters are not significantly different among treatments [p > 0.05]). The same as below.
- 250FSBM, 50% FM was replaced by FSBM; 75FSBM, 75% FM was replaced by FSBM; 100FSBM, 100% FM was replaced by FSBM; 50FSBMG, 1% glycine supplementation in the 50FSBM group; 75FSBMG, 1% glycine supplementation in the 75FSBM group; 100FSBMG, 1% glycine supplementation in the 100FSBM group.
2.2. Shrimp Rearing and Sample Collection
Whiteleg shrimp for aquaculture were purchased from Zhejiang Yize Aquaculture Co. Ltd. (Taizhou, Zhejiang, China). After 14 days of acclimatization to the experimental environment, 420 healthy shrimp (initial weight: 1.1 g) were randomly distributed into 21 tanks (water volume: 300 L; size: 100 cm × 60 cm × 80 cm), with 20 shrimp per tank. Seven experimental diets were distributed in the experimental shrimp tanks, with three replicates for each treatment. The feeding frequency of shrimp was maintained at four times (at 06:00, 11:00, 16:00, and 22:00) a day and lasted for 8 weeks. The daily feeding consumption was determined by the body weight with a ratio of 5%–8% and adjusted every 2 weeks. The water quality was maintained at optimal conditions for shrimp feeding and growth (temperature: 24–26°C; nitrite < 0.1 mg/L; dissolved oxygen level ≥ 6 mg/L; total ammonia nitrogen <0.5 mg/L; pH: 7.8–8.3; salinity: 29–31‰).
At the end of the animal experiment, all shrimp were subjected to a 24 h fast. All shrimp in each tank were subsequently counted and weighed to analyze weight gain rate (WGR), SGR, feed efficiency ratio (FER), and survival rate (SR). In addition, six shrimp from each tank were dissected, and their hepatopancreas were weighed to determine the hepatopancreas index (HSI). The muscle of the shrimp was removed; one part was preserved in paraformaldehyde (4%), and the other part was fixed in glutaraldehyde. The samples of hepatopancreas and muscle were frozen in liquid nitrogen and stored at -80°C until use.
The following parameters were calculated:
WGR (%) = 100 × (final body wet weight − initial body wet weight)/initial body wet weight;
SGR (%/day) = 100 × (Ln (final body wet weight) − Ln (initial body wet weight))/duration of the experiment (in days);
HSI (%) = 100 × hepatopancreas wet weight/final body wet weight;
FER (%) = 100 × body wet weight gain/dry feed intake.
2.3. Proximate Composition and Amino Acid Analysis
The moisture, crude protein, crude lipid, and ash contents of shrimp and feed were measured via methods provided by the Association of Official Analytical Chemists (AOAC) [28]. The feed and shrimp samples were dehydrated to constant weight with a lyophilizer (Freeze Dryer LL1500, Thermo Fisher Scientific) for the moisture analysis. Crude protein content was determined via a Kjeldahl apparatus (K355/K437, Buchi). In brief, samples were coheated with strong sulfuric acid. Subsequently, sodium hydroxide (NaOH) was added for distillation, and the amount of nitrogen collected by boric acid was determined by titration with hydrochloric acid. Crude lipid content was quantified by a Soxhlet apparatus. At 55°C water bath, the samples were placed in lipid packets and extracted by continuous refluxing petroleum ether for 12 h. The weight of the dried lipid packet was used to calculate crude lipid content. Ash content was measured by burning samples in muffle at 550°C for 12 h.
The contents of amino acids in the diets, whole body, and muscle were measured using previously described methods [26, 29]. Briefly, the sample was placed in the ampoule, followed by adding 10 mL of hydrochloric acid (6 mol/L). The ampoule was filled with nitrogen, sealed, and then placed in an oven, followed by hydrolysis at 110°C for 24 h. The hydrolysate was centrifuged at 10,000 rpm for 10 min. Then, the supernatant was analyzed using a liquid chromatograph (1260 Infinity II, Agilent).
2.4. Histological Analysis of Hepatopancreas and Muscle
Hematoxylin and eosin (H&E) staining was applied to muscle and hepatopancreas tissues for histological analysis. In brief, tissues preserved in 4% paraformaldehyde were transferred to 70% alcohol overnight, dehydrated through a series of ascending 80%, 90%, and 100% ethanol solutions, and embedded in paraffin. Sections (~5–8 μm each) were obtained by a microtome and stained with H&E. The stained sections were then photographed under a microscope (Olympus BX53, Japan). For transmission electron microscopy of longitudinal sections of muscle, the muscle tissue was fixed with glutaraldehyde and sent to Servicebio Co. Ltd. (Wuhan, Hubei, China).
2.5. Antioxidant Indicators
The antioxidant indices in the muscle and hepatopancreas, including reduced glutathione (GSH), total protein (TP), superoxide dismutase (SOD), and total antioxidant capacity (T-AOC) were measured with commercial test kits (Jiancheng Bioengineering Inc., Nanjing, China). Muscle and hepatopancreas samples were homogenized in a 1:9 (w:v) saline solution and centrifuged for 10 min at 2500 rpm.
For TP detection, the reagents in the commercial kits were mixed with samples and incubated at 37°C for 20 min. Subsequently, the mixture was analyzed with a microplate reader at 562 nm. For T-AOC analysis, samples were combined with reagents and incubated at 25°C for 6 min, after which the absorbance of the mixture was measured with a microplate reader at 405 nm. For SOD activity measurement, before testing, samples were diluted to different concentrations to adjust the inhibition rate of SOD, which remained within the range of 40%–60%. The diluted samples were mixed with reagents and scanned at 450 nm using a microplate reader. For the analysis of GSH content, after the standard in the kit was diluted into 20 μmol/mL GSH standard solution, the solution was mixed with the samples. The mixture was then stalled for 5 min, and the absorbance was then measured at 405 nm using a microplate reader. For MDA measurement, the samples and reagents were mixed in a 95°C water bath. After 40 min of incubation, the mixture was centrifuged for 10 min at 3500 rpm, and the supernatant was measured with a microplate reader at 532 nm.
2.6. RNA Extraction, cDNA Synthesis, and Quantitative Real-Time PCR
Total RNA in muscle was extracted using TRIzol Reagent (Vazyme, China). In brief, after the samples were homogenized with 1 mL of TRIzol, the homogenate was centrifuged for 10 min at 12,000 x g. The supernatant was collected, mixed with 200 μL of chloroform, and shaken vigorously for 30 s. Then, the mixture was incubated at 4°C for 3 min and centrifuged for 15 min at 12,000 x g. The supernatant was collected, and 400 μL of isopropanol was added for centrifugation (12,000 x g, 10 min). The precipitate was washed with 75% ethanol twice and solubilized by the addition of nuclease-free water. After the concentration of extracted RNA was measured by Nanodrop 2000, the extracted RNA was reverse transcribed to cDNA using HiScript III RT SuperMix for qPCR (+gDNA wiper) (Vazyme, China) through a two-step process. RT–qPCR was performed using SYBR qPCR Master Mix (Vazyme). In brief, the sample and the reagents in the kit were mixed according to the instructions. The mixture was kept at 95°C for 3 min and subjected to 39 cycles. The cycle conditions were 95°C for 10 s, 58°C for 10 s, and 72°C for 20 s. Primers were designed according to the public NCBI sequences and made in Sangon Biotech. Co., Ltd. (Shanghai, China). The details are presented in Table 3. In this study, β-actin was selected as the reference gene because the expression of β-actin was the most stable among the different treatments. The gene mRNA levels were quantified using the comparative cycle threshold (CT) approach (2−∆∆ct method) [30].
| Gene | Forward primer | Reverse primer | GenBank no. |
|---|---|---|---|
| b-actin | GAAGTAGCCGCCCTGGTTGT | AGGATACCTCGCTTGCTCTGG | AF300705.2 |
| lgbp | CGGCAACCAGTACGGAGGAAC | GTGGAAATCATCGGCGAAGGAG | EU102286 |
| traf6 | ACATCACCAATCCCAGAG | TCAGCACCGCCTTTATC | HM581680 |
| hsp70 | CCTCCTACGTCGCCTTCACAGACA | GGGGTAGAAGGTCTTCTTGTCTCCC | AY645906 |
| toll | CCAGCTTAGAAGACCGGCAA | GTTGTCCGAGCAGAAGTCCA | DQ923424 |
| imd | TGGGTCCGTGTCCAGTGATT | AGAGCCGCCGGTTATGTTGT | FJ592176 |
| lysozyme | TACGGCAAGAACGTCTGCAAA | CACTTGCTGTTGTAAGCCACCC | AF425673 |
| smyhc1 | CGGTGCCTCTGAGAAGAAAG | AGGAGTTGTCGTTACGGGTG | AB758443 |
| smyhc2 | CGATATTTACGACTACCGCTACG | CGACCCCTCTGCTTGAACTT | AB758444.1 |
| smyhc6a | ATCCGAACTTGCTGATGCC | TCAGCACGGAGTTCGTCAGC | AB759104.1 |
- Abbreviations: hsp70, heat shock 70 kDa protein; imd, immune deficiency; lgbp, lipopolysaccharide and beta-1,3-glucan binding protein; smyhc1, slow myosin heavy chain 1; smyhc2, slow myosin heavy chain 2; smyhc6a, slow myosin heavy chain 6a; traf6, TNF receptor-associated factor 6.
2.7. Statistical Analysis
The data of this study are shown as the means ± standard deviation (SD). After analyzing for normality and homoscedasticity, one-way analysis of variance (ANOVA) and Tukey’s test were used to assess the differences between the various groups in SPSS 27.0 software. A statistically significant difference was defined as p < 0.05.
3. Results
3.1. Dietary Glycine Supplementation Alleviated FSBM Substitution-Induced Growth Inhibition
After an 8-week feeding trial, the growth parameters of whiteleg shrimp are presented in Table 4. The SRs of all groups were greater than 90% with no significant difference (p > 0.05). With the rise of the FSBM substitution ratio, final body weight, WGR, SGR, and FER significantly decreased (p < 0.05). Interestingly, compared with the 50FSBM group, 1% dietary glycine supplementation significantly enhanced the growth performance of shrimp (p < 0.05). Moreover, there were no significant differences in growth parameters between the 50FSBMG group and the control group. Although the final body weight, WGR, and SGR in the 75FSBMG group were significantly higher than those in the 75FSBM group (p < 0.05), they were still significantly lower than those in the control group. However, dietary supplementation with 1% glycine supplementation did not substantially improve the growth performance compared with that of the 100FSBM group (p > 0.05). Glycine supplementation significantly blocked FSBM substitution-induced increase in the HSI of shrimp (p < 0.05). There was no significant effect on the body composition of the whole shrimp body among all the groups (p > 0.05, Table 5).
| CON | 50FSBM | 75FSBM | 100FSBM | 50FSBMG | 75FSBMG | 100FSBMG | |
|---|---|---|---|---|---|---|---|
| Initial body weight (IBW, g) | 1.1 | 1.1 | 1.1 | 1.1 | 1.1 | 1.1 | 1.1 |
| Final body weight (FBW, g) | 12.98 ± 1.02e | 9.17 ± 0.24cd | 7.48 ± 0.15bc | 5.51 ± 0.10a | 12.06 ± 0.19e | 10.12 ± 0.24d | 6.34 ± 0.09ab |
| Weight gain rate (WGR, %) | 1139.17 ± 100.96e | 721.04 ± 25.89bc | 590.91 ± 11.74ab | 408.24 ± 7.18a | 978.90 ± 0.37de | 801.12 ± 14.73cd | 482.42 ± 7.89a |
| Specific growth rate (SGR, %/day) | 4.48 ± 0.15e | 3.76 ± 0.06cd | 3.45 ± 0.03bc | 2.90 ± 0.03a | 4.25 ± 0.00e | 3.93 ± 0.03d | 3.15 ± 0.02ab |
| Feed efficiency ratio (FER) | 0.97 ± 0.10c | 0.75 ± 0.01b | 0.60 ± 0.01ab | 0.43 ± 0.01a | 0.96 ± 0.02c | 0.73 ± 0.01b | 0.58 ± 0.00ab |
| Hepatopancreas index (%) | 4.54 ± 0.17a | 5.50 ± 0.13c | 5.84 ± 0.04cd | 6.17 ± 0.21d | 4.56 ± 0.08a | 4.78 ± 0.23ab | 5.36 ± 0.06bc |
| Survival rate (%) | 95.00 ± 5.00 | 96.67 ± 3.33 | 95.00 ± 0.00 | 98.33 ± 1.67 | 98.33 ± 1.67 | 95.00 ± 0.00 | 100.00 ± 0.00 |
- Note: The data are presented as the mean ± SD and were analyzed using Tukey’s test (percentages bearing the same letters are not significantly different among treatments [p > 0.05]). The superscript letters are used to indicate whether there is significance between different treatments.
| CON | 50FSBM | 75FSBM | 100FSBM | 50FSBMG | 75FSBMG | 100FSBMG | |
|---|---|---|---|---|---|---|---|
| Moisture (%) | 73.98 ± 0.94 | 75.47 ± 1.22 | 75.75 ± 0.90 | 77.46 ± 0.46 | 74.18 ± 0.50 | 75.01 ± 0.73 | 75.86 ± 0.98 |
| Ash (%) | 3.33 ± 0.06 | 3.17 ± 0.11 | 3.55 ± 0.03 | 3.22 ± 0.17 | 3.49 ± 0.04 | 3.68 ± 0.15 | 3.63 ± 0.26 |
| Crude lipid (%) | 2.89 ± 0.18 | 2.62 ± 0.08 | 2.44 ± 0.12 | 2.51 ± 0.13 | 2.74 ± 0.05 | 2.54 ± 0.14 | 2.58 ± 0.10 |
| Crude protein (%) | 19.84 ± 0.71 | 18.86 ± 0.84 | 18.63 ± 0.49 | 17.28 ± 0.24 | 19.56 ± 0.19 | 19.18 ± 0.54 | 17.49 ± 0.85 |
3.2. Dietary Glycine Supplementation Altered the Amino Acid Profile of Whole Shrimp and Muscle
The amino acid composition of feed in each group accurately reflected the amino acid differences between FM and FSBM. FSBM substitution significantly decreased the levels of methionine, lysine, total essential amino acids, and glycine but increased the glutamate content (p < 0.05, Table 2). Glycine supplementation significantly increased the glycine levels in the 50FSBMG, 75FSBMG, and 100FSBMG groups (p < 0.05, Table 2). In the whole body, with the rise of FSBM substitution ratio, the contents of branched-chain amino acids (BCAAs), including valine, isoleucine, and leucine, tended to decrease, but the difference was not significant (p > 0.05, Table 6). Compared with the 75FSBM and 100FSBM groups, dietary glycine supplementation increased the levels of isoleucine and leucine, but the difference was not substantial (p > 0.05, Table 6). The total essential amino acid content in the whole shrimp body was not affected by the feed composition (p > 0.05, Table 6). However, the glycine content in 75FSBMG and 100FSBMG groups was significantly higher than that in the control group (p < 0.05, Table 6). In the muscle, with the rise of FSBM substitution ratio, the contents of valine, phenylalanine, isoleucine, leucine, lysine, total essential amino acids, and glycine considerably decreased (p < 0.05). Glycine content in the 50FSBMG group was significantly higher than that in the 50FSBM group (p < 0.05). Correspondingly, the 100FSBMG group significantly increased the glycine content compared with the 100FSBM group (p < 0.05, Table 7).
| Amino acids | Diets | ||||||
|---|---|---|---|---|---|---|---|
| CON | 50FSBM | 75FSBM | 100FSBM | 50FSBMG | 75FSBMG | 100FSBMG | |
| Essential amino acids | |||||||
| Thr | 2.43 ± 0.09 | 2.59 ± 0.06 | 2.46 ± 0.02 | 2.32 ± 0.12 | 2.63 ± 0.11 | 2.64 ± 0.03 | 2.52 ± 0.09 |
| Val | 2.66 ± 0.11ab | 2.86 ± 0.08b | 2.54 ± 0.01ab | 2.38 ± 0.13a | 2.60 ± 0.10ab | 2.65 ± 0.04ab | 2.38 ± 0.07a |
| Met | 1.37 ± 0.01 | 1.46 ± 0.05 | 1.35 ± 0.02 | 1.21 ± 0.11 | 1.39 ± 0.08 | 1.50 ± 0.01 | 1.35 ± 0.09 |
| Phe | 2.66 ± 0.11 | 2.80 ± 0.07 | 2.62 ± 0.04 | 2.50 ± 0.11 | 2.83 ± 0.10 | 2.88 ± 0.04 | 2.72 ± 0.10 |
| Ile | 2.42 ± 0.07ab | 2.57 ± 0.04b | 2.29 ± 0.01ab | 2.20 ± 0.10a | 2.50 ± 0.11ab | 2.58 ± 0.02b | 2.31 ± 0.04ab |
| Leu | 4.42 ± 0.15ab | 4.66 ± 0.05ab | 4.32 ± 0.03ab | 4.06 ± 0.22a | 4.65 ± 0.17ab | 4.74 ± 0.05b | 4.51 ± 0.12ab |
| Lys | 4.40 ± 0.18 | 4.52 ± 0.14 | 4.28 ± 0.03 | 4.04 ± 0.25 | 4.68 ± 0.20 | 4.71 ± 0.04 | 4.52 ± 0.11 |
| Arg | 6.36 ± 0.29 | 7.05 ± 0.32 | 7.98 ± 0.43 | 7.54 ± 0.32 | 7.86 ± 0.19 | 7.69 ± 0.51 | 7.36 ± 0.22 |
| His | 1.45 ± 0.06 | 1.52 ± 0.08 | 1.42 ± 0.03 | 1.38 ± 0.06 | 1.53 ± 0.07 | 1.58 ± 0.02 | 1.48 ± 0.07 |
| Total EAA | 28.17 ± 0.97 | 30.02 ± 0.63 | 29.27 ± 0.57 | 27.64 ± 1.40 | 30.65 ± 1.04 | 30.98 ± 0.61 | 29.15 ± 0.86 |
| Nonessential amino acids | |||||||
| Asp | 6.18 ± 0.18ab | 6.83 ± 0.13b | 6.23 ± 0.11ab | 5.89 ± 0.30a | 6.65 ± 0.22ab | 6.87 ± 0.07b | 6.55 ± 0.19ab |
| Glu | 9.92 ± 0.40 | 10.76 ± 0.19 | 9.94 ± 0.07 | 9.19 ± 0.61 | 10.45 ± 0.46 | 10.78 ± 0.18 | 10.40 ± 0.39 |
| Ser | 2.56 ± 0.09 | 2.77 ± 0.03 | 2.65 ± 0.05 | 2.52 ± 0.10 | 2.76 ± 0.09 | 2.83 ± 0.02 | 2.76 ± 0.08 |
| Gly | 5.14 ± 0.09a | 5.45 ± 0.23ab | 5.79 ± 0.26ab | 5.75 ± 0.19ab | 5.69 ± 0.06ab | 6.03 ± 0.14b | 6.25 ± 0.17b |
| Ala | 3.95 ± 0.04a | 4.53 ± 0.23ab | 4.35 ± 0.34ab | 4.39 ± 0.13ab | 4.81 ± 0.10b | 4.95 ± 0.12b | 3.94 ± 0.13a |
| Tyr | 2.22 ± 0.09 | 2.28 ± 0.09 | 2.21 ± 0.04 | 2.09 ± 0.12 | 2.40 ± 0.13 | 2.48 ± 0.04 | 2.36 ± 0.09 |
| Pro | 6.07 ± 0.68 | 6.85 ± 1.66 | 4.34 ± 0.34 | 3.52 ± 0.36 | 5.67 ± 0.39 | 4.84 ± 0.19 | 4.51 ± 0.46 |
| Total NEAA | 36.05 ± 1.34 | 39.47 ± 1.71 | 35.50 ± 0.46 | 33.36 ± 1.78 | 38.44 ± 1.39 | 38.77 ± 0.51 | 36.77 ± 1.18 |
| Total AA | 64.22 ± 2.28 | 69.49 ± 1.87 | 64.77 ± 1.02 | 60.99 ± 3.18 | 69.09 ± 2.43 | 69.75 ± 1.04 | 65.92 ± 2.02 |
- Note: The data are presented as the mean ± SD and were analyzed using Tukey’s test (percentages bearing the same letters are not significantly different among treatments [p > 0.05]). The superscript letters are used to indicate whether there is significance between different treatments.
| Amino acids | Diets | ||||||
|---|---|---|---|---|---|---|---|
| CON | 50FSBM | 75FSBM | 100FSBM | 50FSBMG | 75FSBMG | 100FSBMG | |
| Essential amino acids | |||||||
| Thr | 2.78 ± 0.02 | 2.72 ± 0.05 | 2.60 ± 0.04 | 2.60 ± 0.02 | 2.55 ± 0.11 | 2.58 ± 0.04 | 2.55 ± 0.06 |
| Val | 3.24 ± 0.03b | 3.05 ± 0.06ab | 2.94 ± 0.05a | 2.88 ± 0.01a | 2.91 ± 0.11a | 2.90 ± 0.06a | 2.90 ± 0.04a |
| Met | 1.75 ± 0.03 | 1.75 ± 0.16 | 1.63 ± 0.01 | 1.64 ± 0.01 | 1.58 ± 0.10 | 1.55 ± 0.03 | 1.66 ± 0.19 |
| Phe | 2.98 ± 0.00c | 2.81 ± 0.05bc | 2.67 ± 0.04ab | 2.58 ± 0.01ab | 2.56 ± 0.09a | 2.55 ± 0.06a | 2.49 ± 0.03a |
| Ile | 3.13 ± 0.01b | 2.97 ± 0.05ab | 2.88 ± 0.04ab | 2.80 ± 0.03a | 2.81 ± 0.11a | 2.80 ± 0.06a | 2.81 ± 0.05a |
| Leu | 5.60 ± 0.02b | 5.40 ± 0.09ab | 5.22 ± 0.06ab | 5.09 ± 0.03a | 5.11 ± 0.19a | 5.09 ± 0.11a | 5.06 ± 0.07a |
| Lys | 5.84 ± 0.06b | 5.54 ± 0.10ab | 5.34 ± 0.07a | 5.23 ± 0.04a | 5.08 ± 0.20a | 5.13 ± 0.07a | 5.08 ± 0.04a |
| Arg | 6.65 ± 0.06ab | 6.30 ± 0.11a | 6.83 ± 0.23ab | 6.59 ± 0.04ab | 6.22 ± 0.23a | 6.60 ± 0.08ab | 7.09 ± 0.13b |
| His | 1.38 ± 0.01 | 1.34 ± 0.05 | 1.26 ± 0.02 | 1.28 ± 0.04 | 1.28 ± 0.07 | 1.25 ± 0.02 | 1.29 ± 0.06 |
| Total EAA | 33.36 ± 0.08b | 31.86 ± 0.72ab | 31.37 ± 0.46ab | 30.69 ± 0.15ab | 30.11 ± 1.19a | 30.44 ± 0.43ab | 30.93 ± 0.63ab |
| Nonessential amino acids | |||||||
| Asp | 7.75 ± 0.04 | 7.70 ± 0.11 | 7.41 ± 0.08 | 7.35 ± 0.03 | 7.37 ± 0.29 | 7.34 ± 0.18 | 7.25 ± 0.10 |
| Glu | 13.08 ± 0.22 | 13.04 ± 0.30 | 12.65 ± 0.22 | 12.62 ± 0.04 | 12.15 ± 0.45 | 12.40 ± 0.18 | 12.52 ± 0.06 |
| Ser | 2.88 ± 0.01 | 2.83 ± 0.03 | 2.75 ± 0.03 | 2.72 ± 0.00 | 2.69 ± 0.11 | 2.72 ± 0.06 | 2.68 ± 0.04 |
| Gly | 5.93 ± 0.13b | 5.16 ± 0.04a | 5.68 ± 0.28ab | 5.24 ± 0.13a | 5.81 ± 0.39b | 5.99 ± 0.27b | 5.71 ± 0.39b |
| Ala | 4.86 ± 0.09ab | 5.33 ± 0.26b | 4.69 ± 0.18ab | 4.75 ± 0.11ab | 4.77 ± 0.06ab | 4.56 ± 0.09a | 4.47 ± 0.11a |
| Tyr | 2.34 ± 0.00 | 2.32 ± 0.07 | 2.17 ± 0.01 | 2.14 ± 0.01 | 2.15 ± 0.07 | 2.12 ± 0.04 | 2.16 ± 0.08 |
| Pro | 17.11 ± 1.61c | 14.93 ± 0.36bc | 12.82 ± 0.68ab | 11.30 ± 0.10a | 15.67 ± 0.42bc | 12.90 ± 0.50ab | 13.04 ± 0.34ab |
| Total NEAA | 53.94 ± 1.61c | 51.31 ± 0.27bc | 48.16 ± 0.65ab | 46.12 ± 0.35a | 50.61 ± 1.64abc | 48.04 ± 0.79ab | 47.84 ± 0.38ab |
| Total AA | 87.30 ± 1.65b | 83.18 ± 0.93ab | 79.52 ± 0.98ab | 76.81 ± 0.46a | 80.71 ± 2.79ab | 78.48 ± 1.21a | 78.77 ± 1.01a |
- Note: The data are presented as the mean ± SD and were analyzed using Tukey’s test (percentages bearing the same letters are not significantly different among treatments [p > 0.05]). The superscript letters are used to indicate whether there is significance between different treatments.
3.3. Dietary Glycine Supplementation Enhanced the Structure of Hepatopancreas and Muscle Under FSBM Substitution
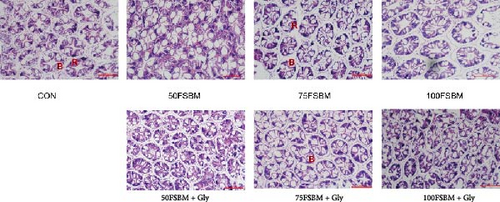
As the main center of metabolism and digestion in shrimp, hepatopancreas function depends on healthy structures, which are also affected by nutritional stress. In the present study, the hepatopancreas in the control group was a complex tubular gland composed of multiple glandular ducts, closely adjacent to each other, with lumens in the shape of quadrilaterals. The secretory cells and absorbent cells in the tube wall had a regular and clearly visible shape (Figure 1). However, in the FSBM substitution group, air bubbles were occasionally observed in the hepatopancreas. In addition, the atrophy of the gland ducts was severe and the distance between the gland ducts increased. The gland ducts were no longer adjacent to each other. In the 100FSBM group, the epithelium of the ducts detached from the basement membrane. On the basis of 50% and 75% substitution, adding glycine improved the structure of hepatopancreas. However, glycine could not reverse the damage caused by 100% substitution (Figure 1).
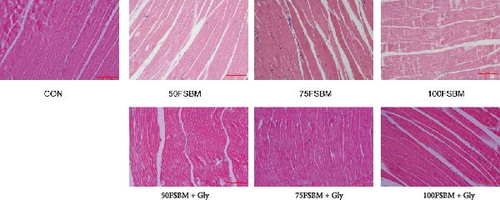
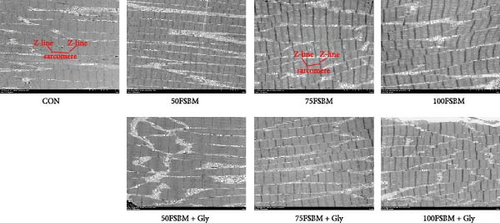
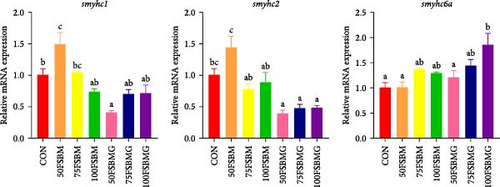
FSBM substitution and glycine supplementation also affected the diameter of myofibers. Myofiber microstructure of longitudinal sections revealed that with the increase of the substitution ratio, the arrangement of myofibers became increasingly sparse. In the 100FSBM group, myofibers even exhibited a breakthrough phenomenon. Dietary glycine supplementation significantly reduced the gap between myofibers, resulting in a tighter arrangement of myofibers in the 75FSBM group (Figure 2). Transmission electron microscopy of longitudinal sections revealed that the Z-line, bright band, and dark band of the sarcomere were clearly visible in the control group. FSBM substitution significantly reduced the length of sarcomeres, whereas dietary glycine supplementation positively promoted an effect on the length of sarcomeres (Figure 3). RT-qPCR results revealed that glycine significantly decreased the mRNA expression of smyhc1 and smyhc2 under 50% FSBM substitution (p < 0.05). However, glycine had no significant effect on the mRNA expression of smyhc1 and smyhc2 under 75% and 100% FSBM substitution (p > 0.05, Figure 4).
3.4. Dietary Glycine Supplementation Relieved Oxidative Stress Induced by FSBM Substitution
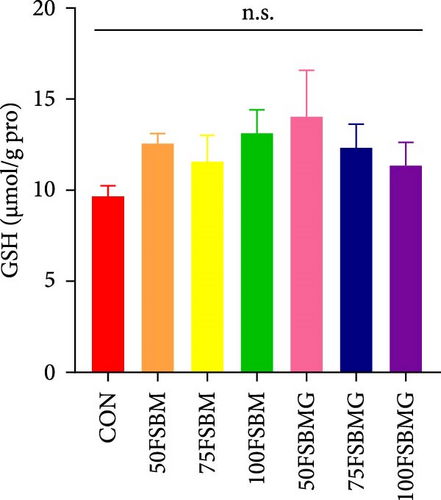
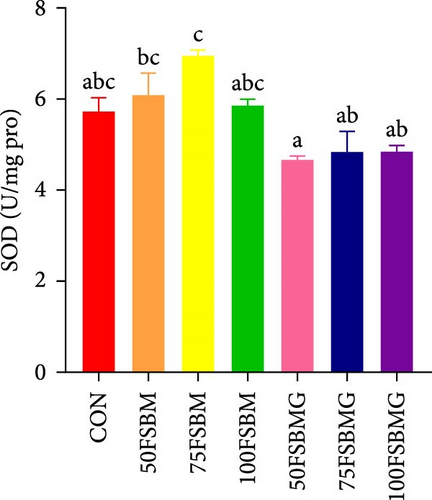
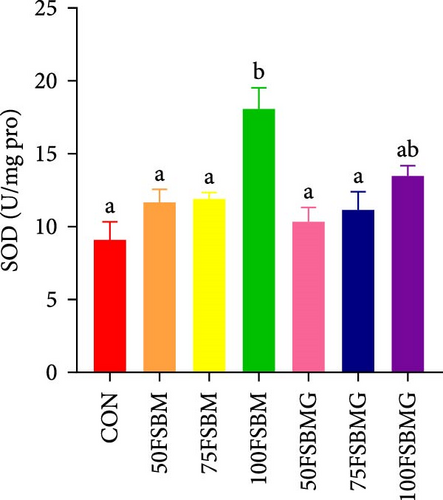
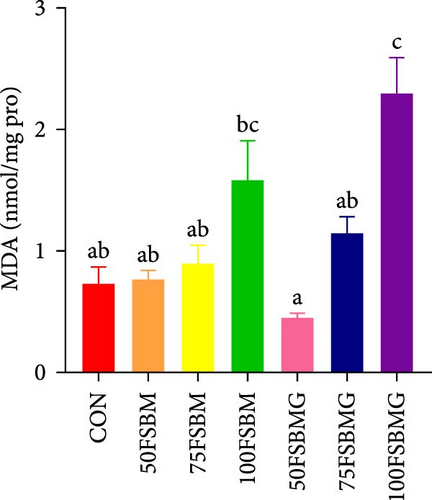
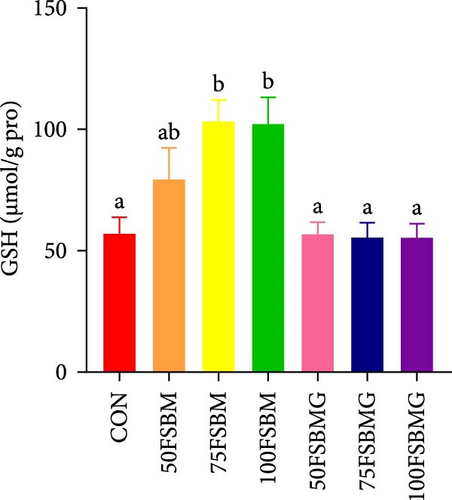
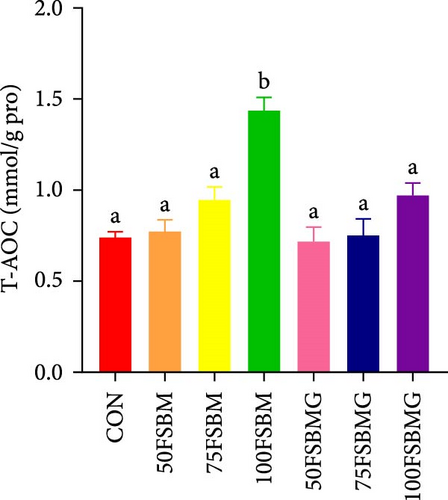
In the hepatopancreas, GSH contents were not affected by feed (p > 0.05, Figure 5A). In contrast, compared with the 50FSBM and 75FSBM groups, glycine supplementation significantly decreased the activity of SOD (p < 0.05, Figure 5B). In the muscle, glycine alleviated the increase in SOD and T-AOC activities induced by the 100FSBM group (p < 0.05, Figure 5C,F). In addition, dietary glycine supplementation significantly decreased the contents of GSH induced by 75FSBM and 100FSBM groups (p < 0.05, Figure 5E). However, glycine supplementation had no significant effect on the contents of MDA in the muscle (p > 0.05, Figure 5D).
3.5. Dietary Glycine Supplementation Enhanced the Immunity of Muscle in Shrimp
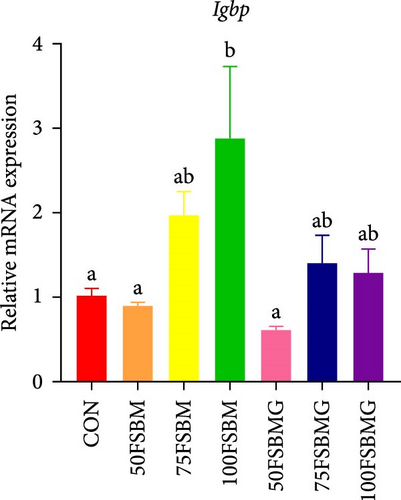
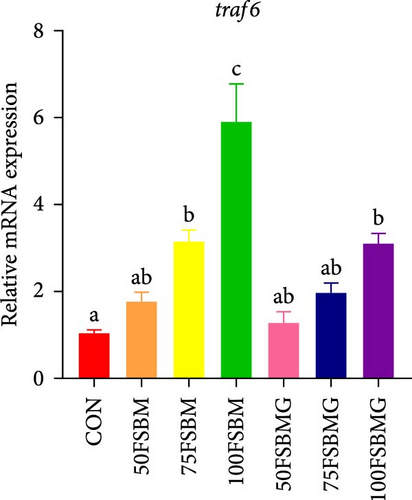
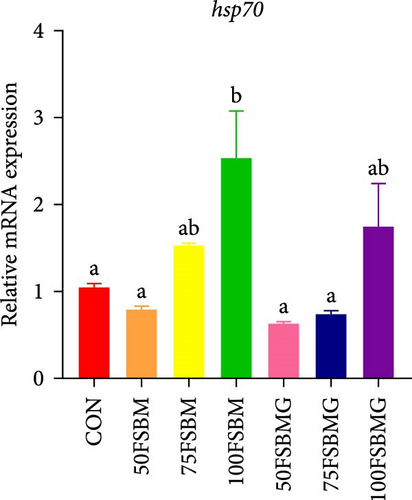
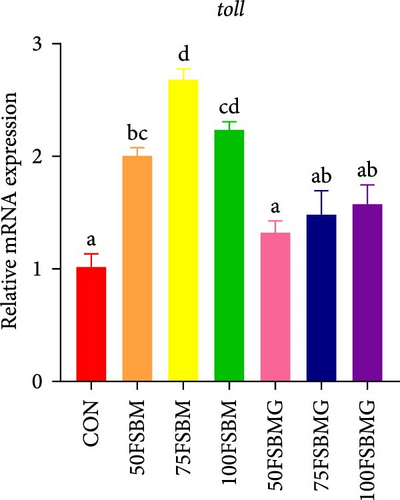
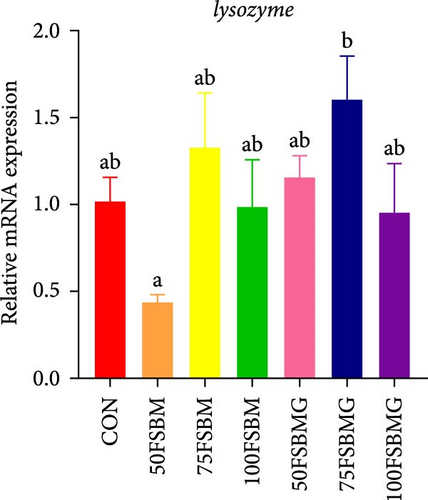
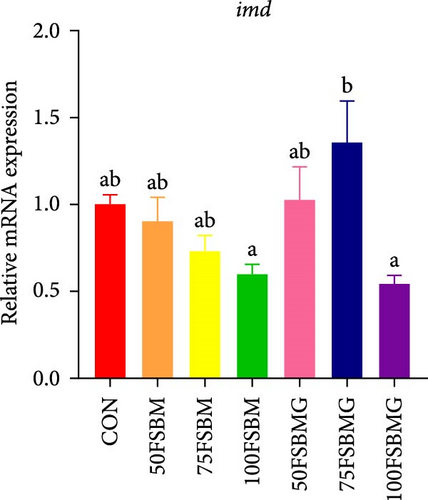
In addition to enhancing antioxidant capacity, glycine also regulates the immune response. In the present study, compared with the control group, 100% FSBM substitution significantly increased the mRNA expression of lgbp and hsp70 (p < 0.05, Figure 6A,C), whereas glycine supplementation relieved the increase in the control group. Glycine attenuated high-FSBM-induced toll mRNA expression (Figure 6D). The 75FSBM and 100FSBM groups significantly activated the mRNA expression of traf6 (p < 0.05, Figure 6B). After adding glycine, the expression of traf6 decreased in the 75FSBMG group, and there was no significant difference between the 75FSBMG group and the control group (p > 0.05, Figure 6B). However, although glycine also significantly decreased the mRNA expression of traf6 in group 100FSBMG compared with that in the 100FSBM group, it was still significantly higher than that in the control group. Glycine supplementation had no significant effect on the mRNA expression of lysozyme or imd (p > 0.05, Figure 6E,F).
4. Discussion
The imbalance in the amino acid composition of plant-based protein sources affects the utilization efficiency of plant proteins [31, 32], which is reflected in the lower content of essential amino acids represented by methionine. The amino acid composition of the feed in this study also confirmed this finding. Therefore, essential amino acids are also hot spots in aquatic nutrition research [33]. In contrast, the present study innovatively evaluated the application value of nonessential amino acid (glycine) in high-proportion plant-based protein feed, which was inspired by a study in piglets. Although glycine is a nonessential nutrient for piglets, they cannot synthesize sufficient glycine and must be added to their feed to achieve optimal growth performance [34]. Because plant-based protein sources contain relatively little glycine, supplementation with glycine may promote the utilization of vegetable protein. In the present study, glycine ameliorated the growth damage caused by FSBM substitution, including WGR and SGR. Recently, the growth-promoting effect of glycine has also been verified in aquaculture animals. Adding glycine to high-SBM feed significantly promoted the growth performance of largemouth bass (M. salmoides) [21] and hybrid striped bass (Morone saxatilis ♀ × Morone chrysops ♂) [35]. Similarly, in crustaceans, glycine has been shown to promote the growth performance of giant freshwater prawns (Macrobrachium rosenbergii) [36] and whiteleg shrimp (L. vannamei) [13]. In addition, as a critical organ, the hepatopancreas enlarges when the immune system weakens, and the digestive function is aberrant [37, 38]. In the present study, the HSI was decreased by glycine, which indicated that glycine may enhance hepatopancreas immunity.
Glycine, the simplest amino acid in the body, has a conserved and classic metabolic process [39]. There is a crosstalk with the metabolic network of glycine and serine, threonine, and other amino acids [40, 41]. Hence, glycine supplementation may affect the amino acid profile in vivo. In the present study, the systemic amino acid analysis revealed that in the FSBM substitution groups, particularly in the 75% FSBM substitution group, glycine supplementation tended to increase the contents of aspartate, isoleucine, and leucine in the whole shrimp body. Glycine metabolism is not directly related with aspartate. However, studies have shown that glycine may increase the absorption of aspartate [42]. The interaction between glycine and BCAAs has also been studied in mammals [43]. On the one hand, the glycine nitrogen group is transferred to leucine, valine, and isoleucine [44]. On the other hand, studies have also demonstrated that impaired hepatic BCAA metabolism in obesity models induced a decline in glycine concentration in the circulatory system. In that case, BCAA-deprivation diets restored glycine contents in serum [45]. Therefore, glycine and BCAA metabolism are closely related. However, the potential underlying mechanism still needs to be fully clarified. FSBM substitution significantly affects the amino acid composition of the muscles, specifically by reducing essential amino acids, including isoleucine, leucine, and lysine, which was consistent with the trend of amino acids in feed.
The hepatopancreas is the major organ in crustaceans, with a large volume in the cephalothorax [46]. It is responsible for digesting and absorbing nutrients, storing energy, and resisting external toxins and other physiological functions [47]. The tube wall is composed of four types of cells, which can be divided into secretory cells (B cells), absorbent cells (R cells), fiber cells (F cells), and embryonic cells (E cells) according to their morphology. Among them, B cells are related to the synthesis of digestive enzymes and are responsible for enzyme storage. R cells are responsible for lipid storage in the hepatopancreas [48]. Histological research on the hepatopancreas provides important information on the nutritional status of shrimp. In this study, an overall analysis of hepatopancreas structure revealed that FSBM substitution resulted in irregular lumens, numerous vacuoles, and even detachment of the lumen and basement membrane, presenting a severe pathological process. At the same time, the number of B and R cells decreased, indicating that excessive substitution of FM with plant-based protein disrupted the structure of hepatopancreas, which was similar with the previous studies [49, 50]. Supplementing with glycine alleviated the problem of luminal detachment and made the luminal arrangement tight, increasing the number of B and R cells. The adjustment of hepatopancreas structure by glycine was less studied in crustaceans, but it is undeniable that dietary amino acid supplementation improves the hepatopancreas structure of shrimp [51]. In addition, studies in mammals have shown that dietary supplementation with glycine can alleviate liver steatosis and prevent liver fibrosis [52, 53]. This may be related to the enhancement of liver antioxidant capacity by glycine. In the current study, glycine addition reduced the increase in SOD enzyme activity caused by FSBM substitution. SOD mainly functions in mitochondria. Glycine’s regulation of SOD also indirectly reflects the regulation of mitochondrial activity, which is consistent with the conclusion that glycine protects mitochondrial structural integrity in mammals [54].
Muscle quality is a comprehensive manifestation of a series of indicators. In addition to sensory quality, the myofiber structure plays a decisive role. Muscle tissue is composed mainly of myofibers and connective tissue. Myofibril is the main component of myofibers and is repeatedly assembled from a large number of sarcomeres. Studies have shown that shortening of sarcomeres reduces muscle quality [55]. In addition, the gap between myofibers or myofibrils is another important factor that affects the texture of fish muscle. Studies in Atlantic salmon (Salmo salar) revealed that an increase in the gap between myofibrils decreased the hardness of muscle [56]. An increase in the distance between myofibers reduced the hardness of the muscle of grass carp (Ctenopharyngodon idella) [57]. In the present study, glycine supplementation alleviated the decrease in sarcomere length caused by FSBM substitution. Moreover, glycine also decreased the gap between myofibers. Numerous studies have shown that dietary amino acid supplementation improves muscle quality. For example, arginine supplementation significantly increased protein, fat, and collagen contents in grass carp muscle as well as muscle hardness [58]. Supplementation with lysine reduced the diameter of myofibers in Nile tilapia (Oreochromis niloticus) [59]. The function of glycine in promoting muscle quality was also verified in hybrid striped bass by Li, He, and Wu [60], who demonstrated that glycine promoted an increase in existing myofiber size rather than an increase in the number of new myofibers. In addition, as a component of creatine, glycine may also promote muscle development by increasing the content of creatine. The mRNA expression of fast fiber MyHCs (sMyHC1 and sMyHC2) was reduced by glycine, which was consistent with the trend caused by creatine supplementation [61] and which further confirmed the synergistic effect between glycine and creatine. Given the high proportion of muscle in shrimp body weight [62], abnormal muscle structure may be one of the reasons for the reduced growth performance of shrimp fed high FSBM. Glycine supplementation improved the muscle structure, thus promoting the growth performance of shrimp.
Studies in mammals also suggest that glycine may promote muscle development by reducing the production of reactive oxygen species and proinflammatory cytokines, as higher concentrations of reactive oxygen species and proinflammatory cytokines can trigger muscle degradation pathways [63]. Previous studies in our laboratory also confirmed through transcriptome and metabolomic analysis of largemouth bass that high-FSBM diets can induce oxidative stress by damaging glycine, serine, and threonine metabolism [23]. Therefore, we tested the effect of glycine supplementation on muscle oxidative stress. Surprisingly, only the 100% substitution group significantly increased the levels of antioxidant indicators in the muscle, including SOD and T-AOC activities, which were relieved by glycine supplementation. Similar results have also been validated in carp [64] and Nile tilapia [65]. The specific mechanism may involve the addition of glycine to activate the GSH system. However, some studies have also shown that an increase in antioxidant enzyme activity indicates strong antioxidant capacity [66]. The different trial environments, diets, and stressors may explain these differences. Undeniably, the elevated antioxidant system indicated that shrimp were suffering from oxidative stress. In addition, the effect of glycine on the expression of classical immune-related genes was also examined. Toll and imd pathways are two major signaling pathways necessary for immune-related gene induction during pathogen invasion. Tumor necrosis factor receptor-associated factor 6 (TRAF6) is an important signal transducer for the Toll-like receptor (TLR) signaling pathway. In the present study, the mRNA expression of imd was not regulated by glycine, but glycine alleviated the increase in toll and traf6 mRNA expression caused by FSBM substitution. Related studies have also validated this effect in piglets [63]. Glycine increased muscle mass by alleviating the increase in the mRNA expression of toll and traf6 induced by LPS in piglet muscles [63]. Lipopolysaccharide β-glucan binding protein (LGBP) is an important pattern recognition protein that can recognize and respond to invaders. In the present study, glycine alleviated the increase in lgbp gene expression caused by FSBM substitution. Taken together, glycine can serve as an effective immune regulator to enhance muscle immunity.
In conclusion, the present study revealed the importance of glycine in improving the utilization efficiency of FSBM in shrimp for the first time. The application of glycine ensures that replacing 50% of FM with FSBM does not inhibit shrimp growth performance, together with improving muscle structure, and enhancing muscle antioxidant and immunity. Considering that other plant-based proteins cannot also provide sufficient glycine for shrimp, glycine should be considered as a critical functional amino acid, and moderate glycine supplementation is a good strategy for developing low FM diets and reducing environmental pollution in aquaculture.
Conflicts of Interest
The authors declare no conflicts of interest.
Author Contributions
Qiang Chen, Tao Han, and Jiteng Wang: conceptualization, resources, and funding acquisition. Jieyu Dai, and Songming Chen: investigation, data curation, formal analysis, and validation. Qiang Chen, Fen Dong, and Yunping Tang: project administration, software, and supervision. Jieyu Dai, Sheenan Harpaz, and Tao Han: writing–original draft and writing–review and editing. All authors discussed the results and improved the manuscript.
Funding
This work was supported by Key R&D Program of Zhejiang (No: 2021C04016), the Zhoushan Science and Technology Project (No: 2023C41008), Ten-Thousand Talents Plan of Zhejiang Province (No: 2022R52021), the Zhejiang Province “Triple Agriculture Nine Aspects Cooperation” Science and Technology Cooperation Program (No. 2022SNJF064), and “Pioneer” and “Leading Goose” R&D Program of Zhejiang (No: 2022C04020).
Supporting Information
Additional supporting information can be found online in the Supporting Information section.
Open Research
Data Availability Statement
The data that support the findings of this study are available from the corresponding author upon reasonable request.


