Does Dietary Supplementation With Quercetin or Rutin Impact Growth, Stress, and Immunity in Pikeperch (Sander lucioperca) and the Water Microbial Community in Recirculating Aquaculture?
Abstract
Pikeperch Sander lucioperca is a species mainly reared in recirculating aquaculture systems (RASs), but it remains very sensitive to stress and handling. Plant phenolic compounds such as quercetin or rutin are frequently investigated as feed additives to improve the growth and well-being of fish reared in RAS, but their impact on pikeperch and RAS microbial communities has never been studied. Our objectives were to (i) test the effect of quercetin or rutin addition to feed (2.2 g kg−1 diet) on the growth, stress, and innate immunity of pikeperch reared in RAS and (ii) assess the consequence of those additives on the RAS water microbial communities. Pikeperch of 307 (±45) g starting weight were reared in nine experimental RAS (n = 3) and fed for 84 days on a diet enriched or not (control treatment) with quercetin or rutin (feeding rate: 1.5%). Considering the start (T0) and the end (T84) of the experiment, we compare the fish growth, feed conversion ratio (FCR), morphoanatomical and physiological status, and the water microbial diversity and composition through a metabarcoding approach performed on the 16S rRNA gene. Whereas no effect on fish was recorded with quercetin (624.0 ± 21.9 g final weight), rutin (558.0 ± 10.7 g final weight) reduced pikeperch growth (0.54 vs. 0.69%–0.64% day−1), and increased FCR (1.70 vs. 1.2–1.4) compared to control (622.0 ± 16.8 g final weight) and quercetin treatments, respectively. No effect was observed on all fish physiological parameters analyzed separately, but a multifactorial analysis reveals that fish fed with rutin have a different overall physiological state. Quercetin induced a shift in the microbial community structure and composition, whereas there was no effect of treatments on microbial richness or evenness. A dietary supplementation with quercetin or rutin has no or a negative impact on pikeperch growth and physiology and modifies the microbial diversity in RAS. Effects of additives being species-dependent, precautions must be taken when formulating feed supplements, which must be based on precise studies.
Summary
- •
Rutin reduced pikeperch growth and increased feed conversion ratio.
- •
A shift in the microbial community (structure, composition) was induced by quercetin.
- •
Neither quercetin nor rutin affected stress or immunity indicators in pikeperch.
1. Introduction
Pikeperch (Sander lucioperca) is a freshwater fish popular with consumers and a promising aquaculture species in Europe [1, 2]. It is, however, highly sensitive to environmental stressors and handling, affecting growth rates and inducing disease outbreaks and high mortality in intensive aquaculture [1, 3–5]. With farming formerly done mainly in ponds or lakes, pikeperch is now increasingly produced in recirculating aquaculture systems (RASs) in which the microbial communities play a major role in the productivity of these farming systems through the biofilter efficiency and in the prevention of disease [6–8].
Plant-derived compounds added to diets as alternatives to conventional chemotherapy have become a crucial research topic in the effort to sustain aquaculture intensification as a way to minimize excessive antibiotic use and curb the resulting resistance [9–11]. Numerous studies testing supplements in aquaculture feeds have found that plants with a high content of phenols, alkaloids, quinones, terpenoids, or lectins reduce stress symptoms, improve innate or adaptive immune responses, or promote growth [12–15]. The effects of plant additives on pikeperch have been tested sparsely. The intake of herbs Astragalus radix and Lonicera japonica has been shown to affect the body protein content and cytological and histological indicators of pikeperch liver and midgut [16]. Ingestion of powdered water hyacinth leaves improves growth, antioxidant capacity, lysozyme activity, and alternative complement activity [17]. The authors postulated that the immunomodulatory properties of water hyacinth can be attributed to its content of phenolic compounds such as quercetin and rutin.
The polyphenols quercetin and rutin are among the most frequently tested plant additives in aquaculture research. The addition of 0.2–1.6 g quercetin kg−1 of feed improved the growth and antioxidant activity in Nile tilapia Oreochromis niloticus [18]. In rainbow trout Oncorhynchus mykiss, addition of quercetin at 10 g kg−1 feed increased lysozyme and protein content as well as bactericidal activity [19]. Quercetin also increased growth and plasma lysozyme activity in olive flounder Paralichthys olivaceus, when added at 2.5 and 5 g kg−1 to feed [20]. More recently, similar positive effects of quercetin-supplemented diets have been confirmed on fish growth performance, feed efficiency, immunity, or antioxidant status in several freshwater species like blunt snout bream Megalobrama amblycephala [21], snakehead fish Channa argus [22], and common carp Cyprinus carpio [23]. Rutin at 0.5, 1, and 2 g kg−1 feed for rainbow trout decreased liver oxidative stress upon antibiotics exposure [24]. In silver catfish Rhamdia quelen, rutin inclusion at 1.5 g kg−1 feed led to lower plasma cortisol concentration, and stimulated multiple antioxidant responses of tissues, including superoxide dismutase (SOD) and catalase (CAT) [25]. In a more recent study, Xu et al. [26] recommended the addition of rutin (0.8–1 g kg−1) in the diet to improve the growth and antioxidant response of grass carp Ctenopharyngodon idella. Thus, numerous positive effects of feed supplementation with quercetin or rutin have been observed on a large diversity of fish species. However, the impact of this supplementation has not yet been evaluated on pikeperch.
Dietary flavonoid intake can also change the fish gut microbiome [27, 28] but its effect on the RAS microbial community is not known. Fish inoculate microbial communities that are distinct from the ones found in the water in RAS systems [29]. Considering the potential antibacterial and antimicrobial activities of molecules added to diets [30, 31], it appears essential and useful to assess the effects of such dietary supplementations on microbial communities in the functioning of RAS [32].
This study aims (i) to test the effect of adding quercetin or rutin at 2.2 g kg−1 as feed additives on the growth, stress, and innate immunity of pikeperch during grow-out in RASs and (ii) to evaluate potential effects of these flavonoid amendments on RAS microbial diversity. The inclusion level was chosen based on the average concentration used in studies, cited above, that had positive results and to allow for a comparison between quercetin and rutin the same inclusion level was applied for the two compounds.
2. Materials and Methods
2.1. Fish and Experimental Facilities
The experiment was conducted for a period of 84 days at the Experimental Platform for Aquaculture—EPA (agreement number C54-547-18) of the L2A at the Faculty of Sciences and Technology of the University of Lorraine, France, and in agreement with the European and French National Legislation on Animal Welfare (reference number APAFIS #32778-2021120115112007 v1). Initially, juvenile pikeperch S. lucioperca (n = 5000) were received from INAGRO (Belgium) (mean body weight = 10 g) and held at the EPA where they were fed for the 11 months preceding the experiment with a commercial feed (Sturgeon Grower, sinking, Le Gouessant, France; 47% proteins, 13% lipids, different granulometries according to the le Gouessant rationing table).
Fish were size graded and 621 medium-sized (307 ± 45 g) pikeperch were randomly distributed to the nine experimental RASs for an acclimatization period of 4 weeks. Each RAS comprised a 2 m3 tank, a 63 µm mechanical drum filter, an UV filter (55 W), a 350 L buffer tank, and a fluidized bed biofilter (480 L, 230 L filter medium). Water circulated through the system at a flow rate of 2.8 m3 h−1 and water was only added to replace loss from evaporation and drum filter backwash. The RAS was set up in individual climate and light-controlled rooms, maintaining a water temperature of 25°C (±1°C) and a 12 h photoperiod (L:D 12:12) at a maximum light intensity of 10 lx provided by white light LEDs. One week before the start of the experiment, the feed for all tanks was transitioned to the feed of the control group and fed at a daily ratio of 1% body weight. The feed was continuously distributed by an automated feeder from 9:00 to 18:00 h. Fish were not fed for 24 h before any sampling.
2.2. Experimental Diets and Fish Feeding
Three types of experimental pelleted feed were manufactured via extrusion (SPAROS, Portugal) (Table 1). In two of the diets, quercetin or rutin were included at 2.2 g kg−1. The pellets were sinking and of a size of 5.5 mm. The feed was distributed throughout the day via one automated feeder per tank and provided at a feeding rate of 1.5% of the total biomass per day. Every 3 weeks, the total biomass per tank was assessed by weighing the fish collectively in order to adjust the feed ratio.
| Treatment | Control | Quercetin | Rutin |
|---|---|---|---|
| Ingredients (%) | (%) | (%) | (%) |
| Fishmeal (super prime) | 15.000 | 15.000 | 15.000 |
| Fishmeal 60 | 10.000 | 10.000 | 10.000 |
| Krill meal | 4.000 | 4.000 | 4.000 |
| Brewer’s yeast | 2.000 | 2.000 | 2.000 |
| Soy protein concentrate | 13.000 | 13.000 | 13.000 |
| Pea protein concentrate | 4.600 | 4.600 | 4.600 |
| Wheat gluten | 10.000 | 10.000 | 10.000 |
| Corn gluten meal | 5.000 | 5.000 | 5.000 |
| Soybean meal 44 | 5.000 | 5.000 | 5.000 |
| Sunflower meal 40 | 2.000 | 2.000 | 2.000 |
| Wheat meal | 9.945 | 9.721 | 9.727 |
| Faba beans (low tannins) | 3.700 | 3.700 | 3.700 |
| Quercetin | — | 0.224 | — |
| Rutin | — | — | 0.218 |
| Vitamin and mineral premix | 1.000 | 1.000 | 1.000 |
| Vitamin E50 | 0.055 | 0.055 | 0.055 |
| Antioxidant | 0.200 | 0.200 | 0.200 |
| Monocalcium phosphate | 2.000 | 2.000 | 2.000 |
| Monosodium phosphate | 0.700 | 0.700 | 0.700 |
| Calcium carbonate | 1.600 | 1.600 | 1.600 |
| Binder (bentonite) | 0.500 | 0.500 | 0.500 |
| L-lysine HCl 99% | 0.150 | 0.150 | 0.150 |
| DL-methionine | 0.050 | 0.050 | 0.050 |
| Fish oil | 5.500 | 5.500 | 5.500 |
| Rapeseed oil | 4.000 | 4.000 | 4.000 |
2.3. Fish Growth and Morphoanatomic Variables
Before the start of the experiment, all fish were subjected to a low dose of anesthetics (MS 222, 75 mg L−1 + 75 mg L−1 NaHCO3), individually weighed and their total length measured. The number of individuals was adjusted to 64 per tank. Total biomass per tank was subsequently determined on days 21, 42, and 63, to adjust the amount of feed given, and at the final sampling on day 84.
2.4. Fish Physiological Status
For determination of lysozyme activity, 10 mL of plasma samples were added to 10 µL phosphate buffer and 130 µL Micrococcus lysodeikticus solution in a 96-well plate. The plate was incubated under agitation and read at 450 nm every 5 min until absorbance decreased by 50%. One unit of lysozyme activity is defined as the amount of sample causing a decrease in absorbance of 0.001/min.
Cortisol level in blood plasma was assayed using a commercially available kit (DIAsource, Belgium) according to the manufacturer’s instructions, with intra-assay precision of 10.1% CV and interassay precision of 6.7% CV. In brief, 20 µL of each calibrator, control, and specimen sample were pipetted into a 96-well plate in duplicates. The colorimetric reaction mixture was then added and absorbance was read at 450 nm.
Activity of CAT and SOD in liver homogenate were measured using commercially available kits (ZELLX, Germany) according to the manufacturer’s instructions, with intra-assay precision of 4.1% CV and interassay precision of 11.3% CV for CAT and intra-assay precision of 9.6% CV and interassay precision of 10.1% CV for SOD. Briefly, liver tissue samples were homogenized in cold PBS, and centrifuged at 10,000 g for 15 min. at 4°C. Twenty-five microliters of supernatant and standards were pipetted in a 96-well-plate. The colorimetric reaction mixture was then added and the absorbance was read at 560 nm. One unit of CAT activity is defined as the amount of the sample catalyzes the decomposition of 1 μM of H2O2 to H2O and O2 in 1 min.
Plasma complement (ACH50) was determined by measuring the hemolytic activity using rabbit erythrocytes as targets [33], as described by Baekelandt et al. [3] with modifications. In brief, serial dilutions (40, 50, 80, 100, 160, 200, 320, 400, 640, and 800 times) of plasma samples in veronal buffer (21 mM tris (hydromethyl) aminomethane, 4.7 mM KCl 2 mM CaCl2, 140.5 mM NaCl, 1.2 mM MgSO4·7H2O, 5.5 mM glucose, 0.5%, adjusted with 1 M acetic acid to a pH of 7.4) were prepared. Then 60 µL of each dilution were mixed with 10 µL of 3% rabbit erythrocytes suspended in veronal buffer in a 96-well plate. The plates were incubated at 27°C for 2 h under agitation of 300 rpm and then centrifuged at 3000 g for 5 min. In total, 35 µL of supernatants were collected and read at 405 nm. Rabbit erythrocytes were added to 60 µL veronal buffer or distilled water for the negative (spontaneous hemolysis) and positive (total lysis) controls respectively. ACH50 was calculated by linear regression and corresponds to the lysis of 50% of the rabbit erythrocytes.
2.5. Quercetin and Rutin in Water of the Tanks
The presence of quercetin and rutin was checked in tank water at the beginning (T0) and at the end of the experiment (T84). From each tank, 500 mL of water were collected in glass bottles, stored at 4°C and extracted within 48 h. Two hundred and fifty milliliters of water were concentrated on 200 mg C18 SPE PP columns (Chromabond, Macherey-Nagel) via a vacuum pump after washing with 3 mL MeOH and conditioning with 3 mL ultrapure water. Samples were extracted with 3 mL methanol, dried under nitrogen flow and reconstituted in 200 µL of methanol/water (20:80 v/v).
UHPLC-MS analysis was done on Vanquish followed by Orbitrap ID-X Systems (Thermo Scientific). The mobile phase consisted of water/formic acid 0.1% and methanol/formic acid 0.1% at a flow rate of 200 mL min−1. The mass spectroscopy was performed in a positive mode. Detection of quercetin (exact mass [dimensionless] = 302.04265265) or rutin (exact mass = 610.15338487) was inspected by manually searching ranges for the positive ions (m/z of 303.00–303.10 for quercetin and 611.05–611.20 for rutin). Detection limits in the concentrated sample are 2 µmol L−1 (0.6 mg L−1) for quercetin and 0.3 µmol L−1 (0.2 mg L−1) for rutin.
2.6. Microbiological Analyses in Water of the Tanks
Four hundred milliliters of water were collected in triplicate from each tank for microbiological analysis at T0 and T84. They were stored at −20°C in disposable PE bottles (Corning Life Science) from the upper 30 cm of the water column. For each sample water was filtered through a 0.2 µm membrane filter (Whatman Nuclepore Track-Etched Membranes, Merck, Germany) using a vacuum filtration apparatus. The membrane filter was then used to extract DNA.
DNA extraction was performed using DNeasy PowerWater kit (Qiagen, Hilden, Germany) according to the manufacturer recommendations. DNA concentration was measured by the QuBit4 Fluorometer (Invitrogen, Waltham, USA) method. In addition, purity of the DNA extractions was assessed by measuring both 260/280 nm and 260/230 nm ratios with a NanoDrop spectrophotometer (Thermo Scientific, Waltham, USA). DNA was stored at −20°C until use. Sequencing was performed of the V3-V4 hypervariable regions of the bacterial 16S rRNA at the Illumina MiSeq platform at Novogene Bioinformatics Technology Co., Ltd. (Beijing, China) using the primers 341F (5-CCTAYGGGRBGCASCAG-3) and 806R (5-GGACTACNNGGGTATCTAAT-3) flanking the V3 and V4 (Figure S1).
Data were subsequently imported into the FROGS pipeline (Find Rapidly OTU with Galaxy Solution) implemented on a galaxy instance (v.2.3.0) (http://sigenae-workbench.toulouse.inra.fr/galaxy/) [34, 35]. After a quality control, 16S paired-end sequences were merged into contigs with VSEARCH [36]. Sequences were dereplicated before being clustered using SWARM algorithm (v.2.1.5) [37] with a first denoising step using an aggregation distance equal to 1 and a second one equal to 3. Chimera was removed using VSEARCH [36]. Filters were applied to remove clusters which are not present in at least three samples or with an abundance below a 0.005% threshold [38]. The taxonomic assignation of each amplicon sequence variant (ASV) was performed using the BLAST tools against [39] the database SILVA 132 16S [40]. The dataset was rarefied by randomly selecting subsets of sequences with the fewest read counts. Phyloseq (1.26.1) R package was used to identify community composition analysis, to normalize and to generate α-diversity indexes (richness and evenness) after a rarefaction curve using the transform counts method [41].
2.7. Statistical Analyses
Statistical analyses for microbial investigations and fish variables were carried out using R software version 3.3.1 (R Development Core Team, http://www.R-project.org). Data for fish variables were averaged per tank and expressed as mean ± standard error (SE). Assumptions of normality and homoscedasticity of the data were tested by Shapiro–Wilk and Levene Test, respectively. When assumptions were met, statistical significances between treatments were compared by one-way analysis of variance (ANOVA). When assumptions were not met, as was the case with data on plasma cortisol concentrations, treatments were compared by Kruskal–Wallis rank sum test. Statistical significance was determined at p ≤ 0.05. A multifactorial data analysis, principal component analysis (PCA) followed by a three-group hierarchical clustering on the basis of active variable of PCA, was performed. Tank averages of physiological status variables were used for PCA (HSI, SSI, Lysozyme activity, Complement Activity, Haematocrit, Cortisol, CAT, and SOD).
For microbiological variables, we first compared α-diversity indexes to summarize the structure microbial communities with respect to its richness (number of ASV) and Simpson-Yule index as evenness (distribution of abundances of the ASV). After normality and homoscedasticity verifications (Shapiro and Bartlett test respectively), ANOVA (significance was declared at p < 0.05) was performed on richness and evenness indices, and Tukey HSD test was used for pairwise comparisons using “agricolae” package. The β-diversity, to assess the degree of community differentiation, was estimated by using the relative abundance matrices and multivariate analyses. The dissimilarities (Bray–Curtis distances) among soil treatments were assessed using principal coordinate analysis (PCoA) and were followed by between-class analysis (BCA) using the “ade4TkGUI” package. In addition, significant difference among treatments was determined using a Mantel test performed on 105 permutations (vegan 2.2.1 R package) [42]. After testing the multivariate homogeneity of group dispersions, permutational multivariate analysis of variance (PERMANOVA) was performed using the “adonis” function (vegan 2.2.1 R package) to test the link between bacterial community composition obtained with the different methods and the environmental variables (9999 permutations). Plots were drawn using the R packages ggplot2 (3.1.1) and phyloseq (1.26.1) [41].
3. Results
3.1. Pikeperch Mortality and Growth
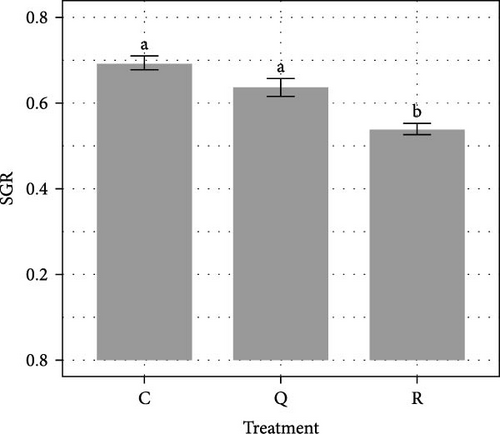
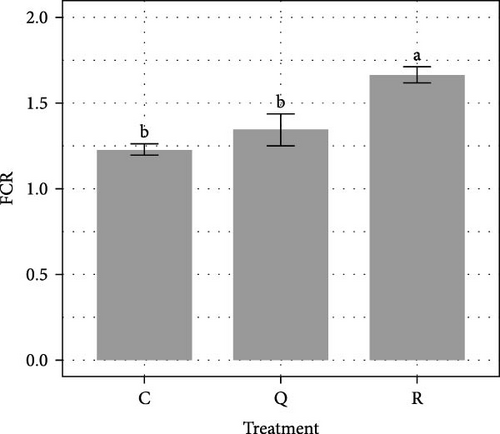
Over the 84-day experimental period, virtually no mortality was recorded (mean survival rates > 99%). The average SGR over the course of the 84-day experiment was significantly lower (ANOVA, F(2, 6) = 20.4, p = 0.002) in the rutin treatment, with 0.54 ± 0.02% day−1 than in the control with 0.69 ± 0.02% day−1 (Tukey HSD, p = 0.002) and quercetin treatments with 0.64 ± 0.02% day−1 (Tukey HSD, p = 0.017) (Figure 1A). As a result, after 84 days of rearing, the average weight of pikeperch in the rutin treatment is on the verge of being significantly lower (p = 0.055). Adding rutin lead to a significantly higher (ANOVA, F(2, 6) = 14.95, p = 0.005) FCR with 1.66 ± 0.05 than the ones observed in the control with 1.35 ± 0.08 (Tukey HSD, p = 0.004) and the quercetin treatments with 1.23 ± 0.04 (Tukey HSD, p = 0.020) (Figure 1B).
3.2. Pikeperch Physiological Status
Comparing each variable separately, there were no statistically significant differences in the zootechnical indicators between the treatment groups, even though we are on the verge of observing a significant effect on haematocrit values (lower values with rutin, p = 0.051) (Table 2). Using a multifactorial analysis of physiological parameters, it appears that the fish of control and rutin treatments were distinct from each other, while the quercetin treatment was found in groups with both (Figure 2). The fish of the cluster including the three rutin replicates were characterized by lower haematocrit, plasma cortisol level, and complement activity, and higher lysozyme activity compared to fish of the two other clusters.


| Variable | Control | Quercetin | Rutin | Test statistic and p-Value |
|---|---|---|---|---|
| Survival (%) | 100.0 ± 0.0 | 99.0 ± 0.5 | 99.0 ± 0.5 | F(2, 6) = 2.00, p = 0.22 |
| Weight (g) | 622.0 ± 16.8 | 624.0 ± 21.9 | 558.0 ± 10.7 | F(2, 6) = 4.87, p = 0.06 |
| Total length (cm) | 39.0 ± 0.2 | 39.4 ± 0.3 | 38.1 ± 0.3 | F(2, 6) = 4.22, p = 0.07 |
| FCF | 11.00 ± 0.06 | 1.02 ± 0.07 | 1.09 ± 0.03 | F(2, 6) = 0.49, p = 0.63 |
| CV (%) | 37.7 ± 1.8 | 38.2 ± 3.6 | 49.3 ± 4.7 | F(2, 6) = 3.28, p = 0.11 |
| HSI (%) | 1.01 ± 0.09 | 1.24 ± 0.11 | 1.06 ± 0.10 | F(2, 6) = 1.33, p = 0.33 |
| SSI (%) | 0.39 ± 0.04 | 0.26 ± 0.04 | 0.33 ± 0.01 | F(2, 6) = 0.61, p = 0.58 |
| Lysozyme activity (U mL−1) | 16.20 ± 0.78 | 16.90 ± 0.92 | 19.20 ± 1.28 | F(2, 6) = 2.47, p = 0.17 |
| Haematocrit (%) | 25.60 ± 0.75 | 26.50 ± 0.85 | 23.30 ± 0.53 | F(2, 6) = 5.07, p = 0.05 |
| Cortisol (ng mL−1) | 14.10 ± 3.58 | 14.40 ± 3.19 | 8.35 ± 0.44 | χ2 = 1.16, df = 2, p = 0.56 |
| Complement activity (ACH50) | 64.00 ± 5.04 | 57.30 ± 1.62 | 51.80 ± 2.70 | F(2, 6) = 3.20, p = 0.11 |
| CAT (U g protein−1) | 249.0 ± 40.0 | 209.0 ± 38.4 | 204.0 ± 24.2 | F(2, 6) = 0.49, p = 0.64 |
| SOD (U g protein−1) | 105.0 ± 12.3 | 106.0 ± 21.1 | 105.0 ± 21.8 | F(2, 6) = 0.00, p = 1.00 |
- Note: Groups were compared by one-way ANOVA or Kruskal–Wallis rank sum test.
- Abbreviations: CAT, catalase; SOD, superoxide dismutase.
3.3. Quercetin and Rutin Concentrations in Water of the Tanks
Quercetin and rutin were below the detection limit of water samples in their respective treatments as indicated by the absence of clear peaks at the mass of the positive ions of these molecules and overall low signal intensity at their mass range (example spectra in Figure S2).
3.4. Microbiological Analyses of Tank Water
3.4.1. α-Diversity
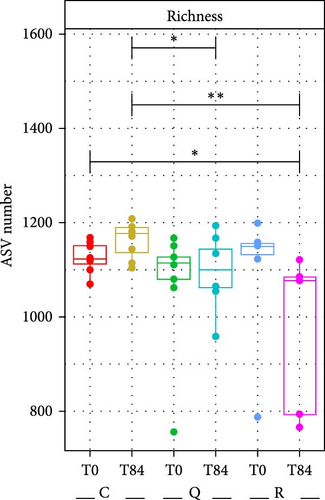
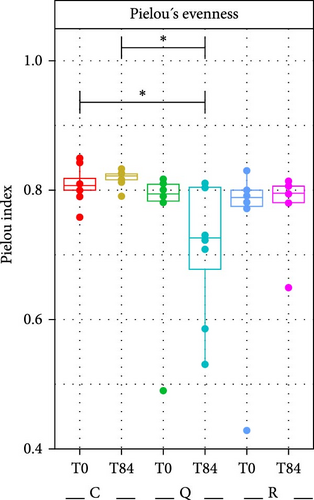
There were no significant differences in the richness (number of ASVs) and evenness between the treatments and sampling times as indicated by the calculation of bacterial richness in the fish tanks (Figure 3). The ANOVA results confirmed this finding. However, this seems to be linked to the presence of outliers at T0 for the treatments quercetin and rutin respectively. There was a tendency toward a lower richness at T84 with rutin and quercetin. Similarly, evenness was lower when quercetin was added.
3.4.2. β-Diversity
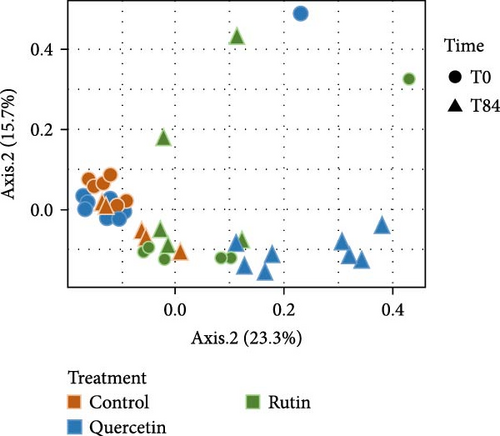
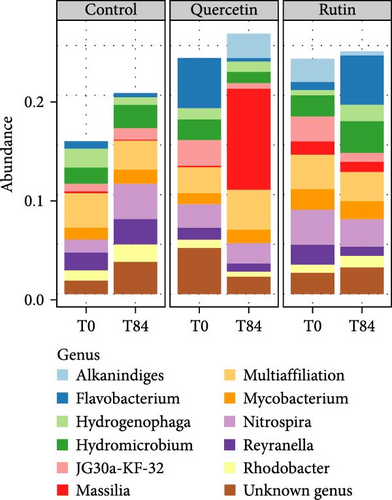
The PCoA of β-diversity featured significant separation on the first principal component (22.3% contribution) and the second principal component (19.2% contribution) axes (Figure 4). The between-plot variance of microbial communities β-diversity is best explained by the quercetin treatment. The samples tended to cluster according to the quercetin treatment after 84 days. PERMANOVA shows significant difference in the structure (approximated by β-diversity) of the microbial communities (p = 1.1e − 05∗∗∗) among the microbial communities. The bacterial composition at the genus level revealed that in the quercetin treatment, Flavobacterium decreased while Massilia increased (Figure 5).
4. Discussion
To our knowledge, our study is the first to date investigating the consequences of dietary supplementation of pikeperch with two flavonoid molecules supposed to improve growth and welfare in fish over such a long duration (84 days). Despite a longer experimental duration than most studies [10], we observed very low mortality rates (<1%) compared to the 3%–41% recorded by Baekelandt et al. [3] after 63 days or the 3%–10% recorded by Rufchaei et al. [17] after 7 weeks. Moreover, pikeperch of our study showed overall good growth rates, our control group having a mean specific rate of 0.7% day−1, value similar to the 0%–1.1% day−1 (mean: 0.7% day−1) recorded by Baekelandt et al. [3] and 0.76% day−1 obtained by Rufchaei et al. [17] with smaller fish (initial mean body weight of 90 g and 21 g, respectively). Regarding the initial physiological status of pikeperch (Table 3), we observed that pikeperch had low concentrations of cortisol in the plasma (14.6–19.1 ng mL−1), corresponding to baseline levels of percids during low stressful situations (2–40 ng mL−1 [43]) and values frequently measured in this species (16–32 ng mL−1 [3]). This confirms that our experiment took place in suitable conditions, with fish whose physiological state was ideal for the experiment.
| Parameter | Control | Quercetin | Rutin | Test statistic and p-Value |
|---|---|---|---|---|
| Weight (g) | 347 ± 6 | 366 ± 6 | 355 ± 7 | F(2, 6) = 2.02, p = 0.21 |
| Total length (cm) | 34.0 ± 0.1 | 34.5 ± 0.2 | 34.2 ± 0.2 | F(2, 6) = 1.94, p = 0.22 |
| FCF | 0.86 ± 0.02 | 0.90 ± 0.03 | 0.90 ± 0.04 | F(2, 6) = 0.53, p = 0.61 |
| CV (%) | 24.1 ± 1.4 | 25.9 ± 1.5 | 27.7 ± 0.7 | F(2, 6) = 1.90, p = 0.23 |
| HSI (%) | 0.95 ± 0.03 | 1.16 ± 0.05 | 0.98 ± 0.09 | F(2, 6) = 2.80, p = 0.14 |
| SSI (%) | 0.71 ± 0.07 | 0.64 ± 0.02 | 0.64 ± 0.01 | F(2, 6) = 0.61, p = 0.58 |
| Haematocrit (%) | 22.50 ± 1.26 | 23.90 ± 1.53 | 21.90 ± 0.44 | F(2, 6) = 0.81, p = 0.49 |
| Cortisol (ng mL−1) | 19.10 ± 5.20 | 14.60 ± 2.02 | 17.50 ± 5.90 | χ2 = 0.62, df = 2, p = 0.73 |
| Complement activity (ACH50) | 67.90 ± 9.03 | 76.70 ± 4.65 | 66.70 ± 12.30 | F(2, 6) = 0.35, p = 0.72 |
- Note: Groups are compared by one-way ANOVA or Kruskal–Wallis rank sum test.
- Abbreviation: RAS, recirculating aquaculture system.
4.1. Pikeperch Growth Performance
Addition of quercetin and rutin did not lead to better performance, and in the case of rutin, growth and feed conversion were negatively impacted. This finding contradicts the results of other studies reporting that feed supplementation with these flavonoids improved fish growth [18, 20, 26, 44]. Two main hypotheses may explain our results. The first one is based on the fact that the palatability of the feed may have been reduced by rutin supplementation. Indeed, we observed (without any quantitative evaluation) that the RAS in the rutin treatment contained more uneaten feed than the tanks of the two other treatments. In our study, FCR was calculated based on feed distribution and not on feed consumed. The higher FCR observed especially in the rutin treatment may therefore be due to less feed ingested and not by a lower conversion efficiency. Phenolic compounds, including quercetin and rutin, have been linked to bitter taste in foods [45–47] and may have negatively affected the palatability of the feed [48]. Any positive effects of adding compounds to the feed may thus have been counteracted by the simple fact that the fish were eating less. Such unintended side effects may be regulated by adding betaine (glycine betaine or trimethylglycine), an amino acid derivative with important synergistic properties with other substances, that has been found to improve palatability for different fish species [48, 49] as it has also been demonstrated in juvenile pikeperch [50]. Our second hypothesis is that pikeperch are potentially more sensitive to these two flavonoids than other species tested so far. The concentration of quercetin and rutin in 2.2 g kg−1 feed that we administered may have been too high for this species. For quercetin, this was in the concentrations of 2.5 and 5 g kg−1 given to olive flounder P. olivaceus [20, 51], and 1.6 g kg−1 in the feed of tilapia O. niloticus [18]. For rutin, it was comparable to the 2 g kg−1 in the feed of rainbow trout O. mykiss [24] and 1.5 and 3 g kg−1 administered to silver catfish R. quelen [25, 52]. While these studies reported positive effects on growth and/or immunity and stress, other experiments obtained positive outcomes at lower doses such as in grass carp receiving 0.4 g kg−1 quercetin [44] or 0.8–1 g kg−1 rutin [26]. However, Zheng et al. [53] reported liver damage in tilapia receiving rutin supplementation at doses as low as 0.1 g kg−1, showing that excessive intake can be harmful. In gilthead seabream Sparus aurata, the best influence on immune parameters was found at the lowest dose (1 vs. 5 and 10 g kg−1) of dihydroquercetin [54]. Rufchaei et al. [17] obtained positive results on growth, immunity, and antioxidant capacity of pikeperch by including powdered water hyacinth at maximum doses of 15 g kg−1, assuming that the concentration of added polyphenols, notably rutin and quercetin [55], would have been much lower. In our study, we observed that a supplementation of the diet with rutin (2.2 g kg−1) modified the overall pikeperch physiological and immune status, even if no significant effect was observed for all parameter analyzed separately. It seems to act as a negative chronic effect. Further studies on pikeperch should test lower concentrations.
Many studies reporting on the benefit of diet supplementation with quercetin or rutin did so in the context of offsetting toxicity or negative side effects. Adding quercetin to feed was found to reduce organismal stress upon exposure to cadmium [51], avermectin [56], heat [23], and decreased salinity [20]. In Totoba macdonaldi, quercetin (administered together with epicatechin) improved a diet found to otherwise compromise fish health [27] and in blunt snout bream, it prevented the negative effects of feeding a diet with high lipid content [21]. Both quercetin and rutin protect from harmful effects of oxytetracycline [24, 57] and rutin was shown to have protective effects upon infection with Aeromonas hydrophila [52]. It is therefore possible that the diets tested in this study would be able to have a protective effect from pollution or bacterial pressure rather than improve performance at already low-stress levels under good rearing conditions.
4.2. RAS Microbial Community
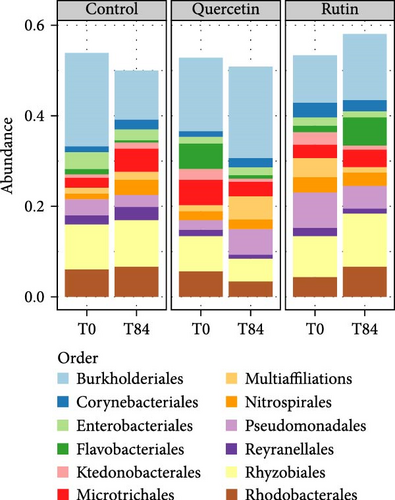
This is the first time that the effects of a dietary supplementation with polyphenols such as quercetin and rutin have been assessed at the scale of the rearing system, more specifically its microbial compartment. Given the central role played by this compartment in RAS for nutrient recycling, water quality, disease control or environmental impact of effluents [32, 58], and the antimicrobial properties of these molecules especially quercetin [11, 30], it is essential to integrate its possible effects into a more global diagnosis. No effect on microbial ASV number or evenness could be observed in any of the treatments, but we can observe a significant effect of quercetin on bacterial community structure and composition. Indeed, our study reveals a quercetin-induced shift in the bacterial community structure between T0 and T84. Microtichales and Flavobacteriales were negatively affected by quercetin supplementation, while Bulkholderiales were positively impacted. Similarly, the genus Massilia appeared to be positively affected by the quercetin treatment. Massilia is described as part of the fish gut microbiota. The Massilia genus may be linked to the function of the flavonoid degradation pathway. The Flavobacterium genus is negatively impacted by quercetin, but certain strains of this genus are known to produce it [59]. At another scale, we know that quercetin was found to change the composition of the intestinal microflora in rats [60] and fish [28]. Through their microbiota and faeces production, fish have been described to be main drivers of planktonic microbial communities. However, the addition of quercetin to the feed could be at the origin of selection processes in the gut microbiome, thereby modifying the structure of microbial communities in faeces and, as a result, in the surrounding water. This hypothesis is consistent with the fact that quercetin was not detected in the RAS water. Quercetin in water is relatively unstable and almost 100% depleted after 100 h at room temperature [61], we cannot exclude that quercetin metabolites could thus have played a role in the shift of RAS microbial communities.
5. Conclusion
Quercetin and rutin, two polyphenols with demonstrated positive effects as feed supplements in diverse fish species, failed to have positive effects when administered to European pikeperch reared in RAS at 2.2 g kg−1 of feed. Rutin proved to have negative effects on growth, FCR, and global physiological status. Quercetin showed similar trends but with no significant differences to the control treatment. In the absence of marked effect on physiological variables of the fish, the lower husbandry performance could be due to decreased palatability, suggesting that pikeperch may be more sensitive to the supplementation of its feed. Thus, care should be taken in feed formulation. The use of polyphenols, especially quercetin, as feed additives in closed-containment aquaculture alters microbial communities and could affect the performance of these farming systems.
Conflicts of Interest
The authors declare no conflicts of interest.
Funding
This work was supported by the research program Interreg GR VA Perciponie (073-4-08-191) funded by the European Union.
Acknowledgments
Thanks are due to the two platforms of the University of Lorraine where the experiments and analyses were done (Experimental Platform for Aquaculture, Metabolomic and Structural Analytic Platform). We thank Yannick Ledoré and Camille Fourrier for their technical support.
Supporting Information
Additional supporting information can be found online in the Supporting Information section.
Open Research
Data Availability Statement
The data that support the findings of this study are available from the corresponding author upon reasonable request.


