Effects of Body Weight, Temperature, and Daily Time Periods on Oxygen Consumption Rate of Juvenile Silver Pomfret (Pampus argenteus)
Abstract
Oxygen consumption rate (OCR), which reflects the metabolism requirement of fish, is regulated by body weight and temperature. However, the priority of body weight and temperature in determining the OCR of fish is not clear. The optimal temperature and feeding time for the commercially important silver pomfret (Pampus argenteus) in China were evaluated using two sizes of fish (15.8 ± 2.7 g, S; 35.3 ± 6.1 g, L) at four different water temperatures (21, 24, 27, 30°C) and four time periods (5:00–6:00, 11:00–12:00, 17:00–18:00, 23:00–24:00) in static respirometers. The results showed that the OCR of fish was significantly higher at 21 and 24°C than that at 27 and 30°C (p < 0.05). The Q10 increased from range of 21 and 24°C to range of 24–27°C but decreased from range of 24–27°C to range of 27–30°C. The body weight and water temperature significantly affected the OCR of fish (p < 0.05). The OCR of S was significantly higher than that of L (p < 0.05), while the OCR of fish increased linearly with increasing temperature. The OCR decreased with increasing fish body weight, and the coefficient (a – 1) in the linear regression equation of the logarithmic plot ranged from −0.568 to −0.191 (11.2–47.4 g, 21–30°C), with the mean value was −0.346. Overall, a two-factor regression equation for OCR of silver pomfret was established as OCR = 0.0558 × W –0.0081 × T + 0.0341 (N = 120, R2 = 0.5626, p < 0.05). The OCR was relatively higher at 5:00–6:00 compared to other time periods of the day. These results suggested that body weight exerted a more significant influence on the metabolic rate of silver pomfret compared to temperature. The optimal temperature for this fish species was between 27 and 30°C based on Q10, and the recommended feeding time was at 5:00–6:00 for maximizing growth for silver pomfret.
1. Introduction
The metabolic responses of organisms reflect the integrated effects of surrounding environmental conditions and species-specific homeostatic control mechanisms [1]. Anabolism and catabolism throughout the life cycle are determined by a highly organized scheme that modulates chemical influx within organisms and between organisms and the ambient environment [2]. As fish are poikilothermic animals, drastic change in environmental conditions will influence their metabolic requirements, growth, and food intake. Thus, the metabolic requirements of cultivated species are crucial to be explored for maximizing the production and feed utilization in aquaculture [3, 4]. Metabolic requirements are quantified in terms of oxygen consumption, which is dependent on a wide range of biotic and abiotic factors, including water temperature, body weight, pH, salinity, dissolved O2 and CO2 in the ambient water, hour of the day, nutrition, activity level, and sex of fish [5]. Among them, water temperature is a limiting factor for fish oxygen consumption by means of influencing the intensity of physiological and biochemical activities of fish [6]. A low temperature decreases the rate of physiological and biochemical activities of fish, resulting in low respiratory rate and growth. However, temperatures beyond the optimum limit increase the metabolic rate, and subsequent oxygen demand adversely affects fish health through a variety of pathophysiological disturbances in the host [7–9]. Determination of the optimal temperature through oxygen consumption rate (OCR) is beneficial for improving the culture system, survival, and growth in fish farming, and the preferred water temperature for fish growth changes with age and size, while juveniles prefer higher water temperatures than adults in some species [10, 11]. The integrated effect of temperature and body weight on fish growth has been reported in several species, but the priority of temperature and body weight in determining metabolic rate (growth) has not been verified [10, 12–14]. The mathematical relationship between temperature and oxygen consumption, or between body weight and oxygen consumption of fish, has been indicated in several studies. For example, temperature and oxygen consumption showed a linear regression function in Megalobrama pellegrini [15] and a polynomial regression function in juvenile Carassius auratus gibelio [16]. A power exponential regression function between body weight and oxygen consumption was found in blackhead seabream Sparus macrocephalus and brass gudgeon Coreius guichcnoti [15, 17]. Determining the mathematical relationship between oxygen consumption and temperature or between oxygen consumption and body weight is beneficial for identifying the activity status of fish and improving culture conditions and management [4].
Many fish species display an apparent circadian rhythm of oxygen consumption, which represents the daily cycle of feeding behavior and other activities in nature conditions [18]. Some studies confirmed that the daily oxygen consumption fluctuation could be divided into three types: (1) oxygen consumption at daytime is higher than that at nighttime, (2) oxygen consumption at daytime is lower than at nighttime, (3) oxygen consumption at daytime is similar with nighttime. Determining the circadian rhythm of oxygen consumption is beneficial for improving fish food utilization and maximizing fish growth [19].
Silver pomfret Pampus argenteus is a commercially important fish species in China. The nutrition requirement [20], morphology and physiology [21], and resource distribution [22] of silver pomfret have been reported in some studies. However, the production of this species continuously declined due to an increase in fishing intensity and the deterioration of natural habitats [23]. Recently, silver pomfret was obtained with a breakthrough in large-scale breeding technology [24]. However, industrialized cultivation poses challenges for silver pomfret due to high mortality rates resulting from intense stress and diseases associated with this species when reared in intensive farming systems [22, 25–28]. The knowledge of oxygen consumption changes in fish under different temperatures and time periods is beneficial for determining the optimal growth temperature, feeding frequency, and metabolic requirement. Thus, this study aimed to (1) evaluate the importance of body weight and temperature in regulating the growth of silver pomfret based on mathematical methods and (2) determine the optimal temperature ranges and circadian rhythm based on the OCR of silver pomfret. This study is meaningful to improve feed and feeding management of silver pomfret in an intensive factory farming system.
2. Materials and Methods
2.1. Fish and Husbandry Management
The experiment was conducted at the Zhejiang Institute of Marine Fisheries (Zhoushan, China, 29°90′N, 122°32′E). Juvenile silver pomfret (0.8 ± 0.1 g) (mean ± SD, N = 60) were purchased from a marine fish hatchery in Xiangshan (Ningbo, China) and transported to the experimental site by a living fish boat. The juveniles were acclimated in a 30 m3 (5 m × 3 m × 2 m) pool for 1 month. They were fed with a raw fish diet made of fresh Chinese mackerel Scomberomorus sinensis containing 67.9% moisture, 20.2% crude protein, 15.5% crude lipid, 3.3% ash, 1.4% phosphorus and 7.8 MJ kg−1 gross energy [29] to satiety for four times daily (5:00, 10:00, 14:00, and 18:00) during acclimation. Died fish, uneaten food residuals, and feces were removed, and ~90% and 50% water were exchanged with fresh and sand-filtered water prior to feeding times of 5:00 and 14:00, respectively. The temperature, dissolved oxygen (DO), salinity, pH, ammonia, and nitrite were monitored daily by following the methods described in Liu et al. [30]. As a result, temperature ranged from 19.2 to 21.1°C; DO ranged from 5.5 to 8.1 mg L−1, salinity ranged from 29.1 to 29.4 ppt, pH ranged from 7.4 to 8.1, ammonia (NH4-N) ranged from 0.014 to 0.030 mg L−1 and nitrite (NO2-N) ranged from 0.013 to 0.024 mg L−1 (N = 31).
2.2. Experimental Design, System, and Procedure
The OCR of silver pomfret was established as a factorial design (2 × 4), including two body weights (15 g, S and 35 g, L) and four water temperatures (21, 24, 27, and 30°C). The OCRs were measured at four time periods: 5:00–6:00 (4.1626–41.1190 W m−2), 11:00–12:00 (515.0013–516.3948 W m−2), 17:00–18:00 (37.0650–0.4706 W m−2) and 23:00–24:00 (0–0 W m−2) under natural lighting conditions with a light-to-dark ratio of 13–11 h within 1 day. S and L (judged by observation) each of 100 was selected from the pool and separately released into four tanks (diameter × height = 1.6 m × 0.8 m, 1.5 t) with a density of 25 fish/tank. Using heaters (CNC heater, 2 kW, Shanghai, China) to increase the water temperature of +0.3°C/day to experiment with temperatures in the tanks. The juveniles were acclimated to the experimental water temperature for 10 days [31].
Thirty-six cuboid plexiglas chambers (length × width × height = 0.50 m × 0.20 m × 0.20 cm; 20 L), each with a top cover and a side valve, were used as closed respirometers and released into four tanks (nine chambers/tank) filling with the oxygenated water (DO > 6 mg L−1) at experimental temperatures (21, 24, 27, and 30°C). All sides of the chamber were covered with opaque sheets to prevent disturbing the experimental fish. The OCR measurement of silver pomfret was designed with multiple individuals (five fish per chamber) forming a stable group, rather than a single fish, due to the intense stress behavior observed during acclimation [26]. Before the experiment, fish were deprived of diet for 24 h, then 12 groups of each five S and L were captured from the respective tank and immediately moved into 24 respirometers (five fish/respirometer) for 3 h acclimation. Two fish-size treatments and a no-fish respirometer (the blank for background correction) at each experimental temperature had three repetitions in each tank.
2.3. The Measurement of OCR
The water samples were collected from each respirometer after 1 h using a 250 ml wide-mouth bottle, then 1 mL manganese sulfate (MnSO4) and 2 ml alkaline potassium iodide (KI) were added to fix the DO in the bottle. The water samples were collected in triplicate for the initial and each chamber. The DO level was measured immediately following Winkler’s method described in Carvalho et al. [32]. Compared with current DO measurement methods (measuring devices), such as electrochemical sensors [33, 34] and optodes [35, 36], Winkler’s method, which has been unusual in DO level measurement since the early 21st century [37], was more cockamamie due to its elaborate procedure and susceptibility to contamination or human error. However, it was a cost-effective, reliable, and accurate method for measuring DO in the complex scenario of discontinuous measurement that has exceeded 40 years [32]. No intense activity and stressful responses of fish were observed during the experiment. The residual water in the respirometer was sucked out using a siphon, and fresh water in the tank entered into the respirometer simultaneously upon completion of each periodic experiment. Fish were dried using absorbent paper and individually weighed at the end of the experiment. The body weights of S and L were (15.8 ± 2.7) g and (35.3 ± 3.1) g, respectively. The volume of fish was determined by drainage method based on water overflowing volume.
2.4. Calculation and Statistical Analyses
Data were presented as mean ± SD and underwent Levene’s test for homogeneity of variance and Shapiro–Wilk test for normal distribution. The OCRs of different body weights and temperatures were dependent on the mean values of four time periods. Two-way analysis of variance (two-way ANOVA) was performed to examine the influence of body weight and water temperature, while one-way ANOVA was performed to examine the influence of different time periods on the OCRs of fish. Tukey’s HSD test was performed to examine the differences between the treatments and if the main effect was significant. Statistical analysis, regression analysis, and figures were performed using Origin software (Version 2019, Origin Lab Inc. Northampton, Massachusetts, USA). The significance level was set at p < 0.05.
3. Results
3.1. The Change of OCR at Different Temperatures and Q10
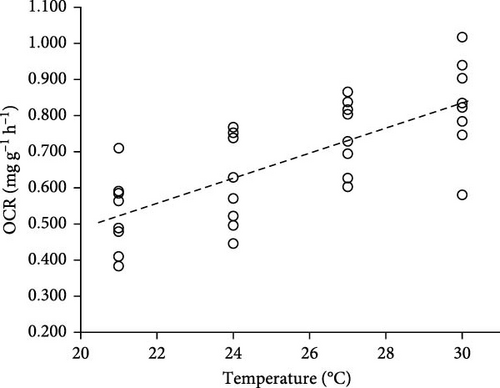
The OCR of fish increased with the increasing temperature (Table 1). The OCR of fish at 21 and 24°C were significantly higher than at 27 and 30°C (p < 0.05), while no significant difference in OCR was found either between fish at 21 and 24°C or between 27 and 30°C (p > 0.05). The regression relationship between OCR and temperature for fish was OCR = −0.2014 + 0.0345 × T (N = 32, R2 = 0.527, p < 0.05, Pearson’s r = 0.726, Figure 1). The Q10 value represents the sensitivity response of fish sensitivity to temperature fluctuations and its metabolic capacity to adjust following temperature changes. The Q10 value increased from range of 21–24°C (1.685) to range of 24–27°C (1.901) but decreased from range of 24–27°C (1.901) to range of 27–30°C (1.414). The optimal temperature range for silver pomfret was from 27 to 30°C in terms of Q10 value.
| Items | Temperature (°C) | p-Value | |||
|---|---|---|---|---|---|
| 21 | 24 | 27 | 30 | ||
| OCR mg (g h)−1 | 0.526 ± 0.107b | 0.616 ± 0.126b | 0.747 ± 0.099a | 0.828 ± 0.133a | <0.001 |
| Q10 | — | 1.685 (21–24°C) | 1.901 (24–27°C) | 1.414 (27–30°C) | — |
- Note: The different small letters (a and b) represented the significant difference in OCR of silver pomfret (Tukey’s HSD test, p < 0.05). Data were expressed as mean ± SD.
- Abbreviation: OCR, oxygen consumption rate.
3.2. The Effect of Temperature, Body Weight, and Their Interaction on OCR
The OCR was significantly affected by body weight and temperature (two-way ANOVA, p < 0.05, Table 2), while no significant interaction of body weight and water temperature was found on OCR (p > 0.05). The OCR of S was significantly higher than that of L, while OCR increased significantly with the increasing water temperature from 21 to 30°C (p < 0.05). The OCR of S at 30°C was significantly higher than that of S at 21 and 24°C, while the OCR of S at 27°C was significantly higher than that of S at 21°C (p < 0.05). The OCR of L at 27 and 30°C was significantly higher than that at 21 and 24°C (p < 0.05).
| Temperature (°C) | Initial DO level (mg L−1) | S fish | L fish | p-Value (body weight) | ||||
|---|---|---|---|---|---|---|---|---|
| Final DO level (mg L−1) | Body weight (g/fish) | OCR of S mg (g h)−1 | Final DO level (mg L−1) | Body weight (g/fish) |
OCR of L mg (g h)−1 |
|||
| 21 | 8.662 ± 0.118 | 6.612 ± 0.418 | 13.4 ± 1.6 | 0.612 ± 0.066cA | 4.759 ± 0.491 | 35.4 ± 1.3 | 0.441 ± 0.052bB | 0.006 |
| 24 | 8.391 ± 0.184 | 5.341 ± 1.162 | 16.9 ± 1.5 | 0.722 ± 0.064bA | 3.925 ± 0.995 | 35.1 ± 3.5 | 0.509 ± 0.052bB | 0.002 |
| 27 | 8.066 ± 0.078 | 4.435 ± 0.111 | 17.5 ± 0.5 | 0.830 ± 0.027aA | 2.049 ± 0.240 | 35.3 ± 5.1 | 0.663 ± 0.058aB | 0.002 |
| 30 | 7.747 ± 0.175 | 4.155 ± 0.443 | 15.6 ± 2.1 | 0.921 ± 0.081aA | 1.233 ± 0.126 | 35.4 ± 2.9 | 0.736 ± 0.110aB | 0.035 |
| p-Value (temperature) | — | — | — | <0.001 | — | — | <0.001 | — |
- Note: The different small letters (a, b, and c) represented the significant difference in OCR of silver pomfret at different temperatures (Tukey’ HSD test, p < 0.05). The different capital letters (A and B) represented the significant difference in OCR between large-size (L) and small-size (S) silver pomfret (Tukey’s HSD test, p < 0.05). Data were expressed as mean ± SD.
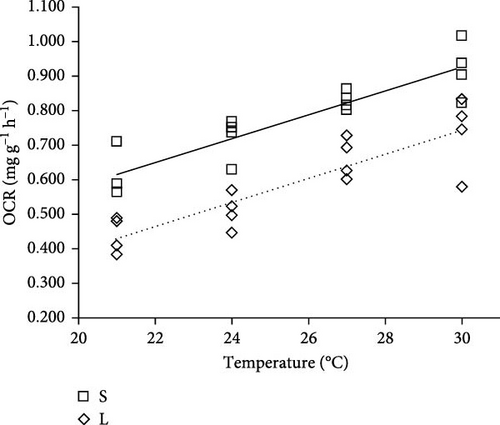
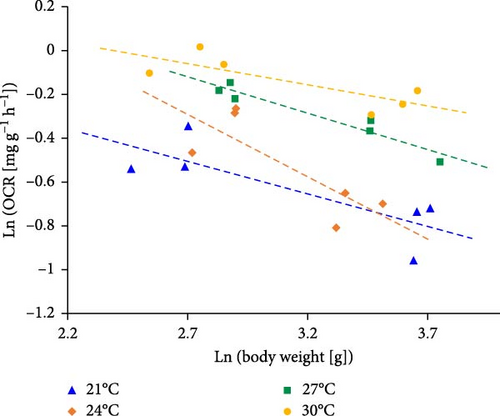
The regression between OCR and temperature of S and L were OCRS = 0.0344 × T–0.1069 (N = 12, R2 = 0.818, p < 0.05, Pearson’s r = 0.904) and OCRL = 0.0346 × T–0.2960 (N = 12, R2 = 0.809, p < 0.05, Pearson’s r = 0.899), respectively (Figure 2). Where OCRS and OCRL were the OCR of S and L (mg g−1 h−1), respectively. T was the temperature (°C). The slope of OCRS and OCRL was positive, and the similar slope values of OCRS (0.0344) and OCRL (0.0346) but different intercepts indicated that the temperature-regulated OCR of silver pomfret was apparently influenced by body weight. In addition, the fitting curve of OCR and body weight at 21, 24, 27, and 30°C were ln OCR21°C = −0.296 × ln W21°C + 0.294 (N = 6, R2 = 0.654, p < 0.05, Pearson’s r = −0.809, Figure 3), ln OCR24°C = −0.568 × ln W24°C + 1.243 (N = 6, R2 = 0.6457, p < 0.05, Pearson’s r = −0.803), ln OCR27°C = −0.330 × ln W27°C + 0.772 (N = 6, R2 = 0.9296, p < 0.05, Pearson’s r = −0.960), ln OCR30°C = −0.191 × ln W30°C + 0.457 (N = 6, R2 = 0.636, p < 0.05, Pearson’s r = −0.798), respectively. Where W21°C, W24°C, W27°C, and W30°C were the mean body weight (g) of fish at 21, 24, 27, and 30°C, respectively. The OCR was negative for increasing body weight, and the mean weight coefficient was −0.346. The body weight coefficient decreased from 21 to 24°C but increased from 24 to 30°C, indicating that the change of OCR was irregular with increasing temperature and body weight was involved in the OCR regulation of temperature. Thus, the change of OCR emphasized particularly on body weight.
3.3. The Change of OCR at Different Time Periods in 1 Day
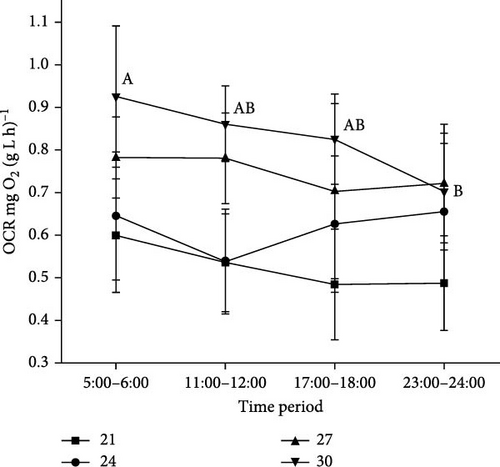
The changes in OCR within 1 day can indicate the circadian rhythm of fish activity, and the peak OCR can be considered the optimal feeding time for elevating feed utilization efficiency in aquaculture. The OCR of silver pomfret was not significantly affected by the time period when the temperature was below 30°C (p > 0.05, Figure 4). However, it was significantly affected by the time period when water temperature reached 30°C (p < 0.05). The OCR at 5:00–6:00 was significantly higher than that at 23:00–24:00 when the temperature reached 30°C (p < 0.05). Except when the temperature was 30°C, the OCR of silver pomfret was higher in 5:00–6:00 than that of other time periods, though the data were not statistically significant (p > 0.05). Thus, the recommended feeding time period was between 5:00 and 6:00 for silver pomfret.
4. Discussion
At present, a low survival rate was found in silver pomfret farming due to intensive stress response and virulence of bacteria and other pathogens [7]. Knowledge of metabolic change and OCR at different body weights, temperatures, and daily time periods is conducive to improve the survival and growth of this species in industrialized installation culture systems [4, 19, 40].
As fish are poikilothermal animals, their internal physiological and biochemical activities, including metabolic enzymes and tissue chemistry, are regulated by external temperature [6, 7, 41, 42]. The temperature coefficient (Q10) represents the sensitivity response of an organism’s sensitivity to temperature fluctuations and its metabolic capacity to adjust following temperature changes [1]. In the present study, the highest OCR of silver pomfret was observed at 30°C, which did not significantly differ from that at 27°C across different body weights. Actually, we also conducted an acclimation at 33°C, but the survival of sliver pomfret was low (<20%). The Q10 decreased from 24–27°C to 27–30°C (from 1.59–1.41 for S and from 2.41 to 1.42 for L). This result indicated that the optimal temperature range for the respiration rate of silver pomfret was between 27 and 30°C and aligned with previous investigations showing that silver pomfret prefers temperature range from 28 to 30°C in the wild [22]. Compared to other fish species, this temperature range was similar to that of manseer Tor tambroides (28–30°C) [6] but higher than that of marbled rockfish Sebastiscus marmoratus (15–20°C), largemouth bass Micropterus salmoides (26–29°C) and miiuy croaker Miichthys miiuy (15–20°C) [39, 43–45], and lower than that of yellowtail catfish Pangasius pangasius (34–38°C) and catfish Horabagrus brachysoma (31–33°C) [7, 46]. Many studies indicated that the OCR of fish increased with increasing temperature, showing a positive correlation and linear relationship between OCR and temperature [7, 39, 47–51]. This linear correlation was attributed to temperature’s direct effect on the kinetics of the enzyme reactions involved [7]. The linear regression coefficient between OCR and temperature of small and large fish was 0.0344 and 0.0346, and R2 was 0.818 and 0.809, respectively. The positive slope coefficient and high fitting degree verified the aforementioned result on silver pomfret, but some fish species showed a sigmoid curve in the fitting of temperature and OCR as well, such as marbled rockfish and manseer [6, 43]. The difference in the fitting may result from a lack of data from more experimental temperatures or different habits, acclimation capacity, and species specificity of fish [52].
Currently, several studies have reported changes in the metabolic scaling exponent during ontogeny with fish body weight, focusing on the “Surface Area (SA)” theory and the “Resource Transport Network (RTN)” theory [53]. The SA theory predicts that the metabolic scaling exponent will decrease and exhibit negative allometry in relation to body weight (b is close to 2/3), whereas the RTN theory suggests the opposite (b > 2/3) [54–56]. Generally, the OCR (per unit mass) of small-size fish was higher than that of large-size individuals because of the difference in energy allocation of organisms [57]. The result of this study showed that the OCR of small-size silver pomfret was markedly higher than that of large-size fish, which was consistent with many fish species [58–62]. von Bertalanffy [63] pointed out that weight-specific metabolic rate decreased with increasing body weight, and the slope of the logarithmic plot was negative. In the fish, the respiration system was proportional to the 2/3 (a) power of body weight in equation M/W = b × Wa−1 (M/W represents metabolic rate per unit weight; W is the body weight; a and b are constants) based on a surface rule [3, 63, 64]. In the present study, OCR was decreased with increasing fish body weight, and coefficient (a – 1) in the linear regressive equation of logarithmic plot ranged from −0.568 to −0.191 (11.2–47.4 g, 21–30°C) with the mean value −0.346. This result confirmed that silver pomfret was suitable for VB’s quantitative law in metabolism and growth [63]. Compared to other fish species, the mean coefficient (a – 1) was lower than that of −0.251 of Turbot Scophthalmus maximus (4–1000 g, 8°C) [65] and −0.245 of California halibut Paralichthys californicus (3.2 –165.6 g, 21.56°C) [57], but higher than that of −0.643 of Japanese flounder Paralichthys olivaceus (2.4–67.5 g, 20°C) [66].
Apparently, the temperature is a crucial factor in the external environment, which primarily regulates enzymatic and physiological requirements of energy [6]. Temperature beyond the optimal limits could lead to physiological malfunction of fish, influencing the metabolism and growth of fish [67, 68]. Body weight represented the individual specificity, which determined the allocation scheme of energy, and more energy was inclined to maintain fundamental life activities rather than grow along with an increase in body weight [3, 52]. Organisms prefer ensuring inner stability in a variable external environment (even in a chaotic external environment) by means of reducing their own entropy and simultaneously increasing the entropy of the external environment instead of development and growth [69]. Thus, we speculated that body weight played a more significant role than temperature in influencing the metabolic rate of fish due to (1) temperature did not alter the trend of OCR (the slopes of regression function of OCR and temperature of S and L were 0.0344 and 0.0346, respectively, Figure 2), while the magnitude of OCR was dependent on body weight (the intercepts of S and L were –0.1069 and –0.2960, respectively, Figure 2); (2) the pattern of OCR variation with different temperatures was inconsistent when body weight was roughly consistent (Figure 3). Additionally, our research indicated body weight took precedence over dietary protein level in determining the production performance of largemouth bass (unpublished data). The explanation involved the form of energy circulation resulted from the genetic background of fish, and these results need more studies to validate [70]. Liao [71] and Muller-Fuega et al. [72] developed models of OCR incorporating temperature and fish size as independent variables for rainbow trout Oncorhynchus mykissand and Pacific salmon Salmo salar; the formula was OCR = K × Tα × Wβ (K was a constant; α and β were slopes; T and W were temperature and fish size, respectively). Spanopoulos-Hernández et al. [1] formulated a multifactor regression equation between weight-specific oxygen consumption of juvenile Litopenaeus stylirostris, which incorporates salinity (S), temperature (T), and wet body weight (W). Their equation could be summarized as: lnOCR = − 3.6061 + 0.0161 × S + 0.0639 × T −32.2316 × W. In the present study, The multifactor regression equation described the relationship between OCR and body weight (W) as well as temperature (T) for silver pomfret could be expressed as: OCR = 0.0558 × W −0.0081 × T + 0.0341 (N = 120, R2 = 0.5626, p < 0.05). The OCR should be more dependent on body weight than the temperature on the basis of weight coefficients (32.2316 > 0.0639 and 0.0558 > 0.0081), and we considered that the genetic background of fish prevailed over environmental factors in regulating growth rate [62].
Generally, fish exhibit circadian rhythms in physiological activities, metabolism, and behavior [73]. Determining the appropriate feeding time based on the diurnal rhythm of OCR can enhance feed utilization and growth of fish, as the peak value of OCR suggested that fish are in appetite status [74, 75]. In the present study, the OCR of silver pomfret was higher in 5:00–6:00 than that of other time periods, although the data were not significant except temperature was at 30°C. This result indicated that 5:00–6:00 was a recommended time for juvenile silver pomfret.
In conclusion, for the industrialized recirculating culture of silver pomfret, it suggested that the optimal temperature range was between 27 and 30°C. Additionally, this study identified the optimal feeding time to be between 5:00 and 6:00. Moreover, this study highlighted that body weight exerted a more significant influence on the metabolic rate of silver pomfret compared to temperature. These findings underscore the importance of temperature and feeding timing in optimizing the growth and metabolic efficiency of silver pomfret in aquaculture settings.
Ethics Statement
The experiment was conducted under the approval of the research committee of Ninghai Institute of Mariculture Breeding and Seed Industry, Zhejiang Wanli University.
Disclosure
This paper is already published in the preprint given in the below link: https://papers.ssrn.com/sol3/papers.cfm?abstract_id=4870247.
Conflicts of Interest
The authors declare no conflicts of interest.
Author Contributions
Yu Liu conducted the experiments and drafted the manuscript. Minhai Liu collected the fish samples and analyzed the data. Jieyi Chen and Daning Jiang assisted with the experiments and sample collection. Jingjie Hu and Zhihua Lin conceived, designed, reviewed, and revised the manuscript. All authors have reviewed the final revision and approved the manuscript.
Funding
This research was supported by Research Startup Funds for Newly Recruited High-Level Talents (No. SC1032442780250).
Acknowledgments
The authors thank the Ninghai Institute of Mariculture Breeding and Seed Industry for all the support. This research was also supported by Research Startup Funds for Newly Recruited High-Level Talents (No. SC1032442780250).
Open Research
Data Availability Statement
The data that support the findings of this study are available from the corresponding author upon reasonable request.


