Enlarged Perivascular Space Burden Predicts the Risk of Relapse in Myelin Oligodendrocyte Glycoprotein Antibody-Associated Disease Patients
Abstract
Background and Objectives: Myelin oligodendrocyte glycoprotein antibody-associated disease (MOGAD) is an immune-mediated inflammatory demyelinating disease of the central nervous system, with a complex relapse mechanism involving various factors. The connection between enlarged perivascular spaces (EPVSs) and MOGAD is currently unclear. This study is aimed at exploring the risk factors associated with an increased number of EPVS in MOGAD patients and the association with relapse.
Methods: A retrospective study was conducted on 23 patients with MOGAD. We analyzed the correlation between the number of EPVS and age, disease duration, cerebrospinal fluid (CSF) leukocytes, CSF protein, EDSS scores, albumin quotient, and MOG-IgG titer. We employed linear regression to assess the independent risk factors for the number of EPVS, and Cox regression was used to elucidate the independent factors associated with relapse.
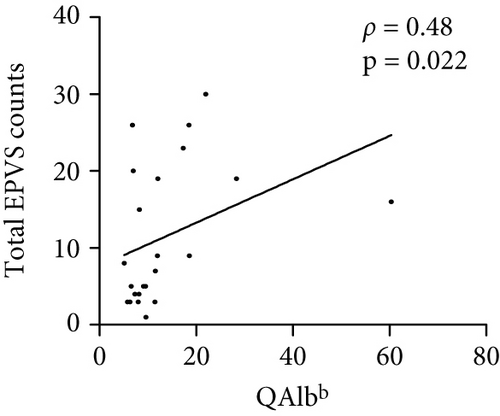
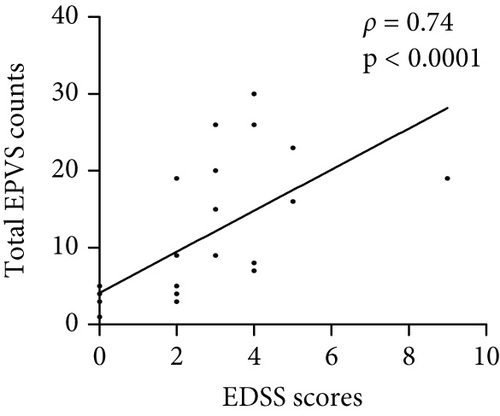
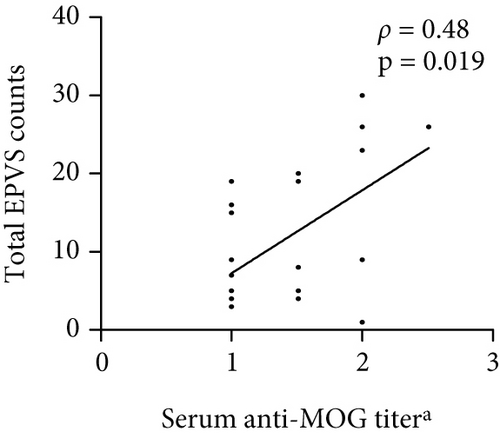
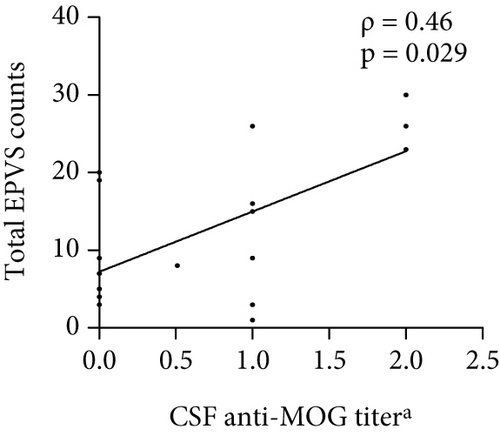
Results: The median total EPVS counts were 8 (IQR 4–9) at the initial brain MRI in patients with MOGAD. The number of total EPVS in patients with MOGAD was significantly positively correlated with CSF protein (ρ = 0.42, p = 0.044), EDSS (r = 0.74, p < 0.0001), QAlb (ρ = 0.48, p = 0.022), serum MOG-IgG titer (ρ = 0.48, p = 0.019), and CSF MOG-IgG titer (ρ = 0.46, p = 0.029). Univariate linear regression analysis indicated that CSF protein (β = 0.45, p = 0.03), EDSS scores (β = 0.6, p = 0.002), serum MOG-IgG titer (β = 0.51, p = 0.014), and CSF anti-MOG-IgG titer (β = 0.64, p = 0.001) were independent factors associated with EPVS counts. EDSS scores (β = 0.49, p = 0.002) and CSF MOG-IgG titer (β = 0.54, p = 0.001) were independent predictors associated with EPVS count in the multivariable linear regression model. Multivariable Cox regression analysis showed that the total number of EPVS was the only variable that revealed a significant effect on relapse (HR = 1.22, 95% CI 1.01–1.47, p = 0.04).
Conclusion: In our cohort, we preliminary explored independent risk factors for increased EPVS. Moreover, EPVS might independently predict the risk of relapse in patients with MOGAD.
1. Introduction
The glymphatic system, facilitated by aquaporin-4 (AQP4) on astrocyte end feet, is crucial for the rapid exchange of cerebrospinal fluid (CSF) and brain tissue, clearing metabolic waste and maintaining brain homeostasis [1]. Perivascular spaces (PVSs), part of this system, are essential for CSF transport and interstitial fluid exchange [2]. Dysfunction in PVS can lead to enlarged perivascular spaces (EPVSs), indicating impaired CNS waste clearance, which is linked to cognitive deficits and neuroinflammation [3]. In conditions like multiple sclerosis (MS) and neuromyelitis optica spectrum disorder (NMOSD), EPVS has been associated with blood-brain barrier dysfunction, active inflammatory, and severe neurological deficits [4–6].
Myelin oligodendrocyte glycoprotein antibody-associated disease (MOGAD) is an immune-mediated demyelinating disease with overlapping clinical features with MS and NMOSD but is distinguishable through biological and neuropathological evidence [7]. MOGAD has a relapse rate of 40%–50% in adults and 30% in children, emphasizing the need for prevention strategies beyond acute attack management [8]. Like other demyelinating diseases, MOGAD involves blood-brain barrier disruption, but the role of EPVS in MOGAD has not yet been investigated. This gap is critical given the distinct pathobiology of MOGAD: unlike NMOSD, where AQP4 antibodies directly target astrocytic end feet and disrupt glymphatic drainage, MOGAD is characterized by antibody-mediated demyelination without proven astrocytopathy. We hypothesize that EPVS enlargement in MOGAD may arise indirectly from parenchymal inflammation-driven edema or impaired CSF dynamics, rather than primary glymphatic dysfunction. Testing this hypothesis could uncover novel mechanisms of neurovascular unit injury in antibody-mediated CNS disorders.
EPVS can be easily visualized on magnetic resonance imaging (MRI), and EPVS could partially reflect the function of glymphatic system. This study is aimed at exploring the role of EPVS in MOGAD, hypothesizing that it may influence disease prognosis and relapse by affecting glymphatic function. In this study, we investigated EPVS characteristics in MOGAD patients, explored factors associated with EPVS burden, and analyzed the relationship between EPVS burden and disease relapse.
2. Methods
2.1. Study Population
This is a single-center, retrospective, observational study. We conducted a retrospective analysis of patients who were first diagnosed with MOGAD at our center from January 2021 to May 2023. Inclusion criteria are as follows: (1) Patients had their first core clinical demyelinating event involving ≥ 1 of the following: (1) optic neuritis (ON), (2) myelitis, (3) brain and brainstem involvement, and (4) other inflammatory demyelinating lesions in MOGAD; (2) positive MOG-IgG test (based on cell-based testing); and (3) exclusion of other diseases. The following patients were excluded: (1) age > 60 years, (2) brain MRI could not be collected, (3) patients with missing follow-up information, (4) patients with comorbidities such as hypertension and diabetes, and (5) patients with other diseases such as stroke, brain trauma, brain tumors, and other inflammations. As a control group, we also recruited age- and sex-matched healthy subjects without a history of any diseases. These subjects had completed brain MRI for physical examination during the age-matched period. Informed consent was obtained from each included patient or a legal representative.
2.2. Clinical Data Collection
Demographic and baseline clinical data were retrospectively recorded and reviewed. The baseline data collected including age at onset, sex, disease duration, expanded disability status scale (EDSS) score, clinical syndrome, laboratory tests (CSF cell counts, protein levels, as well as MOG-IgG titer in serum and CSF), and EPVS data from brain MRI. Collect information on whether patients experienced relapses and the interval time between relapses and the initial onset. A relapse in MOGAD is defined as a new clinical event occurring more than 30 days after a previous episode, characterized by new or worsening symptoms, accompanied by changes in neurological examination, and associated with new or enhanced MRI lesions [9].
2.3. MRI Protocol and EPVS Analysis
MRI images were acquired from all included patients as routine image assessments. All patients underwent a standardized brain MRI protocol on a 3T scanner, including T1-weighted, T2-weighted, and fluid-attenuated inversion recovery (FLAIR) sequences. All studies were performed on 3.0T scanners. Images were 2D sequences. Sequences typically included 20–30 slices of 5-mm thickness. The imaging parameters were as follows: T1 (repetition time [TR] 2250 ms, echo time [TE] 24 ms, field of view [FOV] 240 × 240, matrix 320 × 224, and pixel 0.8 × 1.1), T2 (TR 4200 ms, TE 104 ms, FOV 240 × 240, matrix 320 × 256, and pixel 0.6 × 0.6), FLAIR (TR 7000 ms, TE 140 ms, FOV 240 × 240, matrix 320 × 224, and pixel 0.8 × 1.1). The total sequences of T1, T2, and FLAIR were used to differentiate and quantify EPVS.
EPVS was defined as round or linear CSF isointense space enveloping blood vessels and along the course of the vessels. The boundary is clear, without mass effect and enhancement, and there is no hyperintense around it [10, 11]. EPVSs were counted on axial T2-hyperintense and T1/FLAIR hypointense by two trained neurologists, respectively, EPVS counts in the centrum semiovale, basal ganglia, and midbrain. The numbers refer to EPVS in the brain slice showing the greatest extent of EPVS. Total EPVS counts were calculated as the amount of EPVS in the three regions. To address potential bias, both raters were fully blinded to participant status and all clinical data during EPVS quantification, and they received standardized training [12, 13]. Discrepancies in total EPVS counts exceeding 15% were resolved through a consensus review with a senior neuroradiologist.
As the first exploratory study investigating EPVS in MOGAD and due to the limited sample size, we converted the ordinal visual rating scale (0–4 levels) into a binary variable. This was achieved by dichotomizing at the midpoint (15) of the Intermediate Level 2 (corresponding to 10–20 EPVS), resulting in two groups: total EPVS < 15 and total EPVS ≥ 15.
3. Statistical Analysis
Baseline characteristics of patients were collected. CSF and serum anti-MOG titer data were converted logarithmically. Continuous variables are reported as mean ± standard deviation if normally distributed, or median (interquartile range) if nonnormally distributed. Categorical variables were summarized as percentage. Baseline characteristics of patients were compared between total EPVS < 15 group and total EPVS ≥ 15 group by using Student’s t-test (age) or the Mann–Whitney U test (disease duration, EDSS, CSF leukocytes, CSF protein, MOG-IgG titer, albumin quotient (QAlb): quotient (CSF albumin/serum albumin)∗10−3, and total EPVS) for continuous variables, as well as the Fisher’s exact tests for categorical variables (sex). The difference in recurrence frequency regarding total EPVS status was also observed by Fisher’s exact test. Nonparametric Spearman’s rank correlation (ρ) was used to assess monotonic relationships between EPVS burden and clinical baseline variables. Linear regression analysis was used to detect the independent factors associated with EPVS. Cox regression models were used to estimate the association between EPVS and relapse. A two-tailed probability value < 0.05 was considered significant.
4. Results
4.1. Clinical Data of Patients With MOGAD
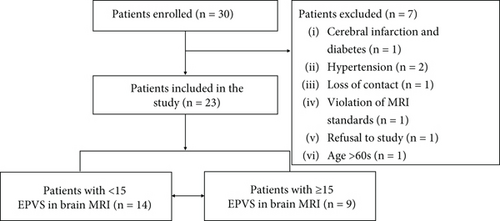
Between January 1, 2021, and May 31, 2023, 30 patients were enrolled within the timeframe available. Seven patients were excluded, and 23 patients were included in the study (Figure 1). Follow-up ended on August 31, 2024. We also recruited age- and sex-matched healthy subjects as a control group. The demographic characteristics of the control group and patients with MOGAD are presented. There was a significant difference in total EPVS counts between the two groups (Table 1).
| Healthy group | MOGAD group | p value | |
|---|---|---|---|
| No. | 23 | 23 | NA |
| Age (years) | 33.74 ± 15.04 | 34.04 ± 15.12 | 0.968 |
| Sex (female/male) | 11/12 | 11/12 | NA |
| Total EPVS counts | 4 (2–7) | 8 (4–19) | 0.005 |
- Note: NA indicates not applicable. Categorical variables are shown in absolute numbers. Continuous variables are shown as mean (± SD) or median (interquartile). p values are based on Student’s t-test for normally distributed continuous variables (age) and Mann–Whitney U test for nonnormally distributed continuous variables (EPVS).
- Abbreviation: EPVSs, enlarged perivascular spaces.
Baseline characteristics at the initial hospitalization of the full study patients are shown (Table 2). The mean age at MOGAD onset was 34.04 years (SD = 15.12); 11 (47.83%) patients were females. Median disease duration at the initial visit was 7 days (IQR 3–14). The median EDSS scores were 2 (IQR 2–4). Median CSF leukocytes were 10 (cells/mm3) (IQR 1–90), and protein was 355 mg/L (IQR 292–562). MOG-IgG titer was tested in both serum and CSF for all patients. Serum positivity was observed in 100% of cases (23/23), while CSF positivity was detected in 9/23 patients (39.1%). The median CSF and serum MOG-IgG titer (lg10-dilution factor) were 0 (0–1) and 1 (1–2). The median QAlb was 9.34 (7–18). The median total EPVS counts were 8 (4–19) at the initial brain MRI.
| Characteristic | All patients | Total EPVS (< 15) | Total EPVS (≥ 15) | p value |
|---|---|---|---|---|
| N = 23 | N = 14 | N = 9 | ||
| Age | 34.04 ± 15.12 | 31.64 ± 15.76 | 37.78 ± 14.1 | 0.354 |
| Sex (female, %) | 11 (47.83%) | 8 (57.14%) | 3 (33.33%) | 0.265 |
| Disease duration (days) | 7 (3–14) | 6 (2.8–14.0) | 7 (2.5–37.5) | 0.612 |
| EDSS | 2 (2–4) | 2 (0–2.5) | 4 (3–5) | 0.002 |
| CSF analysis | ||||
| Leukocytes (cells/mm3) | 1 (10–90) | 3 (0.8–40.5) | 36 (6–102.5) | 0.072 |
| Protein (mg/L) | 355 (292–562) | 354 (290–379) | 733 (298–1020) | 0.089 |
| CSF MOG-IgG titera | 0 (0–1) | 0 (0–0.1) | 1 (0–2) | 0.013 |
| Serum MOG-IgG titera | 1 (1–2) | 1 (1–1.5) | 1.51 (1–2) | 0.092 |
| QAlbb | 9.34 (7–18) | 8.65 (6.5–11.5) | 17.34 (7.7–25.2) | 0.038 |
| Total EPVS | 8 (4–19) | 4.5 (3–7.25) | 20 (17.5–26) | 0.001 |
| Clinical syndrome at onset | ||||
| ON | 7 | 5 | 2 | |
| Myelitis | 4 | 2 | 2 | |
| ADEM | 2 | 0 | 2 | |
| Brainstem involvement | 7 | 4 | 3 | |
| Meningoencephalitis | 10 | 5 | 5 |
- Note: Categorical variables are shown in absolute numbers and percent sign (%). Continuous variables are shown as mean (± SD) or median (interquartile). For continuous variables, Student’s t-test was used if data met normality; otherwise, the Mann–Whitney U test was applied. Fisher’s exact test was applied for categorical variables.
- Abbreviations: ADEM, acute disseminated encephalomyelitis; CSF, cerebrospinal fluid; EDSS, expanded disability status scale; EPVSs, enlarged perivascular spaces; ON, optic neuritis.
- aRaw MOG-IgG titer was converted to a linear scale using base-10 logarithms: log10 − titer = log10 (dilution factor).
- bQAlb, quotient (CSF albumin/serum albumin)∗10−3.
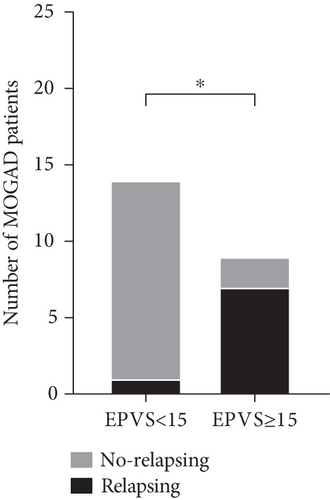
Patients were divided into two groups by total EPVS counts in brain MRI: 14 patients were in the group of total EPVS < 15, and 9 were in the other group of total EPVS ≥ 15. As shown in Table 2, baseline characteristics including age at onset, sex, disease duration, CSF leukocytes, CSF protein, and serum MOG-IgG titer were not significantly different between the two groups (p > 0.05). On the contrary, EDSS scores (p = 0.002), CSF MOG-IgG titer (p = 0.013), and QAlb (p = 0.038) were significantly different. Among all the patients, 7 patients had ON, 4 myelitis, 2 suffered from ADEM, 7 brainstem demyelination, and 10 meningoencephalitis. Due to the small sample size, differences in clinical features between the two groups were not compared. The total follow-up duration ranged from 4 to 41 months. In the EPVS ≥ 15 subgroup (n = 9), follow-up spanned 4–39 months, with 7/9 patients (77.8%) experiencing relapses. In contrast, the EPVS < 15 subgroup (n = 14) had a follow-up range of 6–41 weeks, with only 1/14 patients (7.1%) experiencing relapse.
4.2. The Difference in Relapse Frequency Regarding Total EPVS Status
A total of eight patients relapsed, including seven in the total EPVS (≥ 15) group and one in the total EPVS (< 15) group. The difference in relapse frequency regarding total EPVS status was also discerned. Patients in the total EPVS ≥ 15 group showed a significantly higher frequency of relapse than the total EPVS < 15 group (p = 0.001) (Figure 2).
4.3. Correlation Analysis Between the Total Number of EPVS and Other Indicators
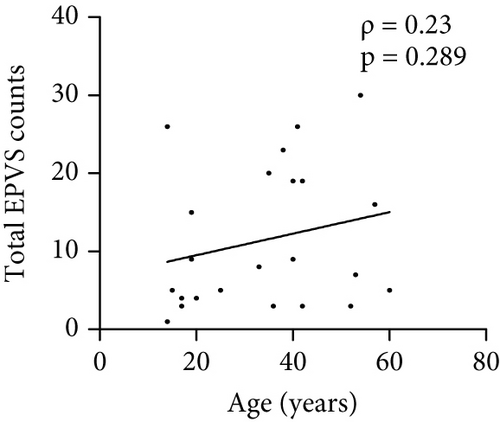
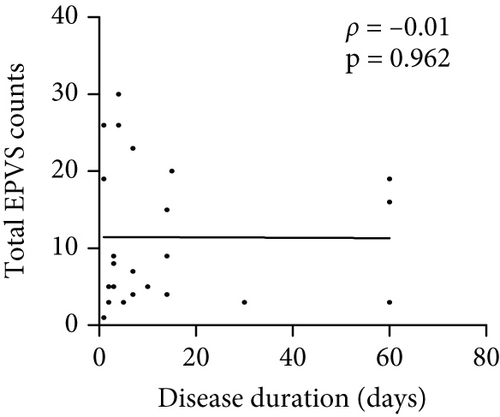
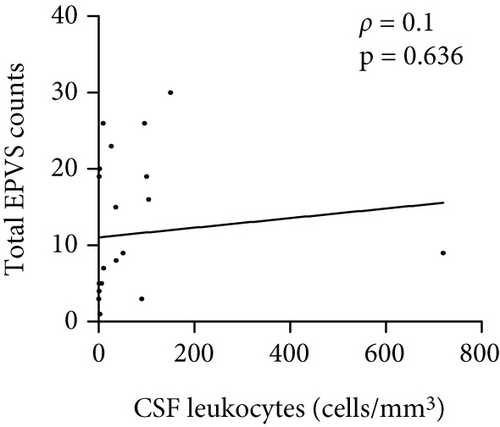
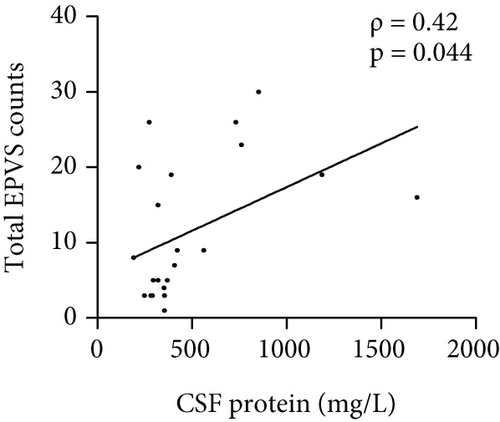
The number of total EPVS of the patients with MOGAD was significantly positively correlated with CSF protein (ρ = 0.42, p = 0.044), EDSS (ρ = 0.74, p < 0.0001), QAlb (ρ = 0.48, p = 0.022), serum MOG-IgG titer (ρ = 0.48, p = 0.019), and CSF MOG-IgG titer (ρ = 0.46, p = 0.029), but not with age (ρ = 0.23, p = 0.289), disease duration (ρ = −0.01, p = 0.96), and CSF leukocytes (ρ = 0.1, p = 0.636) (Figure 3).
4.4. Linear Regression Analysis of Independent Factors Associated With EPVS Counts in MOGAD Patients
Based on the results of differential and correlation analyses, to preliminarily explore potential risk factors associated with EPVS formation, univariate linear regression analyses were conducted, with EPVS as the dependent variable and the following independent variables: CSF protein levels, CSF and serum MOG-IgG titer, EDSS scores, and QAlb. The univariate linear regression analyses revealed that higher CSF protein levels (β = 0.45, p = 0.03), increased EDSS scores (β = 0.6, p = 0.002), elevated serum anti-MOG-IgG titers CSF (β = 0.51, p = 0.014), and CSF MOG-IgG titer (β = 0.64, p = 0.001) were significantly associated with EPVS counts, suggesting that these factors may independently contribute to EPVS formation in this exploratory cohort.
In the multivariate analysis phase, variables demonstrating a univariate association with EPVS counts at p < 0.1 were initially considered for inclusion. However, CSF protein levels (VIF = 18.18) and QAlb (VIF = 17.66) were excluded due to severe multicollinearity. Given the limited sample size (n = 23) and the biological rationale that CSF MOG-IgG titer may more directly reflect intrathecal antibody dynamics compared to serum titers, the final multivariate linear regression model retained only EDSS scores and CSF MOG-IgG titer. The results indicated that EDSS scores (β = 0.49, p = 0.002) and CSF MOG-IgG titer (β = 0.54, p = 0.001) are independent factors associated with the number of EPVS (Table 3).
| Univariate analyses | Multivariate analysis | |||
|---|---|---|---|---|
| 95% CI | p value | 95% CI | p value | |
| CSF protein (mg/L) | 0.001 to 0.02 | 0.03 | ||
| EDSS scores | 1.05 to 4.29 | 0.002 | 0.91–3.46 | 0.002 |
| Serum MOG-IgG titera | 1.77 to 13.68 | 0.014 | ||
| CSF MOG-IgG titera | 3.58 to 12.73 | 0.001 | 3.13–10.3 | 0.001 |
| QAlbb | −0.04 to 0.61 | 0.084 | ||
- Abbreviations: CSF, cerebrospinal fluid; EDSS, expanded disability status scale.
- aRaw MOG-IgG titer was converted to a linear scale using base-10 logarithms: log10 − titer = log10 (dilution factor).
- bQAlb, quotient (CSF albumin/serum albumin)∗10−3.
4.5. Cox Regression Analysis of Independent Predictors of Relapse in MOGAD Patients
In the univariate Cox model, four biomarkers independently predicted relapse risk. The hazard of relapse increased by 0.1% per 1 mg/L increment in CSF protein (HR = 1.001, 95% CI 1–1.002, p = 0.047), 54% per 1-point increase in EDSS score (HR = 1.54, 95% CI 1.11–2.13, p = 0.01), and 23% per additional total EPVS lesion count (HR = 1.23, 95% CI 1.08–1.41, p = 0.01). Notably, the clinical relevance of CSF protein’s marginal association warrants cautious interpretation despite statistical significance. Serum anti-MOG-IgG titer demonstrated a 379% increased hazard of relapse per unit increment (HR = 4.79, 95% CI 1.25–18.46, p < 0.05). Other variables, such as age, sex, disease duration, leukocytes, CSF MOG-IgG titer, and QAlb, did not affect the risk of relapse in the univariate model (Table 4).
| Variates | B | SE | p | HR | 95% CI |
|---|---|---|---|---|---|
| Age (years) | 0.03 | 0.02 | 0.155 | 1.04 | 0.99–1.09 |
| Sex | 0.9 | 0.82 | 0.242 | 0.46 | 0.5–12.24 |
| Disease duration (days) | 0.01 | 0.02 | 0.571 | 1.01 | 0.99–1.04 |
| CSF leukocytes (cells/mm3) | 0 | 0.002 | 0.966 | 1 | 1–1.004 |
| CSF protein (mg/L) | 0.001 | 0.001 | 0.047 | 1.001 | 1–1.002 |
| EDSS scores | 0.43 | 0.17 | 0.01 | 1.54 | 1.11–2.13 |
| Serum MOG-IgG titera | 1.57 | 0.69 | 0.024 | 4.8 | 1.25–18.46 |
| CSF MOG-IgG titera | 0.97 | 0.49 | 0.051 | 2.64 | 1.02–6.86 |
| QAlbb | 0.03 | 0.02 | 0.13 | 1.03 | 0.99–1.06 |
| Total EPVS counts | 0.21 | 0.07 | 0.003 | 1.232 | 1.08–1.41 |
- Abbreviations: CSF, cerebrospinal fluid; EDSS, expanded disability status scale; HR, hazard ratio.
- aRaw anti-MOG-IgG titer was converted to a linear scale using base-10 logarithms: log10 − titer = log10 (dilution factor).
- bQAlb, quotient (CSF albumin/serum albumin)∗10−3.
Consulting literature on relapse predictors in MOGAD [14, 15], with univariate Cox analysis, we made the multivariate Cox regression model including EDSS scores and serum MOG-IgG titer. Only the total EPVS counts (HR = 1.22, 95% CI 1.01–1.47, p = 0.04) affect relapse (Table 5). A higher total EPVS count was an independent risk factor associated with a significantly increased risk of relapse.
| Variates | B | SE | p | HR | 95% CI |
|---|---|---|---|---|---|
| EDSS scores | 0.31 | 0.31 | 0.321 | 1.36 | 0.74–2.49 |
| Serum MOG-IgG titer | 0.19 | 0.1 | 0.847 | 1.21 | 0.17–8.55 |
| Total EPVS counts | 0.2 | 0.1 | 0.04 | 1.22 | 1.01–1.47 |
- Abbreviations: CSF, cerebrospinal fluid; EDSS, expanded disability status scale; HR, hazard ratio.
- aRaw anti-MOG-IgG titer was converted to a linear scale using base-10 logarithms: log10 − titer = log10 (dilution factor).
- bQAlb, quotient (CSF albumin/serum albumin) ∗ 10−3.
5. Discussion
In the retrospective study, we investigated the function of the glymphatic system in patients with MOGAD in the acute phase of the first attack, using a noninvasive MRI metric-EPVS. Our results showed that EPVS counts significantly increased in patients with MOGAD compared with the healthy control group, speculating indirectly impaired glymphatic system function in MOGAD. Additionally, we concluded that CSF protein, EDSS score, serum, and CSF MOG-IgG titer were independent risk factors for more total EPVS in the univariate linear regression analyses; also, the multivariate analysis indicated that EDSS scores and CSF MOG-IgG titer were independent factors associated with the number of EPVS. This result evaluated the individual relationships between each predictor and EPVS burden, providing initial insights into their roles in EPVS pathophysiology for hypothesis generation in this exploratory study. Moreover, EPVS counts were an independent predictor of relapse in MOGAD patients. To our knowledge, this is the first study to examine EPVS in MOGAD.
PVSs are key channels for the translocation of brain fluids and aiding in the clearance of metabolic waste [16]. They may also be related to immune regulation and inflammatory processes in the brain [17]. These functions highlight the importance of PVS in maintaining brain health. Impaired glymphatic system, as indicated by EPVS, has also been reported in other neuroinflammatory diseases including MS and NMOSD [18–20].
Patients with MOGAD exhibit a higher prevalence of EPVS compared to the normal group, which has led us to preliminarily determine that MOGAD patients may impair glymphatic function. However, the mechanism of formation of EPVS in MOGAD patients is currently unclear. Eight correlations with EPVS were tested, and several were significant including CSF protein, EDSS, QAlb, serum, and CSF MOG-IgG titer. The final multivariate linear regression analysis indicated that EDSS scores and CSF MOG-IgG titer are independent factors associated with the number of EPVS, all of which reflect the severity of the disease and inflammatory status. Therefore, we speculate that patients with severe conditions and high neuroinflammatory are more likely to develop EPVS. However, as an exploratory study involving multiple unadjusted comparisons for EPVS correlations, our findings should be interpreted with caution. The nominally significant associations may carry an elevated risk of Type I errors. Future replication in larger cohorts is needed to validate these preliminary observations.
Studies have shown that age, hypertension, diabetes, and cerebrovascular diseases can promote the formation of EPVS [21, 22]. Therefore, to better elucidate the mechanism of increased EPVS in patients with MOGAD, we controlled the inclusion criteria to exclude these factors. In our study, we found no correlation between age and the formation of EPVS in MOGAD patients, speculating that the primary influencing factors, such as inflammation, may override the impact of age on EPVS formation. Furthermore, the relatively young average age of our cohort (34 years) limits the generalizability of age-related effects on EPVS.
Neuroinflammation disrupts the polarization of AQP4 from the astrocytic end feet to the soma, leading to reduced glymphatic flow [23–25]. Chronic neuroinflammation can sustain this decrease, while infiltrating immune cells in PVSs may obstruct fluid movement and CSF influx. This disruption, combined with the accumulation of cytokines and metabolic wastes, creates a detrimental cycle that exacerbates neuroinflammation [17]. NMOSD involves AQP4 antibodies that directly affect astrocytes and the glymphatic system, whereas MOGAD’s mechanism for EPVS enlargement is likely indirect via general neuroinflammation which can disrupt AQP4 polarization and glymphatic flow rather than a direct attack on AQP4. We speculate that such accumulated inflammation response may lead to relapses. By Cox regression analysis, we found that EPVS is an independent risk factor for relapses. During the acute attack phase, neuroinflammation may damage the glymphatic system, as evidenced by increased EPVS, leading to ineffective elimination of metabolic waste. The resulting ongoing inflammatory state could, in turn, contribute to relapse in MOGAD patients. A study investigated glymphatic function in MOGAD using the diffusion MRI-based “ALPS index” and found that glymphatic flow is indeed impaired in MOGAD patients even in remission, correlating with higher EDSS disability. This independent evidence strongly supports the concept that glymphatic dysfunction is part of MOGAD pathology, and it aligns with the present study’s finding that EPVS correlates with disability and inflammation [26].
Currently, there is a lack of precise predictors for relapse risk or long-term outcomes in MOGAD. Several factors may be related to the relapse: severity of the initial attack, persistent seropositivity for MOG-IgG, and age [8, 9, 14, 15]. Our findings suggest that EPVS may transcend these traditional markers. The dissociation between EPVS and established relapse predictors underscores its potential as a novel prognostic tool: glymphatic impairment may create a permissive environment for relapse neuroinflammation, independent of clinical manifestations or serological status. The baseline MRI EPVS count may be used for risk stratification of MOGAD patients. A patient with exceptionally numerous EPVS on initial MRI might warrant closer monitoring for relapse or even consideration of early prophylactic treatment. If confirmed in larger studies, EPVS burden could become one factor in guiding treatment decisions.
A variety of methods to evaluate EPVS were used in the past studies [27–30]. Manual counting of EPVS especially across multiple brain regions can be time-consuming and somewhat subjective given the current lack of standardization in how to do it. In the future, automated image analysis tools are being developed to quantify EPVS. Such developments could facilitate the clinical adoption of EPVS as a biomarker. Another translational question is whether EPVS burden can change over time and potentially serve as a monitoring tool. The current study looks at EPVS at first attack only, but we speculate the following: does effective treatment of inflammation reduce EPVS progression, or are EPVSs largely static once formed? Although data is not available to answer this here, raising the question could stimulate further research. To establish EPVS as a validated imaging biomarker, prospective studies with standardized measurement protocols are needed to minimize bias and confirm these findings.
There are some limitations to the current study. First, this study has limitations inherent to its retrospective design and small sample size (n = 23). Second, we did not fully consider other factors that could influence the formation of EPVS. In addition, a key limitation of this study is the absence of longitudinal MRI data to assess EPVS changes over time. While baseline EPVS burden was associated with relapse risk, we cannot determine whether EPVS progression parallels disease activity or accumulates independently of relapses. Future prospective studies with serial MRI acquisitions are essential to delineate the temporal relationship between EPVS dynamics and clinical outcomes. Radiologists and neurologists should be aware that extensive EPVS on a patient’s MRI might not just be an incidental finding; it could have prognostic significance in inflammatory demyelinating diseases like MOGAD.
6. Conclusion
We used EPVS to assess the function of the glymphatic system and found indirectly a relationship between EPVS and neuroinflammation and BBB function in MOGAD. Meanwhile, we demonstrated that patients exhibit a higher EPVS burden indicating impaired glymphatic function, and increasing EPVS is associated with patient relapse. This supports the potential role of EPVS in MOGAD etiopathogenesis and as a prognostic marker. Future research needs to explore the mechanism of EPVS in MOGAD, as well as how to utilize EPVS as a potential biomarker for predicting MOGAD relapses.
Nomenclature
-
- MOGAD
-
- myelin oligodendrocyte glycoprotein antibody-associated disease
-
- EPVSs
-
- enlarged perivascular spaces
-
- PVS
-
- paravascular spaces
-
- CSF
-
- cerebrospinal fluid
-
- EDSS
-
- expanded disability status scale
-
- AQP4
-
- aquaporin-4
-
- NMOSD
-
- neuromyelitis optica spectrum disorder
-
- MRI
-
- magnetic resonance imaging
-
- IQR
-
- interquartile range
-
- ON
-
- optic neuritis
-
- ADEM
-
- acute disseminated encephalomyelitis
Ethics Statement
The study was performed according to the Declaration of Helsinki. All patients gave written informed consent to participate in the study.
Conflicts of Interest
The authors declare no conflicts of interest.
Author Contributions
Y.C. and Zu.X. take full responsibility for the integrity of the data and the accuracy of the data analysis. Study concept and design: X.Z., C.P., and Zh.X. Acquisition, analysis, or interpretation of data: all authors. Drafting of the manuscript: Y.C. and Zu.X. Critical revision of the manuscript for important intellectual content: all authors. Statistical analysis: Y.C., Zu.X., X.Z., and C.P. Study supervision: Zu.X. and Zh.X. All authors reviewed the manuscript.
Funding
The research was supported by the National Natural Science Foundation of China (10.13039/501100001809) (No. 82360268 and No. 8247054128) and Zunyi City Science and Technology and Big Data Bureau (ZunShi KeHe [2023] No. 209).
Acknowledgments
We would like to thank the study participants and all others who helped directly or indirectly to accomplish this study.
Open Research
Data Availability Statement
Data sharing is not applicable to this article as no new data were created or analyzed in this study.


