Potential Economic Impact of Grapevine Phylloxera (Hemiptera: Phylloxeridae) on Western Australian Winegrapes
Abstract
Grapevine phylloxera Daktulosphaira vitifoliae Fitch (Hemiptera: Phylloxeridae) has been present in Australia for almost 150 years but has not spread to south-west Western Australia, in part due to the relative isolation of the region. Recent improvements in tourist access, with interstate flights now arriving at Busselton Margaret River Airport, raise concerns about potential phylloxera introductions via wine tourism. In this paper, we simulate the potential economic impact on the Western Australian winegrape industry following a hypothetical arrival event in the Margaret River wine region. We use soil texture maps to assess the suitability of winegrape-growing areas to phylloxera establishment and construct a model to predict the likely cost and revenue implications of replanting vines to resistant rootstock as they become infested. Our results suggest that if strict quarantine measures to limit spread are not implemented, a phylloxera incursion could affect 60%–70% of vines and cause cumulative losses of AUD150–290 million over a 50-year period. This is equivalent to a 3%–6% annual contraction of winegrape production.
1. Introduction
Grapevine phylloxera Daktulosphaira vitifoliae Fitch (Hemiptera: Phylloxeridae) is a sap-sucking aphid that has caused severe yield losses in grapevines (Vitis sp.) throughout the world [1]. It causes pouch-like leaf galls and superficial root galls on its natural hosts, American Vitis species, and damaging root galls on European winegrapes (Vitis vinifera L.), such as those widely cultivated for wine production in Australia [2, 3]. Phylloxera has been present in Australia for almost 150 years but has yet to be detected in Western Australia (WA) despite most grapevines being own-rooted V. vinifera planted in susceptible soils [4]. The risk of phylloxera being introduced to south-west WA may have changed with the recent introduction of commercial airline flights to Busselton Margaret River Airport from Sydney and Melbourne. While these flights are important for the region’s wine tourism industry as it recovers from the severe effects of COVID-19 response policies [5], they also present a new pathway for the potential introduction of phylloxera via national and international wine tourists. In this paper, we simulate the spread and economic impact of phylloxera on the WA winegrape industry over a 50-year period following a hypothetical incursion event in the Margaret River wine region.
Phylloxera was first recognized as a serious pest of winegrapes following its accidental introduction to France from its native range in north-eastern America in the early 1860s [6, 7]. By the turn of the century, it had caused major damage to V. vinifera throughout Europe and severe economic losses in traditional wine-growing and wine-making areas [8]. The first detection of phylloxera in Australia occurred in 1875 at Geelong in Victoria, where attempts were made to eradicate it by removing infested V. vinifera [6]. However, it was soon found in other Victorian grape-growing areas near Bendigo, Heathcote and Rutherglen, and by the 1880s, it had been discovered in New South Wales in the Albury/Corowa region [9]. Quarantine protocols involving restrictions on the movement of plant material, machinery and cleaning requirements have limited further spread in these regions but have not eliminated it. There are currently six phylloxera-infested zones in Victoria (Nagambie, Mooroopna, Whitebridge, Upton, North East Victoria and Maroondah) and two in New South Wales (Albury/Corowa and the Greater Sydney Region) [10].
Long-distance dispersal of phylloxera occurs through human-assisted pathways, including infested planting material, grapes, foliage, machinery, soil, winery waste, clothing and footwear [11]. It is the first instar or ‘crawler’ life stage that is considered the highest risk for introduction and establishment due to its mobility when seeking a food source [12]. Effective and enforced quarantine regulations can limit the long-distance spread and subsequent impact of these crawlers [6]. In WA, biosecurity restrictions on the movement of both grapevine material and fruit into the state were implemented as early as 1914, primarily because of the risk of phylloxera introductions [13]. These restrictions, with additions involving the movement of vineyard machinery, remain in place today.
Internationally, the only effective long-term management option in areas where phylloxera has become established involves the adoption of resistant or tolerant rootstocks derived from various American Vitis sp. that have coevolved with the insect [14]. For a rootstock to be classified as resistant, phylloxera may survive for up to a month on the roots but cannot produce new eggs [15]. While alternative management strategies have been successful in some circumstances, they are not generally applicable. For example, flooding vineyards in winter months is used to suppress phylloxera in southern France [9, 16] and biological control experimentation has been ongoing since the 1870s with recent work involving fungi [9, 17]. However, planting to resistant rootstocks has been the primary management strategy in most areas affected by phylloxera [18].
It has been more than a century since phylloxera first burst into social consciousness in Europe, and modern wine tourists may not necessarily be aware of the risk it continues to pose to winegrape producers [19]. Wine tourists now travel further and faster than ever before to experience the cultural and culinary amenities offered by wine-producing regions [20], yet recent surveys conducted in South Australia found that some tourism operators do not routinely include biosecurity messaging for tourists and many visitors expect to physically touch and take photos among the vines as part of their experience [21]. Purchases of food and wine at the ‘cellar door’ make an important contribution to local businesses in south-west WA, particularly in the case of small producers for whom direct-to-consumer sales account for a substantial portion of their product sales by value [22, 23]. This business model brings tourists close to vines, opening a potential pathway for the entry of pests and diseases into growing areas on customers’ clothing and footwear. The probability of a direct phylloxera introduction is probably low because vines in WA are not generally accessibility to visitors [24], but it is above zero and is likely to rise as the number of interstate and international visitors to vineyards increases.
In this paper, we simulate what would happen if phylloxera were to be introduced to the Margaret River wine region via a tourist interaction. We describe a cellular automaton model used to simulate the likely spread and impact of the insect over a 50-year period. A cellular automaton is a network of cells located on a two-dimensional lattice of specified shape that changes over a number of discrete timesteps according to a set of transition rules applied iteratively for as many timesteps as required. These models have proved useful in the study of invasive species spread, particularly when information about a pest or its hosts is uncertain [25]. Our phylloxera model is derived from the land use change model of Hewitt, van Delden and Escobar[26]. It uses a square lattice projected over a map of WA winegrape-growing regions and the likelihood of cells changing from a noninfested to an infested state is dependent on the presence of V. vinifera, soil suitability, the distance to other infested cells and the connectedness of the cell via the road network. Phylloxera spread was projected over a 50-year period, and replanting costs and revenue losses were calculated to estimate the likely cost to the WA winegrape industry over time.
Our paper contributes to the literature by valuing the potential damage caused by phylloxera to winegrape producers, and by extension, the benefits of preparedness measures to mitigate its spread and impact given recent increases in tourist access to south-west WA. Despite significant efforts to provide preborder restrictions for phylloxera, the winegrape industry in south-west WA remains highly susceptible to an outbreak because of the reliance on own-rooted V. vinifera vines. While around 70% of winegrapes worldwide are grown on rootstock [27], the proportion in WA is only about 5% [28]. To our knowledge, no published studies have simulated phylloxera spread in south-west WA and the resultant costs of winegrape growers replanting V. vinifera to resistant rootstock. All monetary values in the paper are stated in Australian dollars.
2. Materials and Methods
The model employed in this study provides both a visual and mathematical representation of the likely spread of phylloxera if introduced to south-west WA. Of the various genotypes of phylloxera that have been identified in Australia, the G1 and G4 genotypes are the most common [29], but we simulated general spread and impact trajectories rather than those of a specific genotype. The assumption in this model is that there are no efforts to control or eradicate the pest or mitigate spread in addition to replanting affected vines to resistant rootstock. Thus, in this instance, grape phylloxera is determined to be established and uncontrolled after initial detection.
Derived from the cellular automaton model of Hewitt, van Delden and Escobar [26], our model accounted for local and satellite spread and uses data layers to influence the spatial allocation of phylloxera in the study area over time in a simulation of an incursion event. The model used a square lattice with a cell size of one ha (100 m × 100 m) and a Moore neighbourhood structure [30]. Calculations were performed at yearly timesteps over a simulated 50-year period, and the area of cells that transitioned from a susceptible to an infested state from one year to the next was determined by a logistic spread function, explained below. The characteristics of individual cells, including whether they contain V. vinifera and suitable soil types, and their proximity to roads and phylloxera-infested cells, determined their likelihood of transitioning from a susceptible to an infested state from one timestep to another.
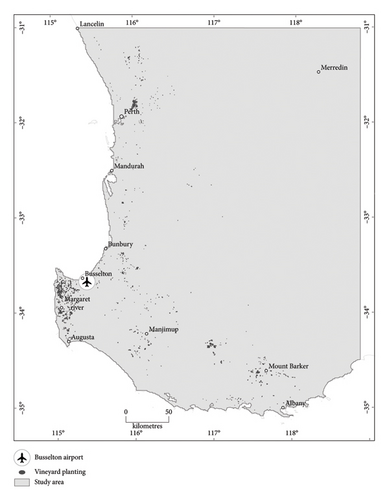
A 128,969 sq km section of south-west WA containing all the state’s commercial winegrape production was used as the study area (Figure 1). The climate in the region is Mediterranean, with cool wet winters and hot dry summers, and is favourable to the establishment and spread of phylloxera [4]. Average daily temperatures in the region have risen 0.5°C in the last 50 years and average rainfall has declined 10%–25% [31], but we assume this will not affect the insect’s survival over the next 50 years. Vineyards in Margaret River, the Swan Valley, Great Southern, Pemberton, Manjimup, Geographe, Blackwood Valley, the Peel Region and the Perth Hills cover a total area of approximately 11,100 ha of the study area [32]. Winegrape production is based predominantly on cool climate viticulture and premium wine varieties such as Cabernet Sauvignon, Shiraz, Merlot, Chardonnay, Sauvignon Blanc and Semillon. Annually, the region produces around 56,900 T of winegrapes valued at approximately $104.0 million [33]. We have not included areas planted to table grapes in these regions in our analysis as commercial table grape production in WA is entirely planted on phylloxera-resistant or tolerant rootstocks.
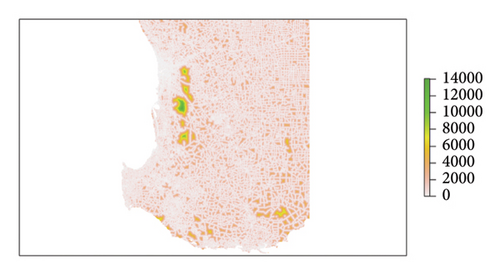
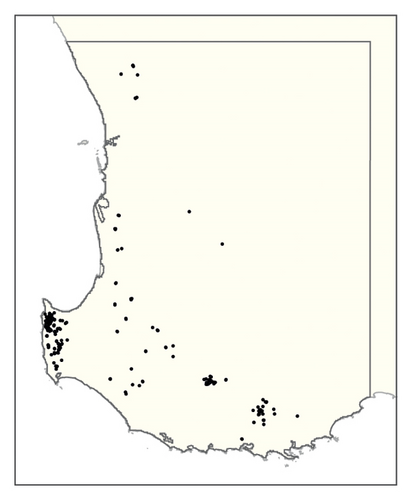
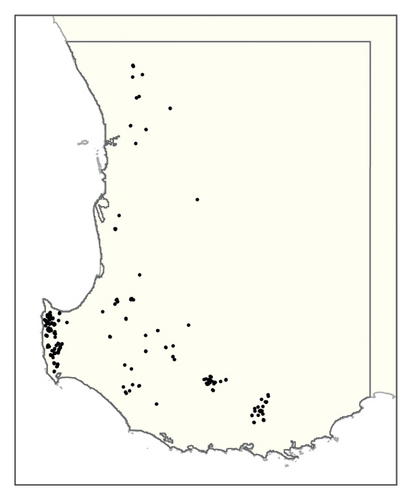
The parameter Ai was informed by the distance (in m) of each cell i to the regional road network [34] and parameter Si by a soil infestation hazard map of the study area prepared according to Chandel et al. [14] with modifications to accommodate differences in soil texture raster specifications and previous work on phylloxera risk in WA soils [4, 35]. These data layers are shown in Figures 2(a) and 2(b), respectively. Sand content rasters were modelled for WA according to the Global Soil Map specifications and methods used for national soil texture mapping [36, 37]. These regional maps utilized all available georeferenced soil texture information from laboratory measurements and field hand texturing [38]. The detailed methodology is provided in Supporting Information (S1), and datasets are available on request. Sand content rasters were summarized over 0–60 cm and 0–100 cm using depth-weighted averaging. The final phylloxera soil hazard raster was classified using the thresholds summarized in Table 1. The methods applied here deviate from [39, 40] in the selection of sand thresholds. Two additional classes were defined for moderate-risk soils and greater emphasis is placed on texture in the rooting zone (0–60 cm) [4], rather than relying on average texture within 0–100 cm.
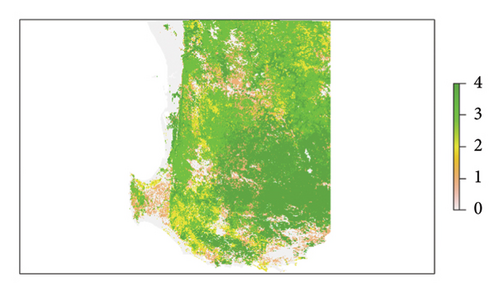
| Category | Hazard descriptor | Depth (cm) | Sand content (%) |
|---|---|---|---|
| 0 | Very low | 0–100 | > 90 |
| 1 | Low | 0–60 | > 90 |
| 2 | Moderate | 0–60 | 80–90 |
| 3 | High | 0–60 | 65–80 |
| 4 | Very high | 0–60 | < 65 |
The costs of replanting V. vinifera as they became infested were calculated as a multiple of the simulated output data for at and included additional growing costs (i.e., replanting to American Vitis rootstocks) and reduced revenue (i.e., yield loss). These costs were subjected to discounting because there is a time dimension to the calculations. This process involves applying a discount to costs incurred in the future such that replanting costs incurred later in the simulation have a smaller value than those incurred earlier in the simulation. The assertion is that before a cost is incurred, this money could have been invested to earn an interest rate, so the further into the future it is lost to phylloxera the greater the interest that might have been earned. It follows that the discounted or present value of costs incurred later is valued less than those incurred earlier in the simulation.
Here, R is the capital cost and labour cost of removing and replanting 1 ha of V. vinifera to resistant rootstocks (Table 2); γt is the rate of vine growth in timestep t following replanting; G is the gross value of fruit produced by an average ha of vines in an average season; Y is the change in yield attributable to replanting to resistant rootstock; and δ is the discount rate. We included the possibility of a yield penalty, Y, from replanting to resistant rootstock but acknowledge that results from field experiments with winegrape varieties are mixed, with some trials reporting negligible effects (e.g., [42, 43]) and others variable or large effects (e.g., [27, 44–50]). We also recognize that yield effects are difficult to value without taking quality into account since vines produce smaller fruit yields that increase in flavour intensity and complexity as they age, making them valuable for the production of premium wines [51]. We do not account for quality loss in this hypothetical incursion simulation.
| Item | Cost ($/ha)a |
|---|---|
| Vine removal and disposal∗ | 12,500–15,000 |
| Rootstock/vines | 20,000–24,000 |
| Planting/guards | 11,250–13,500 |
| Irrigation dripper tube | 6250–7500 |
| Trellis materials | 22,500–27,000 |
| Trellis labour | 4375–5250 |
| Contingency (10%) | 10,125–12,150 |
| Total | 87,000–104,400 |
Parameter values appear in Table 3 with explanations and sources for each provided. Parameters were defined as uniform distributions (with minimum and maximum values) when their values were uncertain. Using the Monte Carlo method, we ran 5000 iterations of the model in which one value was sampled from every distribution and used to calculate spread and impact over a 50-year timeframe.
| Parameter | Description | Value (s) | Units | Sources/notes |
|---|---|---|---|---|
| amax | Area of vines in the study area | 11, 100 | ha | Department of Primary Industries and Regional Development [32] |
| rmax | Maximum proportion of vines affected | Uniform (70, 80) | % | Botha, Stephenson and Tille [4] |
| rmin | Minimum proportion of vines affected | Uniform (0.01, 0.05) | % | Plausible value range |
| tθ | Time until proportion affected reaches θ | Uniform (30, 50) | yr | Plausible value range |
| θ | Proportion of vines affected at tθ | Uniform (60, 70) | % | Plausible value range |
| Ni | Cell neighbourhood structure | na | na | Moore [30] |
| Ai | Accessibility | na | na | Main Roads Western Australia [34] |
| Si | Soil suitability | na | na | See Table 1 |
| β | Stochasticity scale parameter | Uniform (0.25, 0.75) | Unitless | Plausible value range |
| R | Cost of replanting 1 ha of grapes | Uniform (87000, 104,400) | $/ha | See Table 2 |
| G | Gross value of fruit produced per ha | 6800 | $/ha | Radhakrishnan and Prince [33]; Department of Primary Industries and Regional Development [32] |
| Y | Yield penalty | Uniform (0, 20) | % | Nicholas [46]; Dry [47] |
| δ | Discount rate | Uniform (3, 7) | % | Parliament of Australia [53] |
| vmax | Maximum vine volume | 100 | % | Plausible value |
| vmin | Vine volume after replanting | Uniform (1, 5) | % | Plausible value range |
| g | Vine growth rate | Uniform (40, 100) | % | Guiterrez, Williams, and Kido [54] |
3. Results
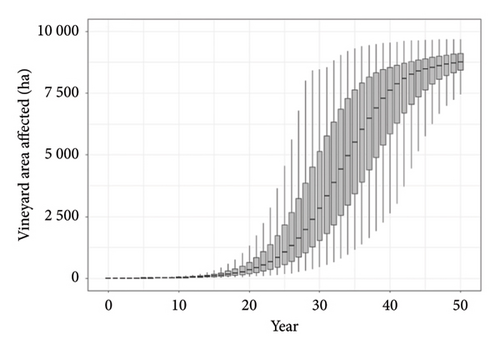
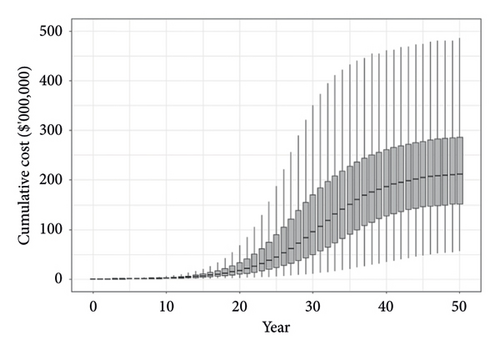
The spread and impact of phylloxera in WA predicted using the model are revealed in the boxplots in Figure 3 which show the fifth, 25th, median, 75th and 95th percentiles of the area affected over time (Panel A) and the resultant costs to producers (Panel B). The parameters we have used produce a relatively slow rate of spread over time with 50% of iterations predicting the area of V. vinifera affected to be 600–2200 ha by year 25 and 8400–9100 ha by year 50 (Figure 3(a)). The present value of costs of replanting these vines to resistant rootstock and revenue losses while replanted vines mature was estimated to be $25–90 million after 25 years and $150–290 million after 50 years (Figure 3(b)). The median cost after 50 years was approximately $210 million.
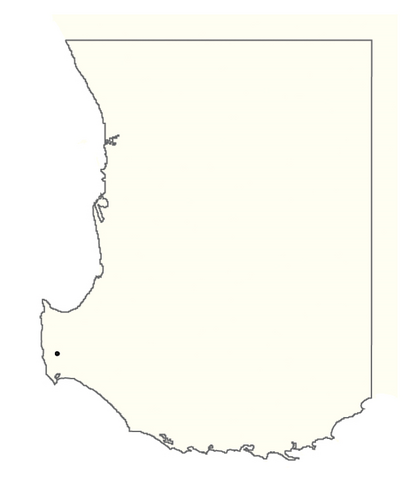
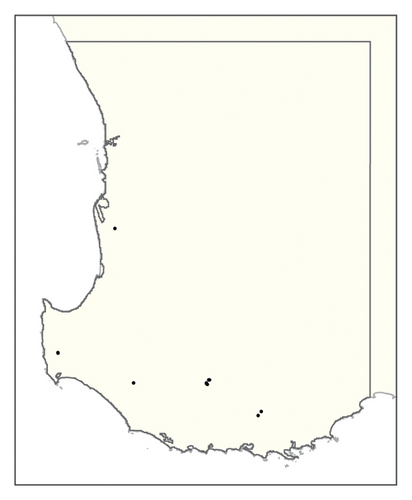
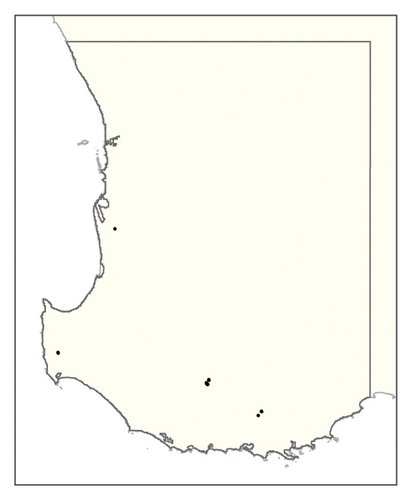
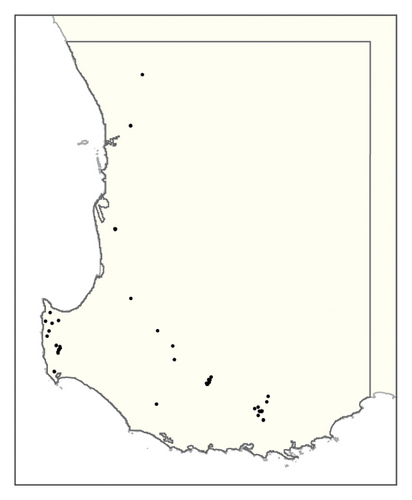
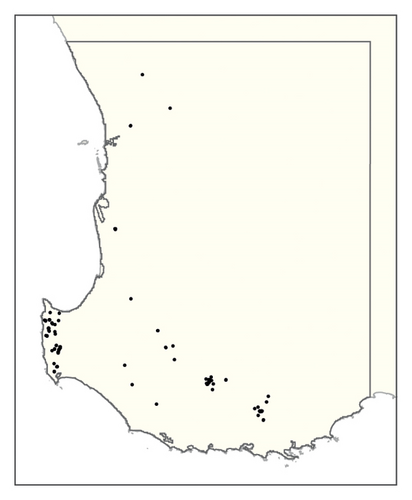
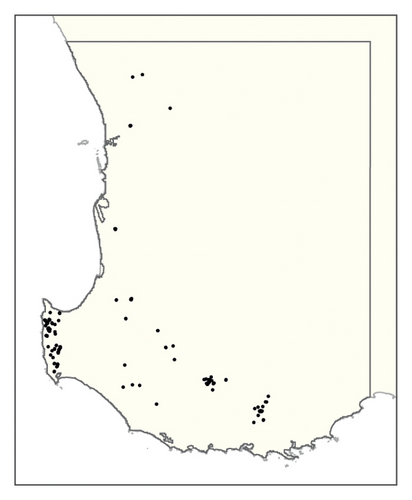
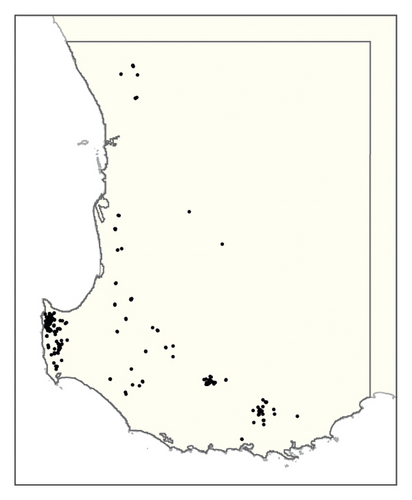
A spatial representation of spread over time is shown in Figure 4. Figures 4(a), 4(b), 4(c), 4(d), 4(e), 4(f), 4(g), 4(h), 4(i) show all infested cells at timesteps 0, 5, 10, 15, 20, 25, 30, 40 and 50, respectively. The panels show how spread occurred in one iteration of the model in which the first ha affected was in the Margaret River region in the lower left-hand corner of the map. Given our assumption of unrestricted spread, the infestation reached vine plantings in the Great Southern region where soils are most favourable to phylloxera establishment within the first 10 years. However, spread was most pronounced in the Margaret River region in the 50 years following introduction due to the relatively high density of vineyards in this region.
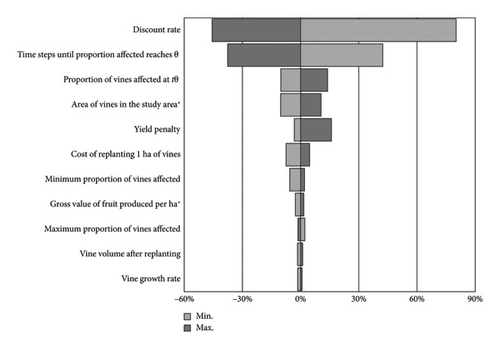
Given the uncertainties in many model parameters, we conducted a sensitivity analysis to determine which had the greatest influence on the results. We used a simple approach whereby each parameter was set to the minimum and maximum values of its range in the case of parameters specified as uniform distributions or by ±25% in the case of fixed value parameters while all other parameters were held constant. The effect of the minimum and maximum values for each parameter had on the present value of costs to the industry is reported in Figure 5. Here, the influence of each parameter is indicated by the length of corresponding bars, and parameters are ranked from top to bottom in order of the change they produced in the present value of costs after 50 years. Parameters that were not specified as distributions (Table 3) are indicated with asterisk.
4. Discussion
The risk to WA’s winegrape industry associated with phylloxera appears substantial with more than 8500 ha of winegrapes likely to be affected after 50 years if the parameters we have used are accurate. This is broadly consistent with observed unrestricted spread in France where approximately 70% of vines were affected between its introduction in the 1860s and the turn of the century [16]. The comparison is questionable due to differences in production systems, planting densities, climate, and technology, but there are no contemporary examples of unrestricted spread with which to compare our model predictions. The costs to the industry over 50 years predicted using our model are equivalent to a 3%–6% reduction in the gross annual value of WA winegrape production. However, the model only accounts for costs associated with transition to resistant rootstocks. It does not account for other impacts following an incursion and subsequent changes in practice to minimize and mitigate the spread that would occur, or the flow-on effects on the wine industry, communities or local economies.
Results were most sensitive to changes in the discount rate as more than half of the vines affected were infested after year 30 (Figure 5), meaning that the erosive effects of discounting on the resultant costs were more pronounced than they would have been had they occurred earlier in the simulation. Lowering the discount rate to 3% from its median value of 5% (i.e., −40%) produced a large increase in the median present value of phylloxera damage costs over 50 years from $210 million to $380 million (+80%). Likewise, increasing the discount rate to 7% (+41%) lowered the present value of phylloxera damage costs to $110 million (−46%). We used discount rates suggested in the Commonwealth of Australia [55] but acknowledge that choosing an appropriate value for this parameter in a case study with cost streams that extend far into the future is a contentious issue [56].
Our results were also sensitive to changes in the parameters θ, tθ and amax (Figure 5), which are important determinants of the sigmoidal growth function. Recall that amax is the maximum area of grapevines in the study area, θ is the proportion of amax that corresponds to the maximum inflection point of the spread function (i.e., equation (2), where amax is the asymptote) and tθ is the estimated number of timesteps that elapse before this inflection point is reached in the simulation. tθ is inversely related to the present value of costs over 50 years, with smaller values suggesting more rapid spread and higher costs (i.e., incurred earlier in the simulation), and vice versa, while θ and amax are positively related to long-term costs. The simple sensitivity analysis we have used is problematic as it assumes θ and tθ are independent when in fact we would expect them to be correlated, with higher values of θ taking more timesteps for the spread model to reach. Additionally, our study lacked the resources to formally elicit the opinions of viticulture and entomology experts outside of our multidisciplinary author group when deciding on appropriate value ranges for the parameters of the spread function. The sensitivity of these parameters suggests that future research involving expert elicitation would be beneficial, particularly if a specific phylloxera genotype is of interest.
Assays have shown marked differences between the phylloxera clones with respect to their ability to survive on V. vinifera. In north-east and central Victoria, two dominant and widespread genotypic classes, G1 and G4, have been identified [57]. These genotypes, referred to as ‘superclones’, are found across several regions where ungrafted rootstocks are planted [29]. These lineages appear to be the most invasive because they have been detected in the vineyards infested most recently in the King Valley (G4), Upton (G1), Murchison (G1), Lancefield (G1) and several outbreaks in the Yarra Valley (G1) [6, 58, 59]. In contrast, other genotypic lineages are mostly confined to three regions, Rutherglen, Glenrowan and Milawa, with the Rutherglen region containing the greatest amount of genetic diversity [29, 60].
An incursion in WA of either or both superclone genotypes, however, need not necessarily lead to higher economic impacts than other clones. Root assays have shown that G1 and G4 outperform all other phylloxera lineages on ungrafted V. vinifera vines and cause significant physiological deterioration of the vines [29], and these findings are supported by data collected using the glasshouse bioassay method [15]. However, there are vineyards planted with V. vinifera on their own roots in regions of Victoria where superclones are present that remain unaffected [60]. Moreover, damage levels within V. vinifera vineyards are likely to be more apparent when G1 or G4 genotypes are present, potentially reducing the lag time between the initial infestation and visual detection. Lag times of more than 2 years can result in widespread movement of the insect before a response is initiated [59], so in terms of early intervention, it could be advantageous to have an aggressive genotype that reveals itself sooner. Future applications of our model at a subregional scale could explore the financial implications of detection lags with spread parameters tailored to different phylloxera genotypes.
We acknowledge that the potential costs of phylloxera to the regional economy of south-west WA would extend beyond grape producers because of the strong multiplier effects of the industry. Grape producers supply vital inputs to local wine producers and generate direct economic benefits by sourcing their own inputs locally, creating flow-on benefits to related businesses. For example, the growth of wine tourism in Margaret River has spawned a host of complementary enterprises, including restaurants, breweries, confectionary stores, cheesemongers and transport services [24]. Farm supply businesses, consulting services, irrigation services and contract harvesting services would also be affected by a contraction in the winegrape industry. It is estimated that the output multiplier for WA winegrapes is 1.4 [61], which implies that a 3%–6% reduction of winegrape production resulting from phylloxera will produce a 4.2%–8.4% contraction of the regional economy which we do not account for in our model. The impacts of this contraction could be offset by environmental benefits that are also absent from our model, such as reduced carbon emissions resulting from international travel, private vehicle use, hotel stays, shopping, local activities and food consumption [22, 62].
Soil temperature, which is a principal determinant of phylloxera establishment and spread [14], is a data layer we have not been able to include in the analysis. Soil temperature observations for our study region from the Department of Primary Industries and Regional Development weather station network (https://weather.agric.wa.gov.au) are currently only recorded at a depth of 4 cm, making them unsuitable for studies involving phylloxera which has been observed infesting vine roots at depths in excess of 1.2 m [63]. Temperature fluctuations outside of phylloxera’s critical thermal limits are possible in a Mediterranean-type climate. Soil temperatures > 18°C are considered necessary for the establishment of phylloxera feeding sites on vine roots [63], and life table analyses and temperature–mortality studies have determined an upper thermal limit for phylloxera of 36°C–40°C [64–66]. Climate change could increase phylloxera infestation risk [67], but it is difficult to predict the implications of this for WA in the absence of soil temperature data. It may be possible in future to obtain data from depths exceeding 1 m or to extrapolate from data collected from regions with comparable climates.
Future research using the model could also investigate alternative incursion response policies intended to slow the spread of phylloxera through, for example, exclusion zones akin to those set up in eastern Australia, or to simulate worst-case incursion scenarios and help form policy responses to them. The scenario we chose to model, based on an incursion in the Margaret River region to highlight potential risks associated with increased tourism to the area, is hypothetical. The base model developed in the current study could help decision makers to rapidly determine probable spread and impact scenarios that might result from an incursion anywhere in the south-west region and the benefits of response actions over time. For example, if intrastate quarantine zones were to be considered that can reduce tθ from 40 to 50 years, our sensitivity analysis (Figure 5) suggests the damage costs avoided over 50 years would be almost $80 million, implying an average annual benefit of $1.6 million. Supposing the costs of establishing and maintaining these exclusion zones was $1 million per year, this suggests a likely return on investment of $1.60 per dollar invested. If exclusion zones are as successful as those used in Victoria and New South Wales that have contained spread to 2% of Australia’s vineyards after nearly 150 years [9], the return on investment for this response strategy could be substantially higher.
5. Conclusions
This paper has outlined a model used to simulate the potential spread and economic impact of phylloxera in south-west WA over a 50-year period. Although this region has remained free of the pest, it remains highly susceptible due to its reliance on own-rooted V. vinifera. The recent introduction of flights from Sydney and Melbourne to the Busselton Margaret River airport presents a new pathway with the potential to introduce phylloxera directly to the Margaret River region via wine tourism. As the only way of controlling phylloxera once it becomes established within a vineyard is to remove all infested vines and replant using resistant American Vitis rootstock, it is an expensive pest to manage within a vineyard. However, as experience with the pest elsewhere in Australia has shown, damage can also vary depending on the phenotype involved, with the superclones G1 and G4 considered the most damaging to V. vinifera. Using a representative set of spread parameters, we estimate that the area of vines affected by phylloxera following an introduction to Margaret River wine region would be 600–2200 ha after 25 years and 8400–9100 ha after 50 years in the absence of response policies that reduce spread. To visualize spread, we constructed a cellular automata model and used roads and soil-type data layers to represent the susceptibility of vineyards to anthropogenic spread and their suitability to phylloxera establishment. We estimate the present value of costs from replanting vines to resistant rootstock and revenue losses as replanted vines reach maturity would be $150–290 million. The model forms a base around which future adaptations can be made to simulate the impacts of specific genotypes, specific incursion events and response actions. Future refinements to the cellular automata model to include soil temperature would also allow us to explore the susceptibility of WA vineyards under climate change scenarios.
Conflicts of Interest
David Cook, Andrew Taylor, Peter Gardiner, Rodrigo Pires, Karen Holmes and Helen Spafford declare their affiliations with a Western Australian Government Department (Department of Primary Industries and Regional Development). They declare these affiliations given that the subject matter of the paper involves possible future biosecurity policies involving the Western Australian Government.
Funding
No funding was received for this research.
Acknowledgements
The authors thank Angela Stuart-Street (retd), Peter Tille (retd), Nick Middleton, Dr Kristen Kennison, Richard Fennessy, Dennis van Gool, Peter Gartrel and Dr Vilaphonh Xayavong from the Department of Primary Industries and Regional Development for information generously provided.
Supporting Information
S1. Western Australia soil texture rasters used for phylloxera hazard modelling.
The soil texture rasters used in our study were modelled from regional data using methods similar to Malone and Searle [37]. The approach was modified to construct a regional calibration utilizing soil data assembled from multiple sources and of varying quality to capture as much spatial variation as possible across the study area.
Table S1. Number of data used for model training (train/test), and number withheld for independent validation (Validate). The percentage of samples by texture class was calculated on the total number of samples per depth layer. Colours and hazard labels identify the three texture groups for soil-based phylloxera infestation hazard.
Figure S1. Soil texture classes for samples with particle size analysis in southern Western Australia, south of 27°S. Texture class grid from Minasny and McBratney (2001, fig. 3). Field texture classes (labelled on graph): Clay (C), sand (S), loam (L) and silt (Z). Departure from diagonal indicates silt (Z) content.
Figure S2. Maps of phylloxera risk using the method from Chandel et al. [14] produced from (left) the soil texture rasters described here and (right) the soil texture rasters from the SLGA [37].
Open Research
Data Availability Statement
The data that support the findings of this study are available upon request from the authors.


