Effect of Contrasting Cap Management Protocols on the Phenolic Composition, Redox Potential, and Sensory Properties of Pinot Noir and Petite Sirah Wines
Abstract
Red wine cap management during alcoholic fermentation influences the extraction of phenolic compounds from grape solids and in turn affects oxygen consumption, oxidation–reduction potential (ORP), and must homogenization. Tailoring cap management protocols to influence these processes is essential for targeting wine style based on varietal and fruit composition. Herein, Pinot noir and Petite Sirah wines were produced with five cap management protocols, namely, pumpovers (POs), punchdowns (PDs), no cap management (NoCapMgmt), air mixing (AirMix), and nitrogen mixing (N2Mix). ORP of AirMix wines reached peaks of 340 mV and 240 mV in Pinot noir and Petite Sirah, respectively, while N2Mix wines were consistently below −50 mV during alcoholic fermentation. At pressing, treatments deemed oxidative, that is, AirMix, PO, showed the lowest concentrations of acetaldehyde, and treatments deemed reductive, that is, NoCapMgmt, N2Mix, the highest. Relative to PO wines at pressing, PD wines showed 22% increases in total phenolics in Pinot noir but insignificant differences in Petite Sirah. PD increased flavan-3-ol concentrations in both varietals. After 8 months of bottle aging, NoCapMgmt contained > 50% more esters than PD wines in both varietals. Ethyl n-decanoate and isoamyl acetate exhibited the highest odor activity values (OAVs) in all wines. Ethyl n-decanoate ranged from 121 (NoCapMgmt) to 69 (AirMix) in Pinot noir and 186 (NoCapMgmt) to 103 (PD) in Petite Sirah. Isoamyl acetate ranged from 52 (NoCapMgmt) to 20 (PD, AirMix, N2Mix) in Pinot noir and from 174 (NoCapMgmt) to 95 (AirMix) in Petite Sirah. In both varietals, AirMix wines showed decreased astringency and increased red fruit character, while N2Mix wines had higher color saturation and no reductive aromas despite consistently low ORP during alcoholic fermentation. Present results provide winemakers with tools to optimize fermentation kinetics and labor costs, selectively extract phenolic compounds, and produce wines of targeted style and sensory profiles in varietals with contrasting phenolic profiles.
1. Introduction
Pinot noir and Petite Sirah are the second and sixth most planted red winegrape varieties in California, respectively [1]. These varieties display contrastingly different phenolic compositions, with Pinot noir wines generally containing low levels of anthocyanins, tannins, and polymeric pigments [2, 3]. Conversely, Petite Sirah wines are typically high in these compounds [4]. These phenolic compositions have direct influences on wine color, hue, bitterness, and astringency, among other characteristics [5].
Understanding the factors that underpin these phenolic differences as well as that of the different winemaking processes is key to establishing cap management regimes tailored to these varietals. In traditional red winemaking, the extraction of anthocyanins and tannins requires a period of maceration of the grape solids, that is, skins, seeds, and optionally stems during alcoholic fermentation [5, 6]. During maceration, a sufficiently active yeast population in the fermenting must will produce enough carbon dioxide (CO2) to lift upwards the fermentation solids, effectively creating the cap, which is roughly two thirds submerged in the liquid. Extraction from grape solids occurs via diffusion and can, therefore, be limited by local concentrations of phenolic and volatile compounds near the cap [6, 7]. Extraction kinetics are further influenced by factors including, but not limited to, time and temperature, solvent conditions, and solid–liquid contact during maceration [8]. Cap management regimes, including punchdowns (PDs) and pumpovers (POs), are performed during maceration to control these effects through homogenization of both temperature and chemical gradients, the management of the contact and mixing of grape solids with the juice, and the introduction of oxygen to the must [6, 9].
Previous reports have documented the chemical impact of various cap management regimes on phenolic extraction. Studies on Cabernet Sauvignon found that up to three PDs twice daily in 60 L fermentors [10] and two wine volumes of POs twice daily in 100 L fermentors [11] had only minor effects on phenolic extraction when compared with no cap management (NoCapMgmt). Furthermore, in both studies, the phenolic composition of these wines became increasingly similar along with bottle aging. Because these fermentors were of relatively small volume, chemical and physical gradients of lesser magnitude relative to larger fermentors may be expected. However, further studies on commercial 1.5-ton fermentations of Pinot noir compared standard cap management with a minimal intervention protocol, wherein PDs were performed only postalcoholic fermentation [12]. Results showed minor differences, that is, control wines had slightly higher anthocyanins, while minimal intervention wines had slightly more tannins, in agreement with the previous reports. Basic chemistry, chromatic profile, and polymeric pigment formation were unaffected by the treatments [12].
The aforementioned studies suggest that, given favorable fermentation conditions, wines of similar phenolic composition can be made with minimal cap management when compared with wines made with traditional cap management protocols, that is, PDs and POs. However, cap management has been shown to have consequence on aspects other than phenolic extraction, including oxygen dissolution, and yeast viability. For example, different modalities of PO (i.e., closed, open, and open with venturi injectors) impact to a greater or lesser extent the amount of dissolved oxygen in a fermenting must, with closed POs imparting negligible amounts, and open POs with venturi injectors imparting upto 3 mg O2/L at each PO session in 5000 L to 40,000 L commercial fermentors [13]. Further previous research showed that pulsed additions of 5–10 mg O2/L during the stationary phase increased Saccharomyces cerevisiae fermentation rate in wine-like conditions [14]. It has similarly been shown that superfluous oxygen consumption by yeast positively affected fermentation kinetics and cell biomass during alcoholic fermentation [15]. However, excessive oxygen during alcoholic fermentation has been shown to reduce wine color [16]. Pinot noir in particular, because of its inherently low phenolic concentration and rather rudimentary anthocyanin composition, favors PDs, as these may allow for a gentler extraction while limiting excessive oxygen exposure during alcoholic fermentation, which can be detrimental for phenolic and aroma compounds [17]. Thus, adjusting cap management techniques and, therefore, oxygen exposure can minimize the risk of stuck or sluggish fermentations.
Previous research has shown oxidation–reduction potential (ORP) to be an effective control point to optimize yeast performance and prevent the formation of reduction aromas and thus amenable to be manipulated by varying cap management protocols. ORP is defined as the tendency of reactive solutes to accept or donate electrons, and in complex media such as wine, the ORP is a dynamic measurement related to multiple forward and backward reactions [18]. The Nernst equation is utilized to relate the ratio of these oxidized and reduced species, as well as pH and temperature, to an ORP value [19]. In semiaerobic and anaerobic systems, the measured potentials are believed to be independent of dissolved oxygen concentration [20]. Due to the rapid consumption of oxygen by yeast and lees, wine has been shown to contain little to no dissolved O2 (< 0.05 mg/L) during the course of alcoholic fermentation [13]. Therefore, ORP is considered a more accurate measure of the oxidative or reductive state of the wine and a more effective control point than dissolved O2 during alcoholic fermentation. Displaying the potential of cap management to be a tool to modulate ORP, Killeen [21] used air additions to control ORP during alcoholic fermentation, successfully maintaining a minimum ORP of 215 mV (standard hydrogen electrode scale) by injecting air into a fermenting must. In addition, these ORP-controlled fermentations showed greater yeast cell viability and fermentation rate relative to uncontrolled fermentations. ORP control can additionally be utilized to limit the production of undesirable volatile sulfur compounds (VSCs), especially hydrogen sulfide (H2S) [21–23], and alter the metabolic pathways leading to ester production of Saccharomyces cerevisiae [24]. The effect of ORP on these potential negative phenolic and aromatic impacts has not been previously reported.
The literature above suggests that cap management regimes can have varying consequences on the performance of alcoholic fermentation, phenolic extraction, retention of sensory-active volatiles, and, potentially, the evolution of the ORP. However, as previously stated, under conditions of favorable tank geometry and volume, techniques that involve minimal cap management can produce wines of similar phenolic composition relative to traditional cap management techniques. It is, therefore, of interest to investigate the benefits of air injections in fermentations carried out in the absence of, or with limited cap management. These air mixing events may sufficiently homogenize the fermenting must, while controlling O2 additions and ORP under a protocol with a drastically reduced need for human labor hours. Furthermore, the understanding of the effects of sparging with inert gasses such as nitrogen or argon on the management of VSCs, as demonstrated in previous research [25], is of practical relevance. The use of these inert gases as well allows for the exploration of the benefits of physical mixing without introducing the confounding factor of oxygen additions.
The present study investigated the chemical, including phenolics and volatiles, and sensorial effects of five contrasting cap management protocols, including PDs, POs, NoCapMgmt, as well as mixing with air and with nitrogen (N2) gas through a sinter element submerged in the fermenting musts. In addition, ORP was monitored during alcoholic fermentation of air mixing and N2 gas mixing treatments. We applied these protocols in triplicate to two contrasting varieties of equal merit, history, and relevance in the Central Coast of California, namely, Pinot noir (low phenolic varietal) and Petite Sirah (high phenolic varietal). This experiment was undertaken with the goal of finding commonalities and contrasting behaviors in terms of their responses to these protocols measured as chemical, volatile, and sensory changes.
2. Materials and Methods
2.1. Grapes
Pinot noir clone 115 (1.32 t) was hand-harvested on October 2, 2023, from Drum Canyon Vineyard in the Sta. Rita Hills AVA, California (Lompoc, CA, USA). Petite Sirah (1.39 t) was hand-harvested on November 2, 2023, from Sunnybrook Vineyard in the Paso Robles AVA, California, (Paso Robles, CA, USA). Fruit was transported to the Research Winery of the Wine and Viticulture Department (California Polytechnic State University, San Luis Obispo, CA, USA), and processed on the same day as fruit harvesting.
Basic fruit chemistry (Supporting Information Table 1) was assessed for both Pinot noir and Petite Sirah by randomly selecting 15 whole clusters upon receiving the fruit. Analyses included titratable acidity (TA), malic acid, and yeast assimilable nitrogen (YAN), which were measured enzymatically (SPICA Automatic Analyzer, Admeo, Angwin, CA, USA) using commercially available kits (Biosystems, Barcelona, Spain). Total soluble solids (Brix) were measured using a temperature-compensated densimeter (DMA, Anton Paar, Graz, Austria), and pH was measured using a pH probe (Thermo Fisher Scientific, Waltham, MA, USA).
Berry compositional data (Supporting Information Table 2) were collected as follows.
Randomly selected clusters (n = 30) were taken and divided into three groups. From each group, 30 randomly selected, unbroken berries were removed by hand. Each of these sets of 30 berries were weighed as whole berries, before having their skin removed using a fine edged blade (X-Acto, Westerville, OH, USA), which were separated of any remaining pulp using a paper towel and weighed using an analytical benchtop scale (Fisher Science Education ALF203 200 g scale, Thermo Fisher Scientific, Waltham, MA, USA). Seeds were removed from the pulp and similarly dried and weighed using the same scale. A randomly selected group of clusters and randomly selected berries from each group allowed for an accurate representation of the berry compositions across the lots of fruit received.
2.2. Winemaking and Experimental Design
All winemaking procedures were kept strictly constant for both Pinot noir and Petite Sirah unless, otherwise, specified. Upon receiving the grapes in 0.5-ton Macro-Bin containers (IPL Macro, Fairfield, CA, USA), the fruit was weighed using an industrial scale (Cardinal Detecto, Model 204, Webb City, MO, USA). Grapes were then destemmed and crushed by a destemmer-crusher (Bucher Vaslin, Zurich, Switzerland). The grape must was then evenly allocated by weight to 15 110 L stainless steel cylindrical fermentation tanks (interior dimensions of 89 cm height and 40 cm diameter) (Westec Tank & Equipment, Healdsburg, CA, USA), each receiving 75 ± 0.5 kg of must. The 15 tanks were randomly divided into five groups of three to become the five cap management treatments established in triplicate (n = 3). Sulfur dioxide in liquid form (SO2, 35 mg/L) was added after crushing, after which the tanks were homogenized with a PD tool.
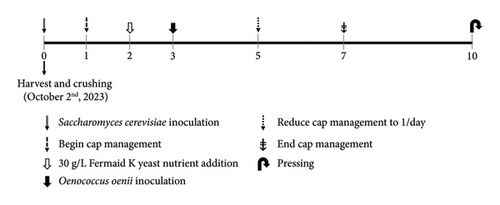
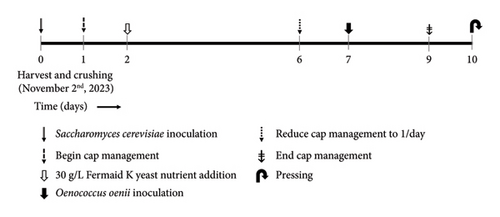
All wines were inoculated with Saccharomyces cerevisiae selected dry yeast (Pinot noir: strain D20, Enartis, Windsor, CA, USA; Petite Sirah: strain RP 15, Scott Laboratories, Petaluma, CA, USA), approximately 2.5 h after SO2 addition, and 30 g/hL yeast nutrient additions were subsequently carried out as needed in all treatments of both varietals (Fermaid K, Lallemand, Rexdale, ON, Canada). Maceration time was set to 10 days, and temperatures were maintained at an average of circa 22°C during this period. Temperature was controlled by circulating hot or cool propylene glycol through the jacket of the fermentation vessels as needed. Temperatures were measured daily throughout the maceration period with a wireless temperature probe (Elitech RC-5, Bruker, Billerica, MA, USA) retrofitted to each tank (Supporting Information Figure 1).
All treatments were composed of two cap management interventions per day at 0900 h and 1800 h following the protocols described herein. PD wines were punched down using a stainless-steel PD tool for 3 minutes. POs were performed by draining juice or wine out of the side racking valve into a plastic bin (45 L, Home Depot, Atlanta, GA, USA), open to the air. Simultaneously, a pneumatic diaphragm pump (Wilden, Grand Terrace, CA, USA) transferred the wine through 3.81 cm hosing over the top of the cap. Each PO intervention was conducted for 3 minutes, amounting to two full volumes of wine being pumped over at each session. NoCapMgmt wines received NoCapMgmt between inoculation and draining/pressing in the Pinot noir. However, a single three-minute PD was administered to the NoCapMgmt wines of Petite Sirah on the second day of maceration to encourage the start of alcoholic fermentation.
Air mixing (AirMix) and nitrogen mixing (N2Mix) treatments were performed by bubbling compressed air or N2, respectively, through a stainless-steel 2 μm pore size sinter element (Must Machining and Fabrication, Napa Valley, CA, USA), into the fermentation tanks. Gas flow rate was maintained at 3.5 L of gas per min for 1 h, at each cap management session, daily. Gas flow was measured using a flow meter (Model 351, Harris Products Group, Mason, OH, USA). The sinter element was firmly held at 10 cm above the bottom of the tank by a stainless-steel rod connected to the lid of the fermentation vessel with a tri-clover clamp. Visual examination confirmed that the small bubble size and relatively low flow rate did not disrupt the integrity of the cap during sparging sessions.
ORP was measured during fermentation of all AirMix treatments and two out of the three N2Mix treatments using a platinum electrode with a silver/silver chloride (Ag/AgCl) reference electrode (EasyFerm Plus ORP Arc 120, Hamilton, Reno, NV, USA); therefore, 220 mV is added to the values provided with this reference electrode to obtain values relative to the standard hydrogen electrode (SHE). The probe was placed 38 cm above the bottom of the tank and slightly off center to avoid direct contact with gas exiting the sinter element. ORP probes measured the ORP of the must every minute, throughout the entirety of maceration. Compressed air was produced through an air compressor (Ingersoll Rand, Davidson, NC, USA) and food grade N2 gas was sourced through a compressed N2 cylinder (Matheson, Irving, TX, USA).
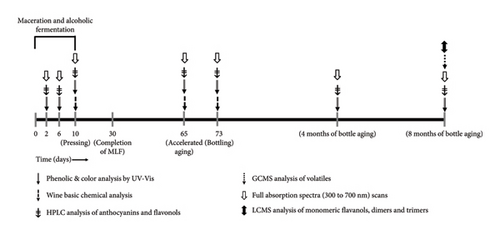
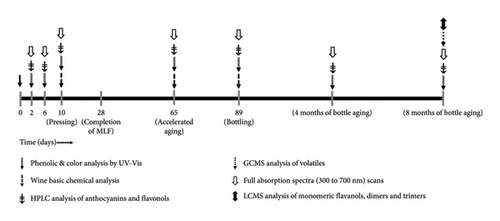
Accelerated aging was performed by bottling the wines in 50 mL air-tight glass ampules (DWK Life Sciences, Melville, NJ, USA), followed by incubation for a 5-week period at 38°C (Heratherm 120 V incubator, Thermo Fisher Scientific, Waltham, MA, USA) as previously detailed [26].
2.2.1. Alcoholic Fermentation and Bottling Preparation
An overview of the experimental design applied during alcoholic fermentation is shown in Figure 1. Acidity and initial juice Brix adjustments were as follows: all Pinot noir wines received an addition of 0.5 g/L tartaric acid on day two of alcoholic fermentation. In addition, immediately after crushing, all Petite Sirah tanks received a saignée of 8.6% by fresh weight (6.7 L of juice), followed by a 5 L acidified water addition (1.5 g/L tartaric acid), and added to each tank to ameliorate high Brix content and thus potential alcohol without altering the original liquid: solid ratio of the fruit. In the final stage of alcoholic fermentation, all wines were inoculated with Oenococcus oenii malolactic bacteria (MLB) (Lalvin VP41, Lallemand, Rexdale, ON, Canada) when an average of 5°Brix or less was first measured across all treatments within respective varietals. The choice of inoculating MLB at the end of alcoholic fermentation was chosen to allow the ORP data to solely display the effects of Saccharomyces cerevisiae, without the confound of simultaneous malolactic fermentation. Extraction during maceration was controlled in accordance with the commercial standard operating procedure by reducing cap management frequency to one session per day after °Brix reached zero and subsequently to zero cap management sessions per day.
Upon completion of malolactic fermentation, all wines were adjusted to 0.3 mg/L molecular SO2 and stored in a cool room at 8°C until filtering through a plate and frame filter (Super Jet, Buon Vino, Cambridge, Ontario, Canada) with 7 μm cellulose filter pads (Vintners Vault, Paso Robles, CA, USA). Immediately after filtering, all treatments were readjusted to 0.3 mg/L molecular SO2 and subsequently bottled in 750 mL glass bottles under argon and corked using technical corks (Diam 30, 49 mm height, 23.5 mm diameter, G3 Enterprises, Modesto, CA, USA). Bottled wines were stored in a vertical position and kept in cellar-like conditions (12–14°C) until selected moments of analysis during aging (Figure 2).
2.3. Wine Analyses
Prior to analysis, all wine samples were centrifuged for 8 min at 15, 000 g in a microfuge (Eppendorf, model 5415D, Hamburg, Germany), and the supernatant was transferred into clean 1-mL Eppendorf tubes. Samples actively undergoing alcoholic fermentation were centrifuged at 2°C and followed the same protocol as previously detailed.
2.3.1. Wine Basic Chemical Composition
Wine chemistry was measured following the same methods as described for juice chemistry, with the additional analyses of acetic acid, lactic acid, free SO2, total SO2, and acetaldehyde, measured enzymatically (Spica, Admeo, Angwin, CA, USA) using commercially available kits (Biosystems, Barcelona, Spain). Ethanol content (% v/v) was measured by near-infrared spectroscopy using an Alcolyzer Wine M analysis system (Anton Paar, Graz, Austria).
2.3.2. Wine Spectrophotometric Analysis
Color parameters, anthocyanins, tannins, polymeric pigments, and total phenolics were followed throughout winemaking and bottle aging. Spectrophotometric analyses included phenolic compounds, color parameters, and full visible spectrum absorption scans. Measurements were performed in a Cary 60 UV–vis spectrophotometer, with an 18-sample cell auto-sampler (Agilent Technologies, Santa Clara, CA, USA). Anthocyanins expressed as mg/L malvidin-3-glucoside, total phenolics expressed as mg/L gallic acid equivalents, and total polymeric pigments were measured as previously described [27]. Tannins were analyzed by protein precipitation and expressed as (+)-catechin equivalents (CEs). Wine color parameters, including full-visible-spectrum absorbance spectrum scans were determined in 1-mm path-length quartz cuvettes and using Cary WinUV color software (Version 6.0, Startek Technology, Denver, CO, USA).
2.3.3. Anthocyanins, Anthocyanin-Derived Pigments, and Flavonols
Wines were analyzed by HPLC-diode array detector (DAD) throughout alcoholic fermentation, bottle aging, and upon accelerated aging using an Agilent 1100 series HPLC system coupled to a DAD (Agilent Technologies, Santa Clara, CA), as previously described [28], with minor modifications. The HPLC separation utilized a gradient of 5% formic acid in water (Solvent A) and 100% methanol (Solvent B) at a flow rate of 1 mL/min. The gradient conditions were as follows: 0 min, 23% B; 5 min, 26% B; 15 min, 60% B; and 16 min, 100% B. The injection volume was 25 μL. Separation occurred in an Agilent Zorbax Eclipse Plus C18 4.6 × 100 mm, 3.5 μm (Agilent Technologies, Santa Clara, CA, USA) thermostated at 40°C and protected by a guard column of the same packing material. The column was equilibrated for 2 min with 23% Solvent B. Photodiode array detection (DAD) was performed from 210 to 600 nm, and the quantification of anthocyanins and flavonols was carried out by peak area measurements at 520 and 356 nm, respectively. Solvents were of HPLC grade and were purchased from Fisher Scientific (Hampton, NH). Monomeric anthocyanins were quantified using malvidin-3-glucoside chloride as the standard (Extrasynthèse, Lyon, France) and a standard calibration curve (R2 = 0.99). To facilitate interpretation, pigments were grouped as malvidin-3-glucoside, other glycosides (i.e., monoglucosylated anthocyanins, including delphinidin-, cyanidin-, petunidin-, and peonidin-3-glucosides); acylated anthocyanins (i.e., acylated and coumaroylated anthocyanin monoglucosides); and polymeric pigments and vitisins (i.e., pyranoanthocyanins, including Vitisin A and Vitisin B, as well as polymeric pigments). Flavonols were quantified using quercetin-3-glucoside (Sigma-Aldrich, St Louis, MO), as standard and a standard calibration curve (R2 = 0.99). Flavonols were grouped as quercetin derivatives (i.e., quercetin-3-glucoside, quercetin-3-gluconoride, and quercetin aglycone) and other flavonols (i.e., myricetin, laricitrin, isorhamnetin, syringetin, kaempferol, and their respective derivatives).
2.3.4. Monomeric Flavan-3-Ols
Wine samples were analyzed after 8 months of bottle aging on an Agilent 1260 Infinity II liquid chromatograph (HPLC) coupled to an Agilent Ultivo MS scan from 100 to 1400 m/z (Agilent Technologies, Santa Clara, CA, USA). A total of 10 μL of sample was injected onto an Agilent Zorbax Eclipse Plus C18 4.6 × 100 mm, 3.5 μm (Agilent Technologies, Santa Clara, CA, USA). The mobile phases were (a) 0.1% formic acid in water and (B) 0.1% formic acid in acetonitrile. The solvent flow rate was 0.8 mL/min, and the column temperature was 25°C. The gradient was as follows: 0 min, 3% B; 2 min, 3% B; 10 min, 6% B; 25 min, 42% B; 30 min, 100% B; and 32.5 min, 3% B. Samples in the autosampler tray were held at 10°C. Samples were run in negative mode using an Agilent dual electrospray ionization (ESI) source (Agilent Technologies, Santa Clara, CA, USA). The source parameters were as follows: drying gas flow, 11.0 L/min; drying gas temperature, 325°C; nebulizer pressure, 35 psi; capillary voltage, 3000 V; fragmentor voltage, 130 V. Samples were analyzed in full MS scan mode m/z 100–2000. Prior to running each sequence, the instrument was calibrated according to the specifications of the manufacturer.
2.3.5. Volatile Compounds
The extraction of volatiles from wine samples was performed using stir bar sorptive extraction (SBSE), with polydimethylsiloxane (PDMS) coated stir bars (Twister® Gerstel, Germany) following a previously described methodology [29]. The conditions for volatile extraction from wines using SBSE also followed previously a described methodology [30] with direct immersion, and Twister® stirring at 1000 rpm for 1 h at room temperature. Volatiles were desorbed from the stir bars using an automated thermal desorption unit (TDU2, Gerstel, Germany) coupled to cooled injection system (CIS-4, Gerstel, Germany) containing a liner packed with 20 mg of Tenax TA®. Thermal desorption conditions and chromatographic conditions followed previously described methods [29]. The desorbed volatile compounds were separated in an Agilent 8890 gas chromatograph system (GC) coupled to a triple quadrupole (QqQ) Agilent 7000D mass spectrometer (Agilent Technologies), operating in simple quadrupole (Q). Quantification was performed according to calibration curves obtained using pure standards diluted into synthetic wine (13.5% ethanol, 5 g/L tartaric acid, pH 3.6, 20 mg SO2/L). Calibration of internal standards for the following compounds were prepared using pure standards (> 95%) (Supporting Information Table 3): ethyl butyrate, ethyl isovalerate, isoamyl acetate, ethyl hexanoate, hexyl acetate, ethyl n-octanoate, ethyl decanoate, methyl salicylate, 2-phenylethyl acetate, ethyl cinnamate, geraniol, cis-rose oxide, linalool, β-citronellol, nerol, β-ionone, and nerolidol (trans). Compounds not included in the calibration were identified using mass spectra from the NIST library and quantified as equivalents from the internal standard γ-hexalactone.
2.4. Sensory Analysis
2.4.1. Modification to the Pivot© Profile Method and Selection of Sensory Attributes
Pivot© Profile rapid descriptive sensory analysis was performed as described previously [31] using the RedJade sensory software (RedJade, Pleasant Hill, CA, USA). For each attribute, multiple choice options included “more than the Pivot©” and “less than the Pivot©”, which corresponded to the number “1” and “0” so that each response could be collected in binary.
Attributes and standard references were selected prior to the panel assembled by a group of five highly experienced tasters with extensive experience in wine sensory analysis. On the day of the panel, panelists were given the option to eliminate, add, or modify any attributes before testing if these putative modifications were decided by consensus. Attributes and standard references included color hue, color saturation, orthonasal aromas, tastes, mouthfeel characteristics, and tactile sensations. The project received California Polytechnic State University Institutional Review Board (IRB) approval (IRRB Protocol # 2020-058).
2.4.2. Panel Training
Training consisted of a 2.5 h session, within which panelists were exposed to sensory standards (Supporting Information Tables 4 and 5) and one replicate of each treatment of wines, including the Pivot©. The PD and PO treatments were selected as the Pivot© for Pinot noir and Petite Sirah, respectively. This decision hinged upon the fact those cap managements are generally the typical ones applied to each varietal in commercial winemaking. During training, the evaluation of color was conducted separately in clear, International Organization for Standardization (ISO) glasses while all other attributes were assessed using black glasses to mask any variation in color among treatments. Testing and evaluation procedures were explained to the panelists at this time. The 6-n-propylthiouracil (PROP) sensitivity was assessed following a previously described procedure [32]. Panelists were screened for color perception deficiencies with “Ishihara maps” of pseudoisochromatic color testing plates. The Pinot noir panel consisted of 14 (n = 14) wine professionals (10 males and 4 females, aged 21–60). Of these panelists, 93% were PROP tasters, and 7% were nontasters, with 14% of them identified as having color deficiencies. The Petite Sirah panel consisted of 10 (n = 10) wine professionals (6 males and 4 females, aged 21–60). Of these panelists, 80% were PROP tasters and 20% were nontasters, with 30% of them identified as having color deficiencies.
2.4.3. Panel Testing
Formal sensory analysis was conducted in individual sensory booths. All color evaluations including hue and saturation were performed under lights set to daylight setting (Luna 3, 26:26W, Zaniboni Lighting, Clearwater, FL, USA) in clear, ISO glasses labeled with 3-digit random codes, filled with 30 mL of wine. All aroma, mouthfeel, and taste attributes were evaluated under red light (Luna 3AO, 18:18W, Zaniboni Lighting, Clearwater, FL, USA) in similar clear, pear-shaped ISO glasses with 3-digit random codes, also filled with 30 mL of wine. Testing was separated by replicate, which resulted in three sessions assessing color, and three sessions assessing aroma and mouthfeel characteristics. Each test included five pairs of wines, one being a Pivot© sample, and one being a treatment wine to compare with the Pivot©. Panelists were asked to expectorate all samples and rinse their mouth with water as needed (Fiji, The Wonderful Company, Los Angeles, CA, USA). Nabisco premium unsalted crackers (Nabisco, East Hanover, NJ, USA) were provided for pallet cleansing.
2.5. Data Analysis
Plots of sugar consumption in °Brix, temperature, and ORP evolution, and time-course extraction of phenolic compounds during winemaking and aging were produced using Graphpad Prism software 10.3.0 (Graphpad, La Jolla, CA, USA). Moving averages of ORP were calculated with a 0th order smoothing polynomial and averaging of 500 neighboring data points on each side, using Graphpad Prism software 10.3.0. A one-way analysis of variance (ANOVA) was conducted (p < 0.05) on the basic chemical composition, phenolic composition, and volatile chemistry of the different treatments within each varietal. Sensory data analysis was conducted based on previously described procedures for Pivot© Profile [33]. The binary data of “more than pivot” and “less than pivot” were used to complete an additional test known as Fisher’s exact test (p < 0.05), which determined what attributes within treatments were determined to be significantly greater than or less than the Pivot©. XLSTAT 2023.3.1 (Addinsoft, Version 2023.1414, Paris, France) was used to complete all statistical analyses. Sensory data were analyzed via principal component analysis (PCA) using the correlation matrix with no rotation was applied to sensory dataset, including the replicates, using R software Version 3.4.0 (R Development Core Team 2021, Vienna, Austria). Confidence ellipses indicating 95% confidence intervals were based on the multivariate distribution of Hotelling’s test for p < 0.05 and were constructed using the SensoMineR panellipse function of R as described previously [34].
3. Results and Discussion
3.1. Alcoholic Fermentation and Evolution of ORP in Selected Treatments
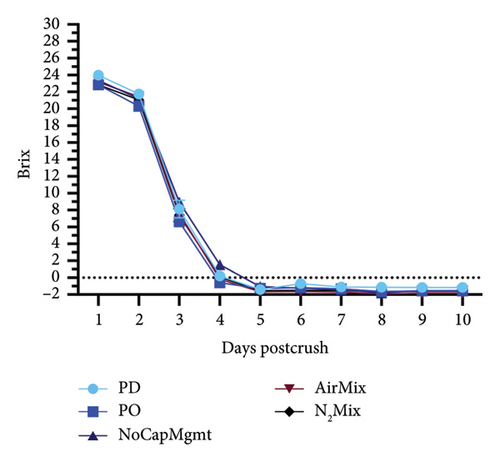
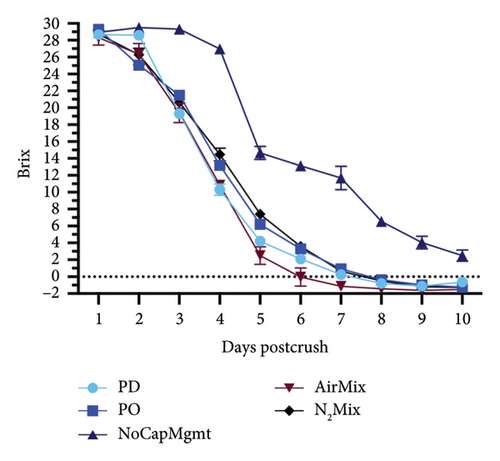
The impacts of five contrasting cap management treatments on the alcoholic fermentation kinetics, and ORP evolutions in selected treatments are shown in Figures 3 and 4, respectively. These data illustrated a portion of the effects of physical mixing and air exposure to wines during this critical stage of winemaking. For Petite Sirah wines, NoCapMgmt wines stood as an outlier, being the only treatment showing an extended lag phase and sluggish fermentation in this varietal. Nonetheless, alcoholic fermentation was completed before bottling, as these wines reached 2.85 g/L of residual sugars 78 days after yeast inoculation. Contrastingly, AirMix wines reached 0°Brix 2 days faster than the next earliest treatment in Petite Sirah wines, again highlighting the previously discussed effects of oxygen exposure on yeast performance and sugar consumption [14, 15]. In the case of Pinot noir, however, all treatments completed alcoholic fermentation at nearly identical rates. These contrasting results between the two varietals highlighted that air additions and physical mixing as performed herein may be particularly important in high Brix fermentations (> 26 initial °Brix) as was the case in the Petite Sirah wines of the present study.
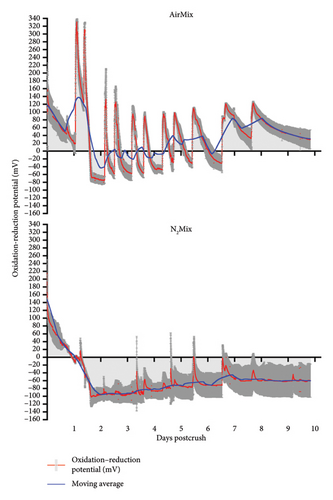
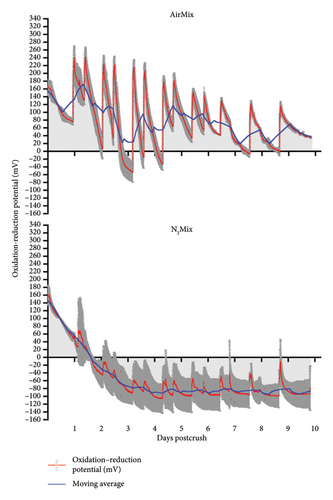
The ORP of AirMix and N2Mix wines were recorded continuously throughout alcoholic fermentation/maceration and showed distinctly different redox profiles during this period (Figure 4). ORP oscillated between 120 and 200 mV immediately after crushing in both varietals. Following yeast inoculation, ORP values steadily declined to approximately −100 mV in N2Mix wines and to near or below 0 mV in AirMix wines, with subsequent air additions causing rapid increases to peak ORP values. The most rapid declines in ORP in both N2Mix and AirMix wines were chronologically aligned with the maximum rate of sugar depletion. Initial AirMix additions resulted in peak ORP values of roughly 340 mV and 240 mV in Pinot noir and Petite Sirah wines, respectively. These peak values were not observed again in either varietal during alcoholic fermentation, as peak heights declined along with the progression of this process. This occurred despite the flow rate and duration of air additions remaining constant. In AirMix treatments in both varietals, approximately 80% or more of the total increase in ORP observed across the hour-long air sparge typically occurred within 15 min of beginning air injections, followed by a plateau or slight increase for the remainder of the addition. This ORP evolution during air additions evidenced what may occur when a surplus of oxygen is available, such as during the air mixing treatments. In this case, the upper limit of ORP values may be determined by the oxidation buffering capacity of a wine based on its phenolic composition [35], the depletion of oxygen-reactive compounds including Fe2+ and its complexes which act as the limiting reagent of wine oxidation, and a major component in oxidation–reduction reactions in wine [18, 36]. Future research on the evolution of ORP during alcoholic fermentation/maceration could benefit from measuring the redox couple glutathionedisulfide/glutathione (GSSG/2GSH), as well as Fe+2/Fe+3 and Cu+1/Cu+2 content (and their complexes) to gain further insights into the cause of variations in ORP evolution observed between varietals [37–39].
Although N2 gas is indeed inert and, therefore, does not participate in redox reactions, very small peaks were observed in N2Mix wines coinciding with the time in which N2 mixing was initiated. We speculate that these peaks may be due to local decreases of temperature caused by the room-temperature gas cooling the fermenting must and thus raising the ORP in accordance with the Nernst equation [19]. These results evidence the extreme sensitivity of the ORP probes described herein to even minor changes in the medium.
3.2. Basic Chemistry of the Wines
A one-way ANOVA was conducted on the basic chemistry of Pinot noir and Petite Sirah wines at selected time points during winemaking and aging (Supporting Information Table 6). At pressing, the acetaldehyde content was the highest in N2Mix and NoCapMgmt wines (i.e., the wines that received the least amount of oxygen during alcoholic fermentation) and lowest in AirMix and PO wines (i.e., which received the most oxygen during alcoholic fermentation). Although still below its odor detection threshold, acetaldehyde levels increased by 465% and 510% in NoCapMgmt wines relative to AirMix wines at pressing in both Pinot noir and Petite Sirah wines, respectively. Meanwhile, AirMix wines had roughly double the acetic acid content at pressing when compared to all other treatments in both Pinot noir and Petite Sirah wines (Supporting Information Table 6). This doubling of acetic acid in AirMix wines was likely due to an increased proliferation of aerobic acetic acid bacteria, which is likely the result of the abundant availability of oxygen in these wines [40]. In both varietals, wines that received more oxygen (i.e., AirMix and PO) had the most rapid reductions in malic acid between malolactic bacteria inoculation and pressing (Supporting Information Table 6).
The increase in acetaldehyde in treatments exposed to the least amount of oxygen appears counterintuitive, as, in finished wines, acetaldehyde is an oxidation product of ethanol [41]. However, the spontaneous accumulation of acetaldehyde due to the chemical oxidation of ethanol in wine-like conditions has been reported as unlikely to occur as simply linked with the presence of oxygen [36]. Alternatively, oxidation reactions in the presence of ethanol were previously suggested to produce the hydroxyethyl radical, which subsequently results in an array of oxidation products, with acetaldehyde being one potential fate of this radical [36]. In the conditions of the present study, we propose that the heightened acetaldehyde levels in treatments with minimal oxygen exposure may be the result of varying degrees of biological activity. This can be attributed to the unique conditions resulting from the treatments of the present study as follows. The presence of free SO2 during alcoholic fermentation inhibits the enzyme alcohol dehydrogenase (ADH) produced by Saccharomyces cerevisiae, which reduces intermediate acetaldehyde into ethanol [42]. This will lead to an accumulation of acetaldehyde, which will become bound to sulfites in the must. Although in the present study SO2 was not monitored during alcoholic fermentation, we speculate that free SO2 in the more oxidative treatments (AirMix and PO) will be near 0 mg/L due to SO2 depletion mediated by oxygen [37]. Following the conclusions of Frivik and Ebeler [42], this will mean the least inhibition of ADH and greatest ability of yeast to metabolize acetaldehyde into ethanol. In other words, fermentation management treatments that allow sufficient, or even excess of oxygen contact with the must, will allow for a healthier yeast metabolism, eventually leading to a comparatively lower concentration of acetaldehyde at the end of alcoholic fermentation.
3.3. Phenolic Composition of the Wines
The phenolic composition of the wines was uniquely affected by the dynamics of physical mixing and air exposure that varied between treatments, as well as by the inherent differences between Pinot noir and Petite Sirah, as detailed in the following. Figure 5 shows the evolution of anthocyanins (I), tannins (II), polymeric pigments (III), and total phenolics (IV) throughout winemaking, aging and accelerated aging. A one-way ANOVA was conducted within each varietal to analyze the anthocyanin, tannin, polymeric pigment, and total phenolic composition of wines made with each treatment (Supporting Information Table 7). When comparing AirMix wines to PD wines of both varietals together, AirMix wines showed reductions of 45% in anthocyanins, 46% in tannins, and 46% in total phenolic contents at pressing. These differences were further emphasized by color measurements at visible wavelengths (Supporting Information Figure 2), which distinctly identified AirMix wines of both varietals as displaying noticeably less color. While the AirMix treatment was by design an extreme protocol, that is, based upon injecting an amount of air that would arguably not be desirable in a commercial setting, examining such extremes provided insights into the comparative effects of more moderate treatments. Other than the results discussed in AirMix wines, the remaining treatments largely resulted in minor differences in anthocyanin, tannin, polymeric pigment, and total phenolic content of Petite Sirah wines. On the other hand, Pinot noir wines made with PD and N2Mix mixing protocols showed a higher total phenolic content than all other treatments at pressing (p < 0.0001). These results evidenced that the inherently low phenolic composition of Pinot noir [2, 3] may make it more sensitive to these cap management treatments than Petite Sirah, when considering extraction of these phenolic groups during maceration.
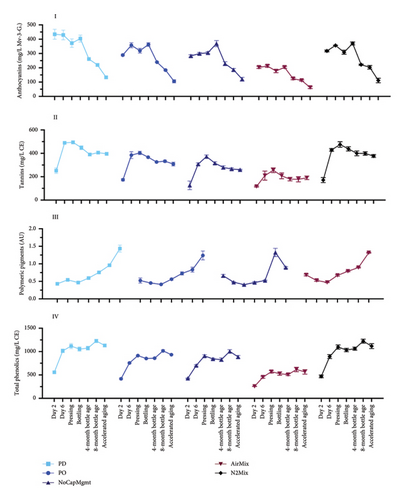
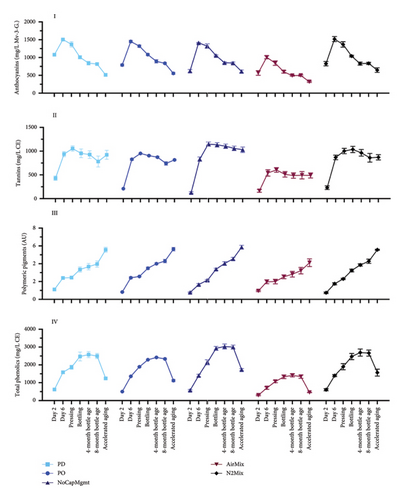
Accelerated aging of the wines was undertaken to understand the evolution of phenolic classes under conditions that may be equivalent to about 2 years of bottle aging [26]. Under accelerated aging conditions, the polymeric pigment content increased by at least 105%, while anthocyanin content was reduced to at most 66% of the concentrations at pressing among all treatments of both varietals. More modest decreases in tannin ranging from 10% to 30% occurred across the same time frame, suggesting these compounds formed polymeric complexes possibly with anthocyanins, leading to the formation of polymeric pigments [43]. It should be noted that while no statistical difference was found in polymeric pigments between Petite Sirah treatments at pressing, AirMix wines showed lower concentrations of these compounds after accelerated aging, suggesting a comparative lack of precursor compounds required for long-term the formation of polymeric pigments. This effect was not observed in Pinot noir wines.
Overall, the cap management treatments produced relatively similar results in these phenolic classes among PD, PO, NoCapMgmt, and N2Mix wines of both varietals. In the case of NoCapMgmt and N2Mix wines, extraction appeared similar or even exceeded that of traditional cap management treatments (i.e., PD and PO), suggesting that mixing through PO or PD may have a lesser impact on color and tannin extraction than was anticipated, at least in the context of the tank volume and geometry of the fermentors of the present study. A previous study on the effect of contrasting cap management protocols in Cabernet Sauvignon equally reported that sufficient phenolic extraction was achieved under conditions of minimal or NoCapMgmt [10]. This was ascribed to a pseudopressing effect on the cap resulting from the combined effects of atmospheric pressure acting downward on the cap and CO2 production of the fermentation acting upward. This effect, aided by the convective mixing resulting from the fermenting must, will most likely occur in a vessel of favorable size and dimensions and under sufficient temperature to allow convection to occur within the fermentor [10].
While the pseudopressing effect may explain phenolic extraction during fermentation in fermentors of specific geometry and size, the observed rise in total phenolics in Petite Sirah at 4 months of bottle aging (relative to their content at pressing) has not been reported before (Figure 5). This suggest that other phenolic classes not measured here may have been formed in the period between pressing, bottling and subsequent bottle aging. Whereas tannins remained stable in this period and may not explain this rise, polymeric pigments increased, which may have contributed to the rise. Phenolic release from previously bound forms during winemaking has been previously reported [44] and this may partially explain this rise in total phenolics in Petite Sirah wines.
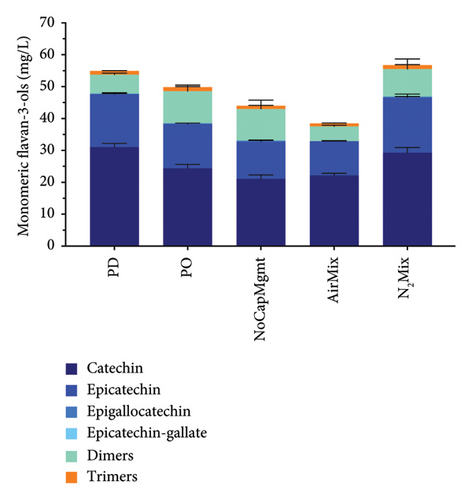
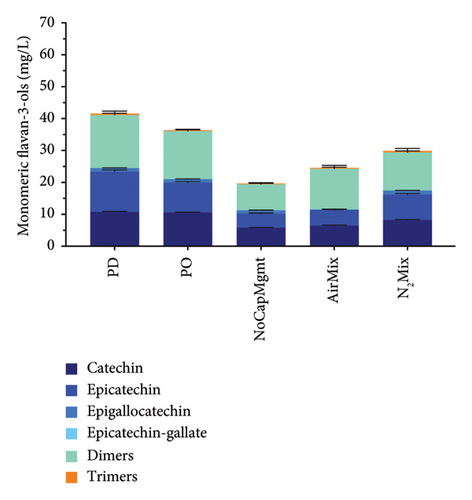
Anthocyanins, anthocyanin-derived pigments, polymeric pigments, flavonols, and monomeric flavan-3-ols were as well measured at selected time points during winemaking and aging (Figure 6; Supporting Information Figures 3 and 4; and Supporting Information Table 8). A quite contrasting anthocyanin composition was seen especially between the two varietals but also between treatments within varietals. For example, Pinot noir wines showed the typical lack of acylated anthocyanins [45, 46], while Petite Sirah wines contained measurable amounts of acylated anthocyanins. Acylated anthocyanins were lower in AirMix Petite Sirah wines after 8 months of bottle aging, when compared with all other treatments (p < 0.0001). This chemical variation between treatments may explain the decrease in purple hue of AirMix Petite Sirah wines, as also supported by spectrophotometric analyses (Supporting Figure 2) and as shown later by sensory analyses (Supporting Information Tables 9 and 10). Furthermore, analysis of flavonols highlighted notable differences in concentration and composition between the two varietals. In Petite Sirah wines, quercetin-based compounds constituted 27% of the total flavonols, compared with 48% in Pinot noir wines, across all treatments. AirMix treatments showed significantly reduced total flavonol concentrations (p < 0.0001) compared with all other treatments in both varietals, while no significant differences were observed among the remaining treatments at a 95% confidence level (Supporting Information Table 8).
The above data consistently outline the significant reductions in most phenolic classes in AirMix wines of both varietals. Previous research has shown that additions of 25 mg/L of SO2 are insufficient for the inhibition of polyphenol oxidases (PPOs) in grape musts, while additions of 50 mg/L of SO2 were successful [47]. It is, therefore, possible that the 35 mg/L addition of SO2 upon crushing in the present study was not sufficient to prevent the enzymatic oxidation of phenolics by PPO during the early stages of alcoholic fermentation in conditions of excess oxygen, as in the AirMix wines. This may explain the reductions in most phenolic classes in AirMix wines as outlined herein.
Unlike many of the already discussed phenolic groups, monomeric flavan-3-ol, dimers, and trimers at 8 months of bottle aging (Figure 6) showed reduced extraction in NoCapMgmt wines when compared with PD and N2Mix wines in both varietals, as well as PO wines in Petite Sirah. In contrast, PD wines showed the highest concentrations of catechin and epicatechin, exceeding PO wines by 24% and NoCapMgmt wines by 45% in Pinot noir, while in Petite Sirah, exceeding these same treatments by 17% and 228%, respectively. While skins indeed contain monomeric flavan-3-ols, these compounds are mostly located in the seeds [5]. Because two-thirds of the cap is typically lifted out of the liquid by CO2, a large quantity of these seeds would likely not be submerged nor actively releasing phenolic compounds into the wine in circumstances of minimal physical mixing and disturbance of the cap, as in NoCapMgmt wines. The dislodging and subsequent plunging of seeds as a result of greater physical mixing may be more influential on the extraction of monomeric flavan-3-ols found in seeds than the extraction of anthocyanins and high molecular weight tannins found in the skins as follows. Previous research has concluded that extraction patterns of phenolic compounds from seeds are unaffected by local concentrations, while the chemical gradients of skin phenolics typically reached saturation near the cap ∼8 h after POs [6], suggesting dependance on local concentrations. It can, therefore, be concluded that the plunging of seeds to the bottom of the fermentor caused by physical mixing may directly increase extraction of seed contents in correlate with the quantity of seeds in the liquid. However, in the case of skin phenolics, local saturation may limit extraction to that which is seen in the relatively similar results of anthocyanins, tannins, total phenolics of PD, PO, NoCapMgmt, and N2Mix wines described herein. However, such a hypothesis may have to be analytically confirmed in future work. In addition, because flavan-3-ols are known bitterants [48], our results suggest there is the potential for heightened extraction of these compounds in Pinot noir wines under conditions of aggressive physical mixing, as supported by previous research showing increased bitterness with increased frequency of PDs in Cabernet Sauvignon wines [10].
Notably, Pinot noir wines, regardless of treatment, exhibited significantly higher total flavan-3-ol concentrations (p < 0.0001) and more than triple the catechin levels of Petite Sirah wines, despite the latter containing roughly double the total phenolic concentrations across all treatments (Figure 6).
3.4. Volatile Aroma Composition of the Wines
Selected volatile compounds were determined in both varietals after 8 months of bottle aging and their respective odor activity values (OAVs) were calculated by using corresponding odor threshold values reported previously [49–54] (Supporting Information Table 11). In both varietals, NoCapMgmt wines showed the highest ester concentration, including isoamyl acetate (p = 0.0002), ethyl hexanoate (p = 0.022), and ethyl n-octanoate (p = 0.0001) relative to the remaining treatments. It is possible that in NoCapMgmt wines, a lack of physical mixing, and, therefore, minimal purging of CO2 lead to comparatively less stripping of esters mediated by CO2 release [55]. This effect, combined with reduced or absent dissolved oxygen during alcoholic fermentation, likely contributed to the greater ester concentrations observed in NoCapMgmt wines [56]. Conversely, the sum of all terpenes showed increased concentration in AirMix Petite Sirah wines when compared to all other treatments, and in AirMix Pinot noir wines when compared to all treatments other than PD wines (Figure 7). However, in both Pinot noir and Petite Sirah, the OAVs of all terpenoids measured were below 1, other than β-ionone due to its exceedingly low odor threshold of 0.09 μg/L [49]. OAVs below 1 indicate that these compounds were too low in concentration to be perceived sensorially and are unlikely to contribute significantly to the overall aroma profile of the wines.
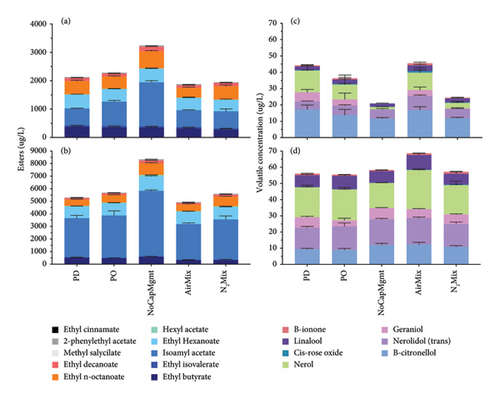
The most aromatically active compounds, correlating with the highest OAVs, were ethyl n-octanoate and isoamyl acetate in both varietals. In NoCapMgmt wines, ethyl n-octanoate exhibited OAVs of 121 in Pinot noir and 186 in Petite Sirah, the highest recorded across treatments. Conversely, the lowest OAVs for ethyl n-octanoate were observed in AirMix wines of Pinot noir (OAV = 69) and PD wines of Petite Sirah (OAV = 103).
Similarly, isoamyl acetate demonstrated substantial sensory relevance, with OAVs in Pinot noir ranging from 20 (AirMix, PD, and N2Mix) to 52 (NoCapMgmt) and in Petite Sirah ranging from 95 (AirMix) to 174 (NoCapMgmt). These results emphasize the significant contribution of these esters to the aromatic profile of both varietals.
Notably, among odor-active compounds (OAV > 1), the only instance of a treatment resulting in a significantly greater OAV than NoCapMgmt wines was regarding ethyl isovalerate of Petite Sirah wines, where AirMix wines (OAV = 10) exceeding NoCapMgmt wine (OAV = 7) (p = 0.0004). Additional odor-active compounds included ethyl butyrate, ethyl hexanoate, ethyl cinnamate, hexyl acetate, ethyl decanoate, and β-ionone, which further contributed to the aromatic profiles of the wines (Supporting Information Table 11). These results underscore the influence of cap management on active volatile concentrations and suggest potential practices that may increase final ester concentration if these effects are proven to be scalable in future research.
3.5. Sensory Analysis by Pivot© Profile
Pivot© Profile is a qualitative sensory method that uses an expert panel, whereby each sample is compared to a control (Pivot©) and the sample wine is categorized as less than or more than the Pivot© regarding predetermined sensory characteristics. In the present work, the wines chosen to act as Pivot where the PD treatment and PO treatments for Pinot noir and Petite Sirah, respectively, as these are the cap management regimes most regularly used in the production of each varietal. Results of the modified Pivot© Profile descriptive analysis and Fisher’s exact test (p < 0.05) are shown in Supporting Information Tables 9 and 10, for Pinot noir and Petite Sirah, respectively. In addition, PCA plots describing the sensory analysis results of Pinot noir and Petite Sirah wines are shown in Figure 8 and displayed color-coded confidence ellipses surrounding each treatment name, which identified significant sensory attributes of each respective treatment with 95% certainty. An overlap of a confidence ellipse with the ellipse of another treatment signified a lack of statistically significant difference in the respective treatments. Conversely, an ellipse that did not overlap a neighboring ellipse signified a statistical difference.
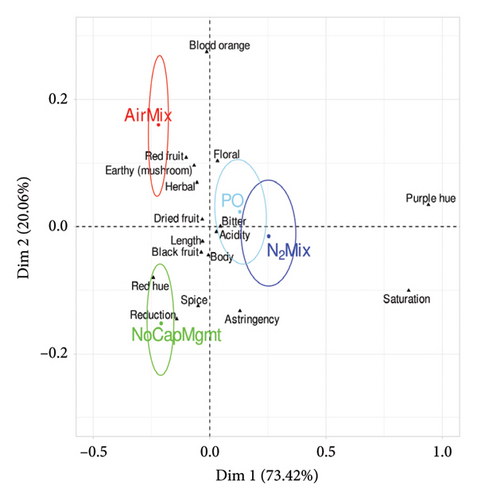
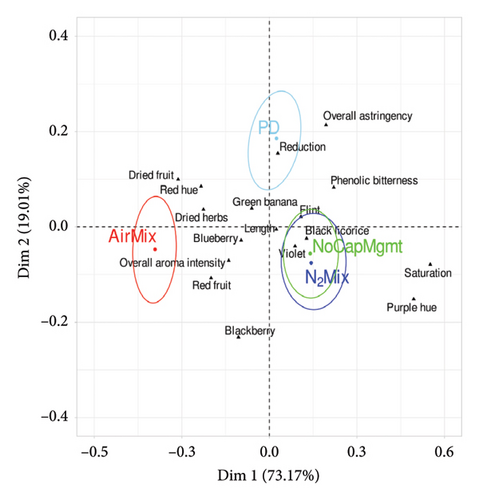
Contrasts between the PO and PD cap managment regimes were less pronounced than comparisons of N2Mix, AirMix, or NoCapMgmt, with the only significant effects being that of PO wines having an increase in purple hue in Pinot noir wines (p = 0.001), and an increase in blackberry aroma (p = 0.004) and astringency (p = 0.008) in Petite Sirah wines relative to PD wines. AirMix wines of both varietals had reduced color saturation (p < 0.0001), purple hue (p < 0.0001), and astringency (p = 0.018 in Pinot noir and p = 0.003 in Petite Sirah) but were higher in red fruit aroma (p = 0.043 in Pinot noir and p = 0.009 in Petite Sirah) when compared with the Pivot© of each respective varietal. In addition, AirMix wines showed less bitterness (p = 0.008) in Petite Sirah. The reductions in perceived color and astringency in AirMix wines align with their previously described phenolic compositions, as this treatment produced wines with just 50% and 54% of the total phenolics measured in PD treatments in Pinot noir and Petite Sirah, respectively. In contrast, N2Mix wines showed increased color saturation (p < 0.0001 in Pinot noir and p = 0.014 in Petite Sirah) and purple hue (p < 0.0001 in Pinot noir and p = 0.001 in Petite Sirah). Similarly, NoCapMgmt wines showed higher perceived color saturation than the Pivot© in both varietals (p = 0.001 in Pinot noir and p = 0.02 in Petite Sirah). These results on color and saturation were well supported by full spectrum scans of the wines (Supporting Information Figure 2).
Contrary to these differences in color, the effects of these treatments on reduction aroma were relatively subtle among treatments with the exception of the NoCapMgmt wines. Previous research has suggested that the production of H2S, which is a key compound in reduction aromas, may be expected in wines produced with an ORP reaching values near −100 mV [21, 23] such as that of the N2Mix wines of both varietals. However, reduction aromas were not perceived in the present study in either varietal of this treatment. Although the minimal oxygen exposure during the production of NoCapMgmt wines was likely similar to N2Mix wines, NoCapMgmt wines of Pinot noir were perceived as having more reduction than the Pivot© (p = 0.006). This outcome may be explained by past studies showing repeated cycles of N2 mixing to be an effective tool in reducing concentrations of the VSCs H2S and methanethiol in wine; an effect attributed by the researchers to purging [25]. We herein speculated that the N2Mix treatment physically stirred any highly compacted lees at the bottom of the ferment, lowering the production of H2S. In addition, it can also possible that the injections of N2 were sufficient to displace dissolved CO2, increasing the volatile stripping/purging effect on H2S caused by CO2 degassing [25, 55]. Further studies could benefit from measuring ORP in the lees of a fermentation, as well as in the juice to potentially identify the need for lees stirring or gas mixing during maceration.
The previously described increase in ester concentration of NoCapMgmt wines of both varietals (Figure 7) may suggest that an increase in fruit aroma in these wines is to be expected. However, it is likely that the presence of VSCs and reductive aromas in Pinot noir (and even subthreshold levels in Petite Sirah) may have effectively reduced the perceived fruit character of NoCapMgmt wines, thereby explaining the present sensory results.
4. Conclusions
The present study investigated the chemical and sensory effects of selected cap management protocols, namely, POs, PDs, NoCapMgmt, AirMix, and N2Mix including aspects related to fermentation kinetics, chemical, phenolic, and volatile composition, as well as sensory attributes of Pinot noir and Petite Sirah wines. In addition, by measuring the evolution of the ORP throughout alcoholic fermentation of AirMix and N2Mix wines, we show for the first time how these putatively highly oxidative and reductive environments, respectively, shape the ensuing wine composition and sensory outcomes.
Differences between PD and PO wines were relatively minor in regards to fermentation kinetics, concentrations of anthocyanins, color, volatile compounds, and sensory outcomes in both Petite Sirah and Pinot noir wines. However, PD wines of both varietals contained 44% and 118% more monomeric flavan-3-ols when compared with NoCapMgmt wines of Pinot noir and Petite Sirah, respectively. This highlights the crucial role of physical mixing and cap disturbance on the extraction of these bittering phenolic compounds as a consequential sensory outcome that may not be identified in broader measurements of total phenolic compounds.
Wines made with nontraditional cap management protocols such as NoCapMgmt, AirMix, and N2Mix each produced distinctive, and in some cases, desirable chemical and sensory outcomes that were not seen to the same extent in PD and PO wines. Wines of these treatments were produced following protocols that could drastically decrease the necessary human labor hours required during alcoholic fermentation, especially in cases in which automation can be incorporated into gas mixing protocols. When compared with all other treatments, NoCapMgmt wines retained higher concentrations of esters, possibly due to the minimal mixing and degassing of the wine, resulting in greater retention of these volatile compounds. NoCapMgmt and N2Mix resulted in wines with higher color saturation in both varietals. AirMix wines showed reduced bitterness in Petite Sirah and reduced astringency and increased red fruit character in both varietals. Indeed, the fruit character expected from the higher ester content of NoCapMgmt wines was plausibly masked in both varietals by the putative presence VSCs, as supported by sensory results. The increased perceived fruit character in AirMix wines suggests that air additions during alcoholic fermentation, applied at comparable rates as those herein instituted, could be used as a tool to soften astringency and reduce reduction aromas, while increasing the perceived fruit character, for example, in early-to-market wine styles. While these outcomes may be desirable for certain wine styles, a more controlled amount and timing of air injections may yield similar results in regard to aromatics and fermentation kinetics by controlling ORP and optimizing yeast performance [15, 21, 22], while limiting the detrimental losses in phenolics shown herein.
N2Mix wines showed little to no sign of VSCs in sensory analysis, despite this treatment reaching ORP values of −100 mV for extended periods of time in both varietals. These results imply that repeated N2 injections during alcoholic fermentation, done to the extent herein described, may reduce the production and retention of VSCs to a degree that they are not sensorially detectable in the finished wine, an outcome attributed to physical mixing of the lees and volatile stripping through CO2 degassing. Lastly, future studies would benefit from expanding the use of ORP measurements, to include PD and PO wines, as the present sensory results alluded to PD wines likely having experienced a reductive alcoholic fermentation. As previously noted, AirMix and N2Mix protocols afford the potential to significantly reduce the need for labor hours required for cap management. Indeed, these are protocols that may be fully automated or executed with far less labor than most PD or PO procedures demand, likely at much lower cost than automated POs.
In summary, the present results provide tools and cap management protocols, including ORP control, for optimizing yeast performance during alcoholic fermentation, while managing phenolic, volatile, and sensory outcomes of Pinot noir and Petite Sirah. These results can be applied to achieve stylistic goals in the production of these varietals.
Conflicts of Interest
The authors declare no conflicts of interest.
Funding
No external funding was used for this project. Star Lane and Dierberg Vineyards, LLC (Santa Ynez, CA, USA), E. & J. Gallo Winery (Healdsburg, California, USA), and Treasury Wine Estates (St. Helena, California, USA) are thanked for their donation of fruit and logistical support, respectively.
Acknowledgments
Star Lane and Dierberg Vineyards, LLC (Santa Ynez, CA, USA), E. & J. Gallo Winery (Healdsburg, California, USA), and Treasury Wine Estates (St. Helena, California, USA) are thanked for their donation of fruit and logistical support, respectively.
Supporting Information
Supporting Figure 1: Temperature during alcoholic fermentation/maceration of Pinot noir and Petite Sirah wines made with varying cap management protocols.
Supporting Figure 2: Full visible absorption spectrum scans of Pinot noir and Petite Sirah wines produced with various cap management protocols, measured at selected time points of winemaking and bottle aging.
Supporting Figure 3: Detailed anthocyanin composition of Pinot noir and Petite Sirah wines made with various cap management protocols, measured at selected time points of winemaking and bottle aging.
Supporting Figure 4: Detailed flavonol composition of Pinot noir and Petite Sirah wines made with various cap management protocols, measured at selected time points of winemaking and bottle aging.
Supporting Table 1: Basic juice chemistry of Pinot noir and Petite Sirah grapes on the day of harvesting.
Supporting Table 2: Berry composition of Pinot noir and Petite Sirah grapes on the day of harvesting.
Supporting Table 3: Calibration of internal standards used for the quantification of selected volatile aroma compounds measured by GC/MS using pure standards (> 95%).
Supporting Table 4: Detailed composition of the sensory standards used during the Pivot© Profile training and formal evaluation sessions of Pinot noir wines.
Supporting Table 5: Detailed composition of the sensory standards used during the Pivot© Profile training and formal evaluation sessions of Petite Sirah wines.
Supporting Table 6: One-way analyses of variance (ANOVA) of the basic chemical composition of Pinot noir and Petite Sirah wines produced with various cap management protocols.
Supporting Table 7: One-way analyses of variance (ANOVA) of the anthocyanin, tannin, polymeric pigment, and total phenolic composition of Pinot noir and Petite Sirah wines made with varying cap management treatments, at selected time points during winemaking and bottle aging.
Supporting Table 8: One-way analyses of variance (ANOVA) of the flavan-3-ol, flavonol, anthocyanin, and pigment compositions of Pinot noir and Petite Sirah wines made with varying cap management treatments after 8 months of bottle aging.
Supporting Table 9: Results of Fisher’s exact test comparing Pivot© Profile sensory analysis results of Pinot noir wines made with various cap management protocols.
Supporting Table 10: Results of Fisher’s exact test comparing Pivot© Profile sensory analysis results of Petite Sirah wines made with various cap management protocols.
Supporting Table 11: One way analysis of variance (ANOVA) of odor activity values (OAVs) of the volatile composition of Pinot noir and Petite Sirah wines made with varying cap management protocols and odor threshold concentrations used to calculate OAV.
Open Research
Data Availability Statement
The data supporting the findings of this study are available within the article and/or its Supporting materials.


