Environmental and Management Factors Affecting Greenhouse Gas Fluxes From Soils in Mixed Crop–Livestock Systems: A Meta-Analysis
Abstract
Recent studies have suggested that diversified cropping systems integrating crop and livestock operations can enhance food production while reducing inputs and environmental impact. Nevertheless, the effect of integrated or mixed crop–livestock systems (MCLSs) on soil greenhouse gases (GHGs) emission, specifically nitrous oxide (N2O), methane (CH4), and carbon dioxide (CO2), and the moderating variables influencing them have not been comprehensively examined across diverse regions and management scenarios. Here, we conducted a meta-analysis of 21 independent MCLS studies comparing soil GHG fluxes from croplands of MCLSs with fluxes from croplands within purely arable systems. Our results revealed that the primary moderating variables of GHGs emissions (CO2, N2O, and CH4) from MCLS were, in descending order of importance: drainage class, stocking density, climate, amount of N fertilizer, fertilizer type, soil texture, crop type, tillage, livestock type, and MCLS type. However, differences in CO2 emissions within categories of stocking density, climate, crop type, livestock type, tillage, and N fertilizer amount and type were not significantly affected by MCLS. Additionally, drainage classes, stocking density, climate, soil texture, and amount and type of nitrogen (N) fertilizers emerged as the primary contributors to both N2O and CH4 emissions. Maximum emissions of N2O, CH4, and CO2 were recorded from sand (38%), clay (33%), and sand (36%) soils, respectively. Conservation tillage (CST), sheep, cereals, and forage rotation systems were also identified as significant factors in increasing GHGs emissions. In conclusion, our meta-analysis provides the first comprehensive assessment of the response of three major soil GHGs emissions to MCLS and demonstrates the need for further investigation into moderating variables under which MCLS can be sustainably intensified.
1. Introduction
Anthropogenic climate change is primarily driven by the emission of various greenhouse gases (GHGs), with carbon dioxide (CO2), methane (CH4), and nitrous oxide (N2O) being the three most significant contributors to global warming [1]. Among anthropogenic activities, agricultural practices contribute about 25%–30% of global GHG emissions [2]. This reveals the importance of sustainably intensifying agricultural production approaches, particularly integrated or mixed crop–livestock systems (MCLSs), in emitting or mitigating GHGs emissions.
The MCLS represents an agricultural approach that combines crop and livestock production activities to harness advantages arising from the ensuing interplay between crops and livestock [3]. The rationale behind integrating these activities is to generate resources that can be strategically utilized to enhance the overall efficiency, productivity, and sustainability of this integrated farming system [4]. These resources manifest in various forms, including feed biomass (such as crop residues and forages), manure, power (utilizing animals for draught and transportation), and cash (generated from crop sales, facilitating the acquisition of animals, or derived from selling animals to invest in crop production). Hence, in this paper, the term MCLSs denote crop and livestock that are spatially integrated, that is, the incorporation of grazing animals into cropland or the integration of crops into grazed systems. Conversely, arable systems (control) are used to describe croplands within purely arable farms that are neither grazed nor subjected to manure application.
Various integrated crop–livestock systems exhibit diverse levels of integration between crops and livestock, accompanied by varying volumes of external inputs and outputs. For instance, certain farms achieve the highest level of integration, where the predominant share of fodder for livestock is cultivated on cropland, and all generated manure is returned to the cropland. On the other hand, there are farms characterized by a medium level of integration, where less than 50% of the livestock feed is produced on the farm (with over 50% purchased as concentrates), but all the resultant manure is directed back to the cropland. Additionally, there exist farms demonstrating a lower level of integration, where less than 50% of the livestock feed is sourced from on-farm production, and only a portion of the manure is utilized in cropland applications. In the African context, the degree of integration typically reaches its highest level in small farm sizes and diminishes as the farm size per farmer/household increases. This pattern arises due to constraints related to the movement of manure, crop residues, and livestock. Moreover, the extent of competition for manure as a source of energy, construction material, and fertilizer can significantly influence the level of integration. For instance, prevalent and frequently default systems on smallholder farms in sub-Saharan Africa are characterized by the cut-and-carry approach and the corralling system. In the cut-and-carry approach, crop residues are harvested for use as livestock feed and livestock manure is transported to fields to enhance soil quality [5]. Conversely, in the corralling system, farmers keep their animals overnight on fallow fields between cropping seasons as a means of collecting both manure and urine directly onto the soil [6]. Nevertheless, the fundamental objectives of these systems diverge from those of commercialized systems in the Americas, as the co-localization of crop and livestock elements, which characterizes the commercial systems, is frequently lacking in smallholder settings [5]. Consequently, this study will exclusively concentrate on field-level (co-located) MCLS, a higher level of integration, thus, enabling meaningful comparisons among different MCLS modalities.
As per the findings of Peterson et al. [5], co-located MCLS, wherein the same land area is utilized for both crop and livestock production, represents one of the most ecologically complex modalities in the commercial production setting. These encompass MCLS characterized by the synchronization of crop and livestock production, such as dual-purpose crops managed for both grazing and grain production, as well as those employing strategic rotations of crop and livestock components across seasons, as seen in forage rotations and cover cropping. Through these means, co-located MCLSs promote mutualistic interaction between crops, livestock, and soil, leading to improved crop and livestock production and environmental quality [7]. MCLSs have also been shown to improve productivity per unit of land area and labor [8], shifts in soil biological, physical, and chemical properties [9, 10], water and nutrient cycling [11], and plant–soil interactions [10]. Furthermore, MCLSs have been reported to improve farm-level socioeconomics, for example, economic risk mitigation and livelihood diversification [12], crop productivity [13], and enhance climate change resilience through buffering mechanisms in field-level biophysical processes, for example, nutrient cycling [14].
Despite these benefits, the effects of MCLSs on soil GHG emissions are less clear. Previous studies on MCLSs showed an increase in emissions of N2O [15], CH4 [16], and CO2 [17], or a decrease in emissions of N2O [18], CH4 [19], and CO2 [20], and/or no effect on emissions of N2O [21], CH4 [22], and CO2 [23], with crop–livestock integration as compared to arable systems (control). The varying outcomes have been ascribed to a range of factors, though their exact nature remains uncertain at present. For example, the interplay and diversity of environmental factors (e.g., soil type and climate) and managerial choices (such as crop and livestock selection, fertilizer application, and tillage practices) have been observed to impact soil CO2, CH4, and N2O emissions. This correlation is attributed to their influence on parameters like water-filled pore space (WFPS), soil temperature, nitrate (NO3−), and ammonium (NH4+) concentrations, which, in turn, regulate N2O production via nitrification, denitrification, codenitrification, and heterotrophic nitrification [24–26], CH4 oxidation [27], and the diffusion of CO2 in soil [28, 29].
Nitrification is a microbial process involving the oxidation of NH4+ to NO3−, and it results in the emission of N2O as a by-product. This process is favored under moderate pH conditions and in well-aerated and dry soils [30]. While the N2O efflux associated with nitrification is typically a small fraction of the total nitrification nitrogen flux, it often constitutes a significant portion of overall soil N2O emissions [31]. Denitrification, occurring under anaerobic conditions, is a two-step process wherein NO3− is sequentially converted to N2O and then to dinitrogen (N2). In the denitrification pathway, obligate intermediaries include nitrite (NO2−), nitric oxide (NO), and N2O [32]. Factors such as increasing soil anoxia, labile carbon availability, NO3− availability, pH, and temperature can influence gaseous emissions, redirecting them toward more reduced forms [33, 34]. Recently, two pathways (heterotrophic nitrification and codenitrification) of N2O production linked to the soil organic nitrogen pool have gained increased attention [35]. The formation of N2O through heterotrophic nitrification is believed to involve the oxidation of organic nitrogen to NO2−, followed by its subsequent reduction to N2O [36]. Codenitrification is a process that cometabolizes organic nitrogen compounds, such as amines, to produce N2O and N2 [37]. This process entails the replacement of a hydrogen atom in an organic compound with a nitroso group (─N═O). Under near-neutral to alkaline soil pH conditions common to agricultural soils, codenitrification may occur via enzymatic catalysis with enzymatic nitrosyl compounds (E-NO+ or E-NO) attracting nucleophile compounds [37, 38]. Nucleophiles participating in codenitrification encompass hydroxylamine, NH4+, hydrazine, amino compounds, and ammonia (NH3) [39]. Regarding CH4, agricultural soils generally act as sinks for this gas. This is attributed to the process of aeration, which facilitates the oxidation of CH4 into CO2 through methanotrophy, mediated by the CH4 monooxygenase enzyme [40, 41]. Nevertheless, the presence of NH4+ could diminish the soil’s capacity to consume CH4. This is due to the competition between NH4+ and CH4 for the same active site of the monooxygenase enzyme, potentially resulting in a reduction in the methanotrophy rate [42]. The emission of soil CO2 results from the combination of autotrophic root respiration and heterotrophic microbial respiration occurring in both the rhizosphere and bulk soil, as documented by Ryan et al. [43]. Given its reliance on biological processes, the generation of soil CO2, or soil respiration, is intricately linked to factors such as soil temperature, soil moisture, vegetation, microbial activity, and seasonal variations [44, 45].
- 1.
Determine the potential of the MCLS (also called integrated systems) to mitigate N2O, CH4, and CO2 emissions from the soils in comparison to soils from purely arable systems (exclusion of manure, forage crops, and grazing).
- 2.
Identify the most significant variables associated with the three soil GHG fluxes across different MCL (integrated) system types globally.
2. Methods
2.1. Data Collection
2.1.1. Literature Search Strategy
We conducted a comprehensive literature search using Scopus (https://www.scopus.com/), ScienceDirect (https://www.sciencedirect.com/), and Google Scholar (https://scholar.google.com/) to identify peer-reviewed articles published between 1 January 2003 and 31 December 2022, that examined the GHG response of MCLSs. The last search was done in May 2023 with the keywords: (“crop-livestock ∗”) AND (“soil greenhouse gas”) OR (“methane”) OR (“CH4”) AND (“carbon dioxide”) OR (“CO2”) AND (“nitrous oxide”) OR (“N2O”) AND (“soil emission”). In total 1222 studies were identified from the database searches. We then gleaned the reference list within the selected research articles to meet our initial selection criteria (Section 2.1.2). The literature search adhered to the Preferred Reporting Items for Systematic Reviews and Meta-Analysis (PRISMA) guidelines (Figure S1) [46].
2.1.2. Study Selection Criteria
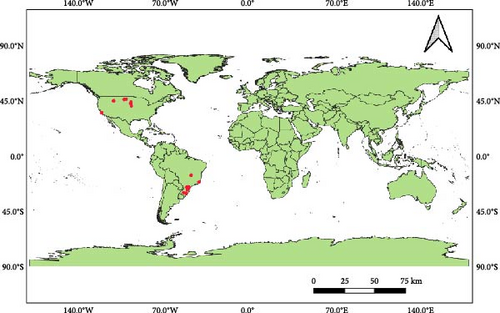
The following criteria were considered to select appropriate studies: (1) the study focused on crops and livestock that are spatially integrated (integrated systems) and have an arable (control) system, that is, croplands that are neither grazed nor subjected to manure application. Studies that focus on only crop–livestock–forest systems and livestock–grassland were excluded; (2) studies involve field experiments. Life cycle assessment studies were excluded; (3) mean cumulative/annual soil GHG (N2O, CH4, and CO2) emission(s) for both integrated treatment and control were reported or could be calculated; (4) the number of replications (n), standard deviation (SD) or when possible standard error (SE) values were available; and (5) study was original research, dataset, or dissertation, and excluded review, book chapter, or conference proceedings. A total of 99 observations, derived from 21 papers published between 2013 and 2022 across two continents (Figure 1), fulfilled our selection criteria and were subsequently incorporated into this meta-analysis (Table 1). Out of them, 20 papers reported measurements of soil N2O emission, 14 for CH4 emission, and seven for CO2 emission (Table 1). Notably, the dataset was concentrated on North America and South America (Figure 1), reflecting the higher prevalence of field-level (co-located) MCLS in both research and production sectors within these regions [5]. In contrast, MCLS practices in Africa, Europe, and Asia are commonly implemented at the farm or territory level [64–66]. While the number of observations is currently limited, we believe that conducting this study now reveals a knowledge gap that might guide future research efforts.
| Study ID | MCLS type | Author (year) | State, country | Soil GHG(s) measurements | NoB | Drainage class | Fertilizer type | N rate (kg N ha−1) | Climate | Crop(s) | Livestock | ||
|---|---|---|---|---|---|---|---|---|---|---|---|---|---|
| N2O | CH4 | CO2 | |||||||||||
| 1 | Stubble grazing | Liebig et al. (2020) [47] | ND, US | ∗ | -- | -- | 3 | Moderately well | _ | _ | Dfb | †Soybean | Cattle |
| 2 | Forage rotation | de Carvalho et al. (2022) [48] | DF, BR | ∗ | -- | -- | 2 | Poor | P2O5 | _ | Aw | †Panicum maximum–soybean–sorghum | Cattle |
| 3 | Forage rotation | Amadori et al. (2022) [49] | PR, BR | ∗ | ∗ | -- | 4 | Moderately well | Urea | 90–180 | Cfb | †Black oat–corn | Cattle |
| 4 | Cover crop grazing | Lazcano et al. (2022) [50] | CA, US | ∗ | ∗ | ∗ | 4 | Moderately well | Compost | _ | Csb | †Bell beans–cayuse oat–Grape | Sheep |
| 5 | Stubble grazing | Barsotti et al. (2013) [16] | MT, US | ∗ | ∗ | ∗ | 2 | Moderately well | Urea | 134–252 | Dfc | †Wheat | Sheep |
| 6 | Forage rotation | Bratti et al. (2022) [51] | SC, BR | ∗ | ∗ | -- | 2 | Moderately well | NPK | 0 | Cfb | †Black oat–corn–soybean | Cattle |
| 7 | Forage rotation | Christenson et al. (2021) [52] | NE, US | ∗ | ∗ | -- | 3 | Moderately well | Urea | 140 | Dfb | †Triticale–corn | Cattle |
| 8 | Forage rotation | Liebig et al. (2021) [53] | ND, US | ∗ | ∗ | -- | 3 | Moderately well | Urea, P2O5 | 48 | Dfb | †Thinopyrum intermedium–corn–soybean–spring wheat | Cattle |
| 9 | Forage rotation | Singh et al. (2020) [22] | SD, US | ∗ | ∗ | ∗ | 2 | Moderately well | NPK | 140–145 | Dfa | †Black oat–corn | Cattle |
| 10 | Forage rotation | Pilecco et al. (2019) [54] | RS, BR | ∗ | -- | -- | 6 | Imperfectly | NPK, urea | 60 | Cfa | †Ryegrass–soybean | Cattle |
| 11 | Forage rotation | Abagandura et al. (2019) [55] | ND, US | ∗ | ∗ | ∗ | 3 | Moderately well | _ | _ | Dwb |
|
Cattle |
| 12 | Forage rotation | Piva et al. (2019) [42] | PR, BR | ∗ | ∗ | -- | 1 | Moderately well | Urea | 0–150 | Cfb | †Ryegrass–†black oat–corn | Sheep |
| 13 | Forage rotation | de Carvalho et al. (2017) [56] | DF, BR | ∗ | -- | -- | 7 | Poor | Urea | 130–200 | Aw | †Brachiaria brizantha–soybean–sorghum | Cattle |
| 14 | Forage rotation | Ribeiro et al. (2020) [57] | SC, BR | ∗ | ∗ | -- | 1 | Moderately well | P2O5 | _ | Cfa | †Black oat–soybean | Cattle |
| 15 | Forage rotation | Sato et al. (2019) [58] | DF, BR | ∗ | -- | -- | 1 | Poor | NPK, urea | 100 | Aw | †Brachiaria brizantha–sorghum | Cattle |
| 16 | Forage rotation | da Rocha Junior et al. (2018) [59] | ES, BR | -- | -- | ∗ | 4 | Moderately well | P2O5 | _ | Aw | †Marandu grass–soybean | Cattle |
| 17 | Cover crop grazing | Piva et al. (2014) [60] | PR, BR | ∗ | ∗ | -- | 1 | Moderately well | Urea | 165 | Cfb | †Rye grass–black oat–corn | Cattle |
| 18 | Forage rotation | Sato et al. (2017) [61] | DF, BR | ∗ | -- | -- | 2 | Poor | NPK, urea | 100 | Aw | †Brachiaria brizantha–sorghum | Cattle |
| 19 | Cover crop grazing | Dieckow et al. (2015) [62] | PR, BR | ∗ | ∗ | -- | 1 | Moderately well | Urea | 90 | Cfa | †Black oat–soybean | Cattle |
| 20 | Forage rotation | Dhaliwal (2021) [17] | SD, US | ∗ | ∗ | ∗ | 1 | Poor | Urea | 67–168 | Dfa | †Black oat–soybean–corn | Cattle |
| 21 | Forage rotation | Douville (2017) [63] | SD, US | ∗ | ∗ | ∗ | 2 | Poor | _ | _ | Dfa | †Corn–†soybean–†black oat | Cattle |
- Note: Climate Köppen–Geiger climate classification: Aw, tropical savannah with dry winter; Af, tropical rainforest, fully humid; Cfa, humid subtropical; Cfb, temperate oceanic; Csb, warm-summer Mediterranean; Dfa, hot-summer humid continental; Dfb, warm-summer humid continental; Dfc, subarctic climate; Dwb, monsoon-influenced warm-summer humid continental.
- Abbreviation: NoBs, number of observations.
- ∗indicates data collected.
- --indicates data not collected.
- †indicates main crop used as stubble, forage, and cover crop(s).
2.1.3. Data Extraction
Our dataset was further classified based on several moderating variables, including climate and soil and drainage classes, crop species, livestock type, stocking density, tillage type, and fertilizer type and amount of nitrogen (N) fertilizer applied (Table S1). To group the data according to climate, we employed the updated world map of the Köppen–Geiger climate classification [67]. Additionally, we extracted the soil texture characteristics and soil and drainage classes from the Harmonized World Soil Database v2.0 [68]. All of these categorizations and data extractions were conducted utilizing the latitude and longitude coordinates linked to each study. Crop species were organized into crop functional groups according to FAO definitions [69]. Livestock species were categorized as small ruminants (sheep) and cattle. The classification of stocking density (low, moderate, and high) was based on the related description from the original papers used for data collection. MCLS type were categorized as stubble grazing, forage rotation, and cover crop grazing (Table 2). Regarding tillage type, we grouped no-till, strip-till, and ridge-till as conservation tillage (CST), while mould board and chisel plow were grouped under conventional tillage (CNT). Fertilizer application was treated as a binary variable (yes/no), where “yes” indicated that fertilizer was applied in the study and “no” indicated no fertilizer application. Type of fertilizer applied was then categorized as Nitrogen (N) fertilizer (N–P–K, urea, urea ammonium nitrate (UAN)), phosphorus (P) fertilizer (triple superphosphate (TSP) and single superphosphate (SSP)), and organic fertilizer (compost). The N application rates were categorized into two subgroups: low (≤120 kg N ha⁻1) and high (>120 kg N ha⁻1) levels of nitrogen as done by Shakoor et al. [70]. In cases where information on these variables (fertilizer and tillage) was unclear or unavailable, we assumed no fertilizer application and no tillage, respectively, for the corresponding observations.
| MCLS type | Description | Control system | Examples |
|---|---|---|---|
| Stubble grazing | Livestock grazing on the residual plant material (stubble) left in fields after a crop has been harvested, e.g., sheep grazing in early spring and after crop harvest in the fall in spring wheat-fallow and winter wheat fallow. | Ungrazed crop residues in the field. | Barsotti et al. [16]; Liebig et al. [47] |
| Forage rotation | Successive year rotation of annual crop with a grazed forage crop, e.g., oat–soybean rotation in two successive growing seasons. | Successive year rotation of ungrazed forage crop with an annual crop, e.g., chemical desiccation of black oat plant with glyphosate herbicides before planting soybean. | Bratti et al. [51]; Singh et al. [22] |
| Cover crop grazing | Rotation of a main crop with a grazed, off-season cover crops, e.g., annual-ryegrass as cover crop, being grazed in winter before planting maize in summer. | Annual ryegrass not being grazed but used as winter cover crop. | Dieckow et al. [62]; Piva et al. [60] |
2.2. Data Analysis
We conducted analyses utilizing the randomForest [71] and boot [72, 73] packages within R version 4.3.1. Visualization of funnel plots for asymmetries was used as a means of diagnosing the existence of publication bias. Additionally, we employed the “trim and fill” method [74] to evaluate if results were robust to adjustments for funnel plot asymmetry. An Egger test revealed no statistically significant indication of publication bias (z = −1.09, p = 0.27). Rosenberg’s fail-safe number [75] indicated that 9618 additional studies would be required to make the combined effect size of this study, statistically insignificant.
The nonparametric, bias-adjusted-accelerated (Bca) bootstrapping procedures method from the R boot package, was employed for calculating the overall mean effect size and 95% confidence interval (CI). This was conducted with 4999 iterations [77]. If the 95% CI does not cross zero, it indicates a significant impact by the integrated (MCL) system. To ease interpretation, the InRR was finally back-transformed to generate the percent change as [exp (InRR) −1] × 100. To assess the influence of environmental and management factors on GHG fluxes from soils in MCLSs, mean effect sizes for subgroups within moderating variables were calculated using the same bootstrapping approach. A randomization test with 999 iterations was conducted to assess differences among subgroups within a moderating variable [5]. Statistical significance was determined at p < 0.05, indicating a difference between subgroup categories. Subgroups with fewer than 10 observations (n < 10) were not excluded to emphasize the limited availability of data in these areas and highlight the need for further research in these specific contexts.
To determine potential relevant variables influencing the prediction of GHG emissions from the integrated (MCL) system, a nonparametric random forest (RF) procedure was carried out [77]. This was achieved using the “RF” package within the R programming environment. Variable importance ranking was determined using InRR as the response variable and crop type, livestock type, tillage, drainage class, stocking density, soil texture, climate, fertilizer type, amount of N fertilizer applied, and MCLS type as categorical predictor variables. The “RF” permutation importance is a more reliable indicator for predictor variables with diverse or numerous categories [78]. Thus, following the procedure by Peterson et al. [5], random permutations were conducted based on the following steps. First, variable importance was assessed by calculating the percentage increase in the mean squared error (MSE) upon the removal of a specific variable from the model. An increase in MSE denoted a decrease in model precision. Second, normalization of variable importance was then achieved by equating the most important variable (with the highest percent increase in MSE) to a value of 1. Finally, the importance of the remaining variables was calculated relative to the most important variable.
3. Results
3.1. MCLS and GHGs: Overall Effect
Our results showed that MCLS had no significant effect on soil N2O emissions (Figure 2). While many of the studies on N2O included in this analysis observed RR < 1 from integrated systems, most of the impacts were minor as compared to studies with RR > 1. In contrast, MCLS significantly increased CH4 and CO2 emissions by 40% (CI: 13%–75%) and 38% (CI: 15%–62%), respectively (Figure 2). Given the minimal variation in the effect for N2O, there was no significant heterogeneity among different GHG categories (p = 0.108).
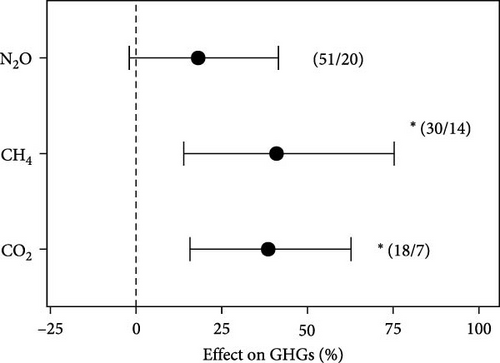
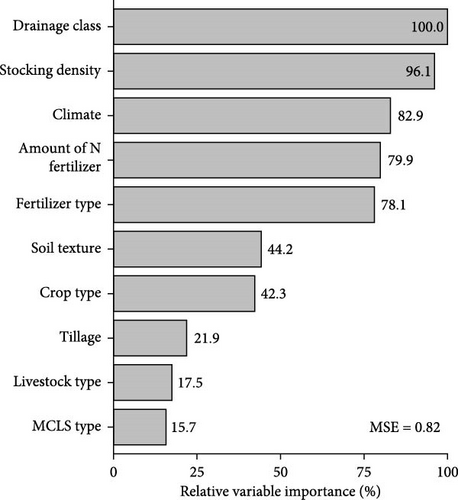
Figure 3 displays the relative importance of the variables included in this study. The results indicated that the importance variables in determining integrated (MCL) system effect on GHG emissions are in order: drainage class > stocking density > climate > amount of N fertilizer > fertilizer type > soil texture > crop type > tillage > livestock type > MCLS type. The MSE of the test set was 0.82.
3.2. Effect of Drainage Class on GHGs Emissions
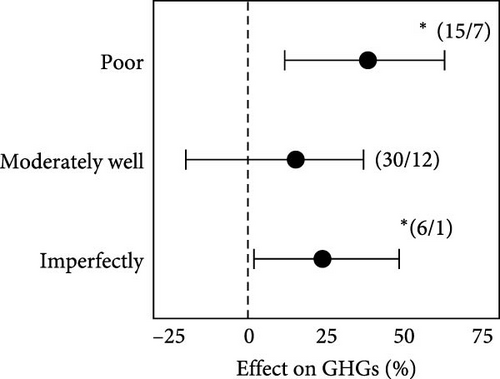
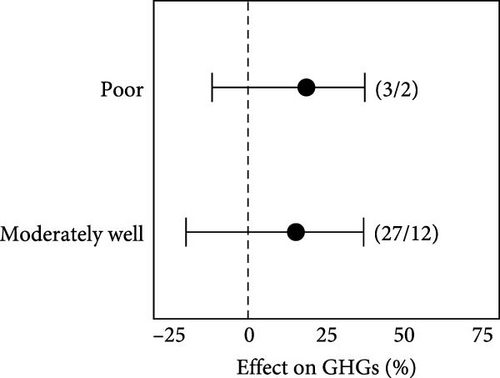
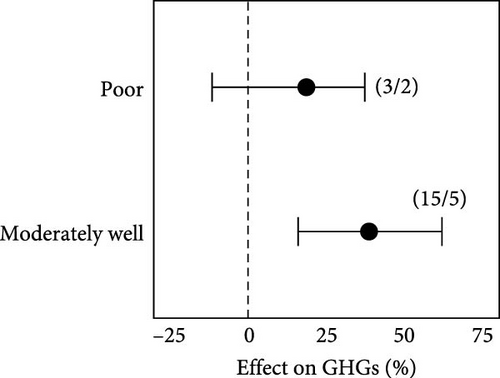
Figure 4a–c show the effect sizes of drainage classes on N2O, CH4, and CO2 emission from MCLS. From our results, MCLS under poorly and imperfectly drained soils significantly increased N2O emission by 38% (CI: 18%–63%) and 23% (CI: 1.9%–48%), respectively (Figure 4a). There were significant differences among the drainage classes according to the randomization test (p = 0.007). Similarly, MCLS under moderately well drained soils significantly increased CO2 emission by 32% (CI:8%-58%) (Figure 4c). There were no significant heterogeneity among subgroups for CO2 (p = 0.348). On the other hand drainage class had no significant influence on CH4 emissions under MCLS as compared to arable systems (Figure 4b), with no significant heterogeneity among subgroup categories for CH4 (p = 0.684).
3.3. Effect of Stocking Density on GHGs Emissions
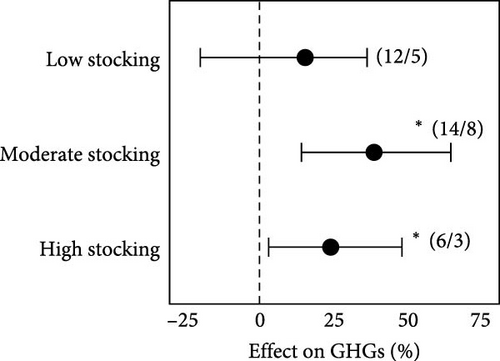
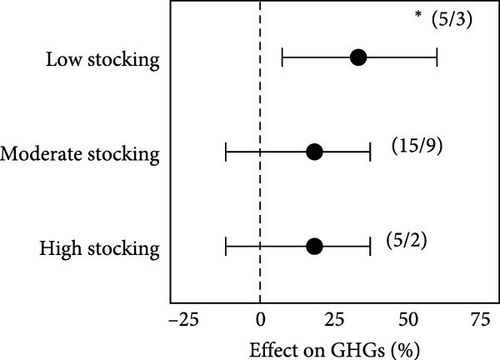
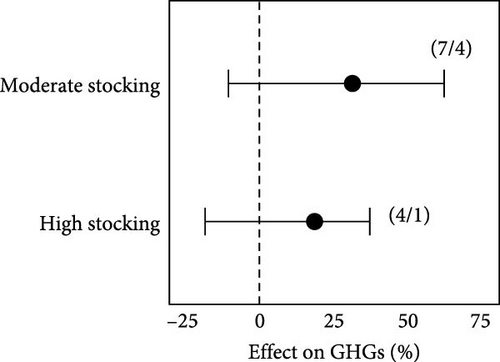
Effect sizes of stocking density on N2O, CH4, and CO2 emission are shown in Figure 4d–f. MCLS implemented with moderate and high stocking densities had a significantly higher N2O emission of 38% (CI: 14%–64%) and 23% (CI: 3%–48%), respectively, as compared to arable systems (Figure 4d). In contrast, when the stocking density was reduced, CH4 emission increased by 15% (CI: 7%–58%) (Figure 4e). There was significant heterogeneity among stocking density categories for N2O emissions (p = 0.003). However, stocking at either moderate or high densities had no significant effect on CO2 emissions in both MCLS and arable systems (Figure 4f). Randomization test indicated no significant differences among stocking density categories for CH4 (p = 0.207) and CO2 (p = 0.479).
3.4. Effect of Climate on GHGs Emissions
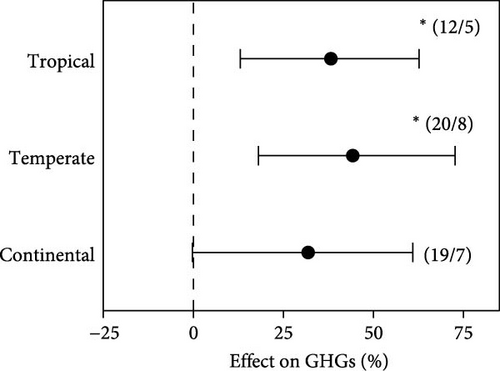
Effect sizes of climate on N2O, CH4, and CO2 emissions are shown in Figure 5a–c. MCLS significantly increased N2O emission in tropical climate by 38% (CI: 13%–63%) and in temperate climate by 44% (CI: 18%–72%), whereas in continental climate (32%, CI: −0.2%–60%) did not show any significant difference between MCLS and arable system. However, there was significant heterogeneity between the three categories (p = 0.038; Figure 5a).

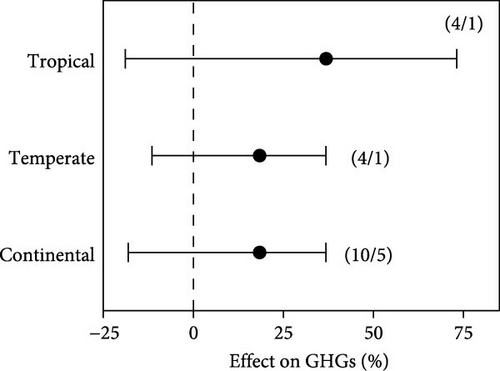
On the other hand, both temperate and continental climates significantly increased CH4 emissions by 38% (CI: 14%–64%) and 36% (CI: 9%–63%), respectively (Figure 5b). A randomisation test indicated no significant differences among the two categories. Effect size and CIs for tropical climates could not be generated due to a lack of observation (n = 0) for CH4 emissions in this climate zone of our study (Figure 5b). Furthermore, for all climate categories (tropical, temperate, and continental), MCLS had similar CO2 emissions to arable systems, with significant heterogeneity (p = 0.006) among the subgroups (Figure 5c).
3.5. Effect of Fertilizer Type on GHGs Emissions
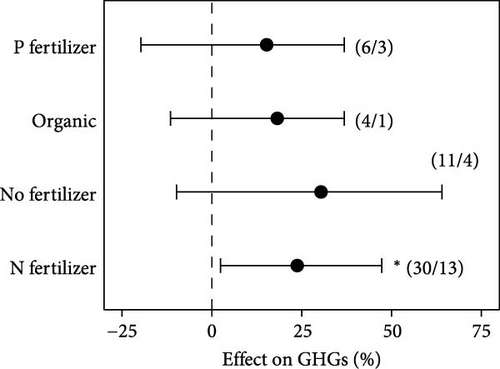
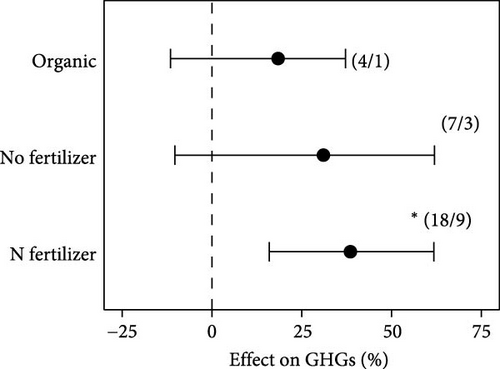
Significant N2O (23%, CI: 2%–47%) and CH4 (38%, CI: 15%–61%) emissions were observed for N fertilizer application with MCLS (Figure 5d,e). In cases where N fertilizer was replaced by either P fertilizer, organic fertilizer, or no fertilizer application, no notable distinction was observed between the MCLS and arable systems in terms of N2O and CH4 emissions. However, there was no significant difference in CO2 emission across all fertilizer types (Figure 5f). A randomization test among the subgroups revealed no significant differences for N2O (p = 0.57) and CO2 (p = 0.26) emissions, but a significant difference for CH4 emissions (p = 0.016).
3.6. Effect of Mineral N Fertilizer Amount on GHGs Emissions
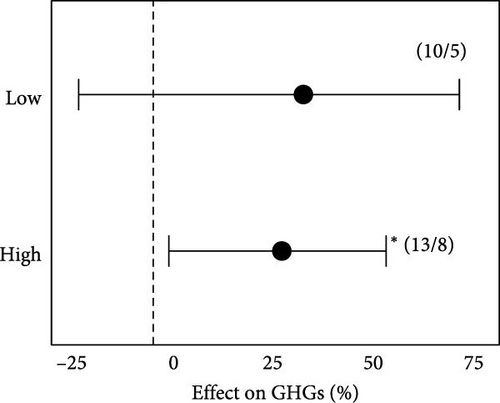
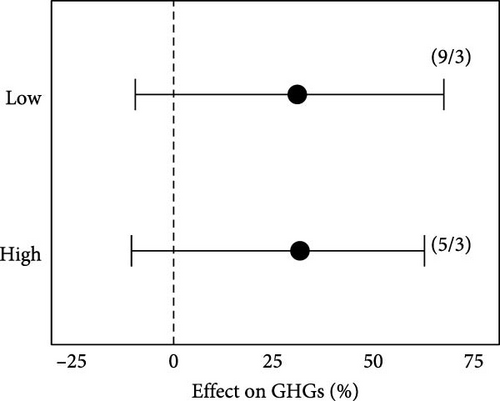
Figure 6 shows that different rates of N application exerted a significant influence on N2O and CH4 emissions, whereas CO2 emission remained unaffected (Figure 6a–c). On average, significantly higher N2O emission was observed at both low 33% (CI: 13%–55%) and high 38% (16%–62%) N application. However, no significant differences were found among N fertilizer amount categories (p = 0.444; Figure 6a). In contrast, only the high N application rate significantly increased CH4 emission by 31% (4%–7%), resulting in significant heterogeneity between the two subgroups (p = 0.032; Figure 6b). However, for both low 30% (CI: −9% to 66%) and high 31% (CI: −10% to 62%) N application rates, there was no significant difference in CO2 emission from the MCLS as compared to the arable system and no significant differences among subgroups (p = 0.602; Figure 6c).

3.7. Effect of Soil Textural Classes on GHGs Emissions
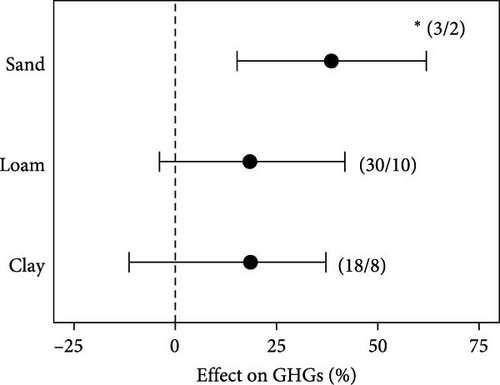
Figure 7a–c show the effect sizes of soil texture on N2O, CH4, and CO2 emission from MCLS. From our results, MCLS under sandy soils significantly increased N2O emissions by 38% (CI: 15%–61%), whereas loam (17%, CI: −4% to 42%) and clay (18%, CI: −11% to 37%) did not show any significant difference between MCLS and arable systems (Figure 7a). Similarly, there were no significant differences among the three soil texture categories (p = 0.064).
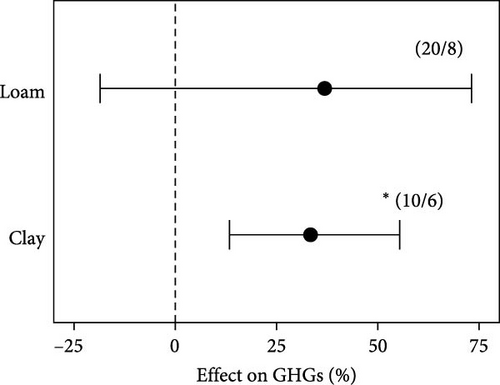
On the other hand, loamy soils had no significant influence on CH4 emissions under MCLS as compared to arable systems (Figure 7b). Conversely, when MCLS was implemented on clay soils, CH4 emissions significantly increased by 33% (CI: 13%–55%) relative to the arable system (Figure 7b). CIs could not be generated for sandy soils due to the small number of observations (n = 2) realised for studies on CH4 emission. The randomization test revealed no significant heterogeneity among the two soil texture categories (p = 0.173).
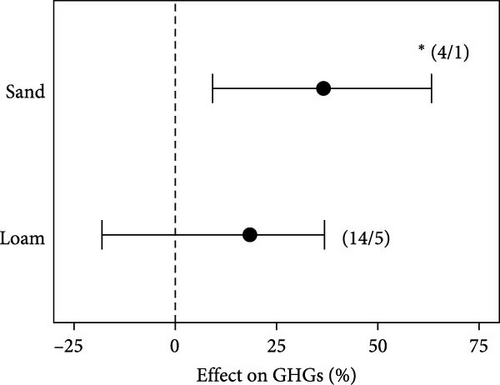
Moreover, sandy soils under MCLS as compared to arable systems significantly contributed to a higher CO2 emission of 36% (CI: 9%–63%). In contrast, the effect of loamy soils (18%, CI: −18% to 37%) on CO2 emission was not significantly different between MCLS and arable systems (Figure 7c). CIs were unable to be computed for clay soils due to lack of CO2 emission data in the studies incorporated into our analysis. Nonetheless, a randomization test indicated a significant difference among the two soil texture categories (p = 0.049).
3.8. Effect of Crop Type on GHGs Emissions
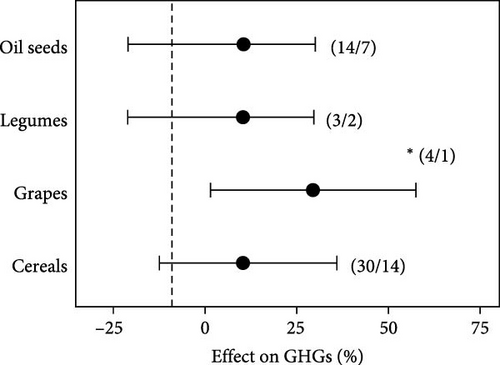
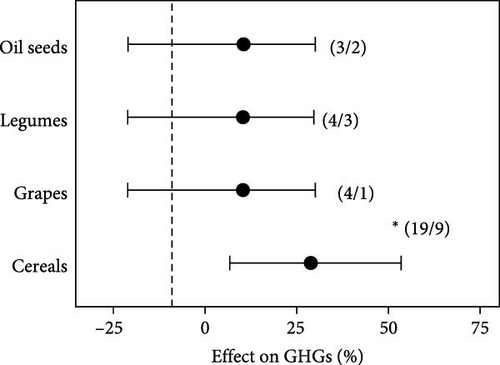
MCLS had no effect on N2O emission for cereals, legumes, and oil seed crops (Figure 7d). However, when grapes were included, MCLS had a significantly positive (36%) effect on N2O emission relative to the arable system (Figure 7d), although the randomization test showed no significant differences among crop type categories (p = 0.280).
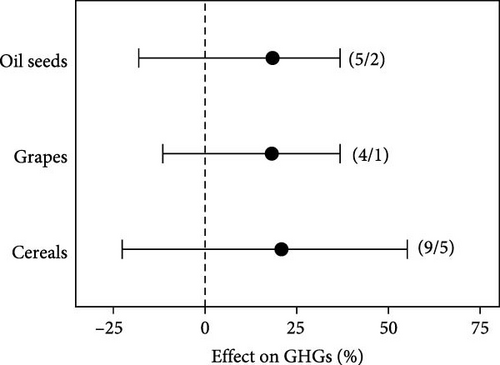
Alternatively, cereals in MCLS significantly increase CH4 emission relative to the arable system by 36% (CI: 14%–59%) (Figure 7e). Conversely, there was no difference between MCLS and arable systems for CH4 and CO2 emission when the crop was either a legume, oil seed, or grape (Figure 7e,f). However, while the randomization test revealed a significant difference among crop type subgroups for CH4 emissions (p = 0.002), there was no significant difference among subgroups for CO2 emissions (p = 0.730).
3.9. Effect of Tillage on GHGs Emissions
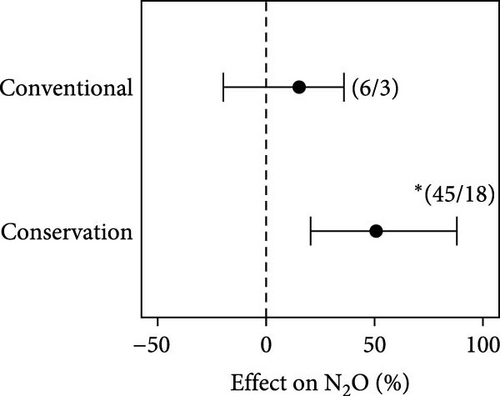
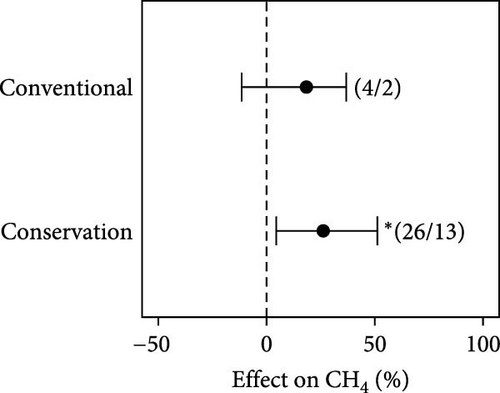
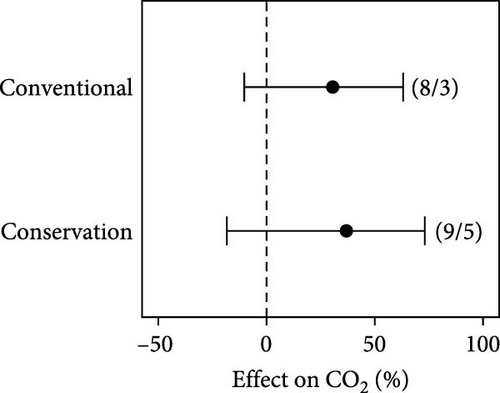
Our results showed that, between MCLS and arable systems, CNT had no significant effect on soil N2O, CH4, and CO2 emission, whereas with exception of CO2 emission, CST increased them significantly (Figure 8a–c). However, the magnitude of N2O (43%) was larger than CH4 (26%). According to the randomization test, there were no significant differences among tillage subgroups for N2O emissions (p = 0.556) and CO2 emissions (p = 0.188), but there was a significant difference among subgroups for CH4 emissions (p = 0.028).
3.10. Effect of Livestock Type on GHGs Emissions
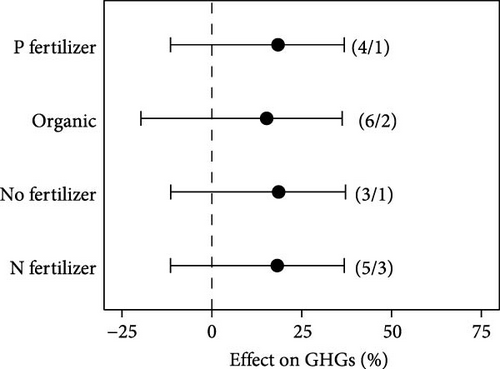
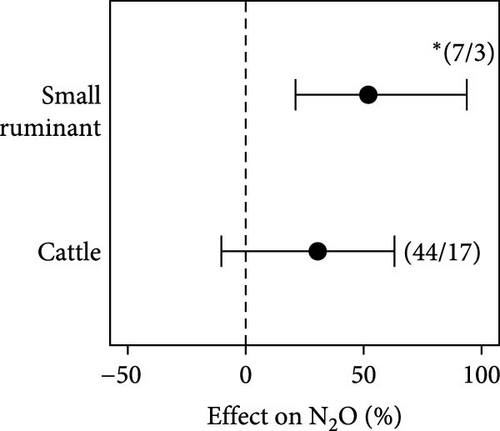
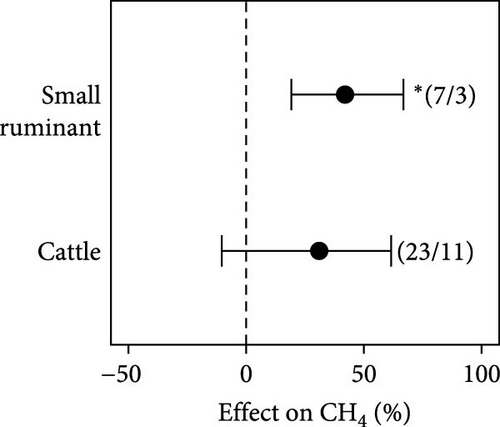
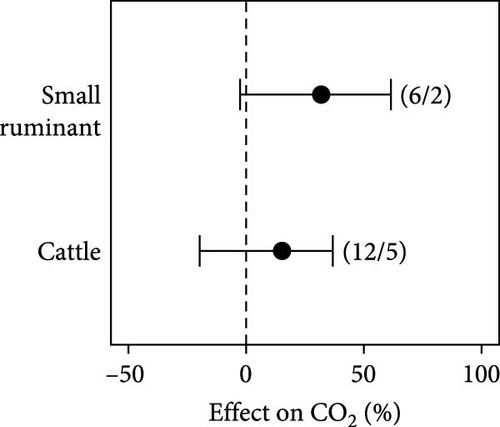
Except for CO2 (31%, CI: −3% to 61%), MCLS implemented with small ruminants had a significantly higher N2O (52%) and CH4 (42%) emission than arable systems (Figure 8d–f), whereas when small ruminant was replaced with cattle, there was no difference in N2O (30%, CI: −10% to 63%), CH4 (31%, CI: −10% to 61%), and CO2 (15%, CI: −20% to 36%) emissions between integrated and arable systems (Figure 8d–f). A randomization test revealed no significant differences among the two livestock categories for N2O (p = 0.750) and CO2 (p = 0.467), but there was a significant difference among subgroups for CH4 emissions (p = 0.049).
3.11. Effect of MCLS Type on GHGs Emissions
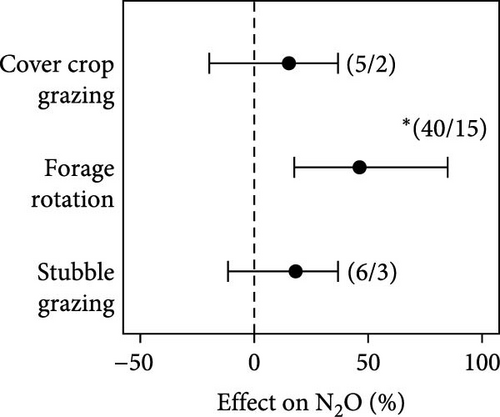
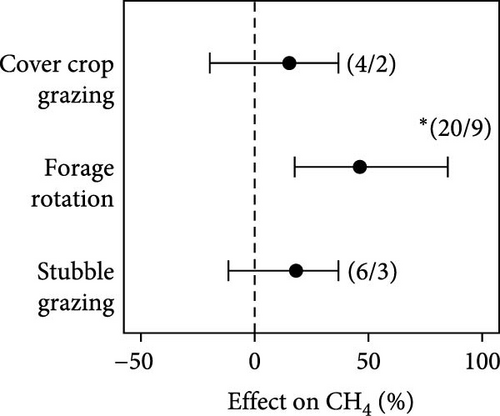
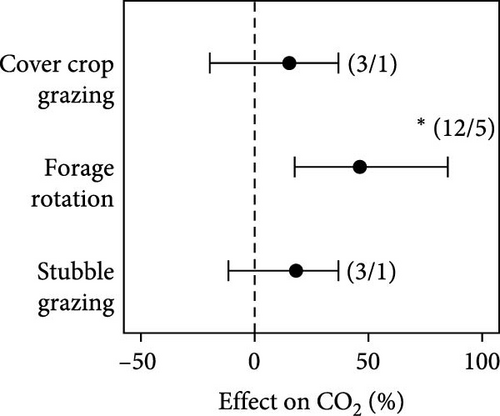
Our result revealed that different MCLS types had similar GHGs emissions between integrated and arable systems, except for forage rotation systems, where grazing of forages contributed to significantly higher N2O (46%), CH4 (33%), and CO2 (31%) emissions than arable systems; no forage grazing controls (Figure 8g–i). Significant heterogeneity was observed among MCLS type subgroups for CH4 (p = 0.014), but not for N2O (p = 0.835) or CO2 (p = 0.601).
4. Discussions
4.1. Overall Effect on GHGs
MCLS contribute not only to field-level biophysical processes, for example, nutrient cycling [14], and farm-level socioeconomics, for example, economic risk mitigation and livelihood diversification [12], but to improved ecosystem functioning via biodiversity and improve land productivity per unit area [8]. However, the effect of GHGs emissions under MCLS is still controversial.
Though MCLS showed a tendency to increase N2O emission, on average, our meta-analysis revealed a neutral effect of MCLS on N2O emission compared to arable systems. However, soil CH4 emission was significantly increased by MCLS. The stimulating effects of MCLS on soil CH4 emission may be ascribed to the addition of manure from livestock to the cropland, as animal manure has been reported to be a significant source of CH4 flux [79, 80]. The presence of MCLS effect on CH4 emission in our study was also supported by other MCL studies [42, 57]. They associated this observation with increased soil bulk density and the lower aeration porosity induced by livestock trampling.
Regarding CO2 emissions, the observed increase in MCLS is likely attributed to increased microbial activity and carbon mineralization, primarily in response to the introduction of livestock manure droppings. Our meta-analysis aligns with previous findings, such as Olaleye et al. [81], which highlight that the incorporation of manure introduces soil microbes, consequently elevating CO2 emissions through microbial respiration. This is further corroborated by Lecain et al. [82], who observed higher CO2 emissions in the context of continuous heavy grazing compared to continuous light grazing and ungrazed pastures, which is similar to our results.
4.2. Drainage Class Influence on GHGs Emissions
It has been extensively documented that drainage plays a significant role in influencing both mineralization and denitrification processes [83]. Our meta-analysis reveals a significant increase in soil N2O emissions under MCLS in both poorly and imperfectly drained soils compared to control systems (arable cropland). This increased N2O production in MCLS may stem from various factors, including drainage characteristics, alterations in soil properties like compaction, and N inputs from livestock excreta. Venterea et al. [84] suggested that elevated moisture levels in poorly drained soils contribute to increased denitrification and subsequent N2O production. Additionally, soil compaction fosters anaerobic conditions that could promote N2O generation during denitrification [85]. Furthermore, the deposition of urine and dung supplies water and labile nutrients to the soil, consequently accelerating soil N2O emissions [86].
4.3. Stocking Density Influence on GHGs Emissions
Soil N2O and CH4 emissions showed a significant response to stocking density variations than CO2 emissions (Figure 4), which may suggest that N2O and CH4 emissions are more sensitive to stocking rates than CO2. Soil N2O emission was significantly higher in increased stocking densities. Hence, higher manure deposition per unit area led to an increase in NH4+ and NO3− availability which preceded as substrate for microbial formation of N2O by the nitrification and denitrification processes [87]. Contrary to our expectations, increased stocking density, potentially resulting in higher manure deposition, did not seem to lead to significantly higher CH4 emissions. Surprisingly, lower stocking densities exhibited higher CH4 emissions instead. The reasons behind greater CH4 emissions for MCLS under low stocking density compared to moderate and high stocking density were unclear. However, the absence of an effect of low stocking density on soil CH4 uptake in this study contradicts previous findings suggesting that high grazing intensities, leading to soil compaction and anaerobic soil conditions, promote CH4 emissions [60, 88].
4.4. Role of Climate in Modulating GHGs Emissions
In accordance with the updated Köppen–Geiger climate classification by Kottek et al. [67], the primary climate groups analyzed in our meta-analysis were characterized by minimum temperature (Tmin) and minimum precipitation (Pmin) thresholds. These were defined as tropical (Tmin ≥ +18°C, Pmin ≥ 60 mm), temperate (Tmin < +18°C, Pmin < 40 mm), and continental (Tmin ≤ −3°C, Pmin < 40 mm). Our meta-analysis results indicate that tropical and temperate regions exhibited higher N2O emissions, whereas temperate and continental regions demonstrated elevated CH4 emissions. Conversely, all climate groups displayed a neutral effect on CO2 emissions (Figure 4c).
Precipitation and temperature are pivotal factors influencing N2O emissions across various climate zones. The significantly higher N2O emissions observed in tropical and temperate regions suggest that their comparatively higher minimum temperatures (Tmin) and minimum precipitation levels (Pmin) may have prolonged the occurrence and duration of anaerobic soil conditions in MCLS. This, in turn, could have posed challenges in effectively managing N2O flux. Pärn et al. [89] observed heightened N2O emissions in a warm temperate zone, attributable to microbial activities. Additionally, Barnard et al. [30] postulated that tropical climate zones are conducive to microbial nitrification and denitrification processes, which directly correlates with N2O emissions [90].
Contrarily, temperature emerges as the primary determinant governing fluctuations in CH4 emissions across all climatic zones [91, 92]. Our findings indicate that climate zones characterized by comparatively lower minimum temperatures (temperate and continental) exerted a significant influence on CH4 emissions from MCLS. This phenomenon may be attributed to the synergistic impact of livestock excretions (comprising manure and urine) and minimum temperature (Tmin), potentially creating a conducive environment for methanogenic bacterial activity. Cai et al. [86] postulated that animal manure typically harbors an abundance of methanogenic bacteria, potentially instigating CH4 release. Furthermore, fields situated in cool temperate regions were identified as elevated CH4 emitters [93]. Conversely, Wu et al. [94] observed significantly lower CH4 emissions from plateau frigid zones compared to tropical and sub-tropical zones.
4.5. Role of N Fertilizer Amount on GHG’s Emissions
Previous studies have established a linear relationship between fertilizer rate and cumulative N2O emission [95, 96], aligning with the emission factor concept of the Intergovernmental Panel on Climate Change [97], which posits that 1% of N2O is emitted from the total N applied during fertilizer application. Our meta-analysis reveals that N2O emissions from MCLS increased nearly linearly with the N fertilizer rate compared to the control system (arable cropland; Figure 7a). The primary driver for differences in N2O emissions between MCLS and the control system (arable cropland) is likely the increased availability of NH4+ and NO3− (from both mineral fertilizer and manure from grazing livestock) in MCLS soils as substrates for nitrification and denitrification processes. Concentrations of NH4+ and NO3− in animal manure have been reported to range from 147 to 4638 mg kg−1 and 3.97 to 120 mg kg−1, respectively [98].
Apart from CH4 oxidation by OH− radicals in the atmosphere, soil microbes represent the major sink for atmospheric CH4 [27, 99]. However, ecological controls can render soils either sources or sinks of CH4. Our meta-analysis results indicate that when high N rates (>120 kg N ha−1) were applied in MCLS, CH4 emissions significantly increased over the control system (arable cropland). This could be attributed to the high N supply from both mineral fertilizer and manure deposition from grazing livestock. Our findings are consistent with previous reports suggesting that nitrogen enhances CH4 emissions by promoting methanogen activity [100]. It is also established that NH4+ competes with CH4 for active CH4 monooxygenase, resulting in soils with higher NH4+ levels being higher emitters of CH4 [101, 102]. However, these results are not uniform across the literature. Another study suggested that nitrogen fertilizer reduces CH4 emissions because CH4 production is inhibited by NO2−, NO, and N2O, which accumulate transiently during the reduction of NO3− and are toxic to methanogens [103]. Additionally, Hütsch et al. [104] suggested that it may require at least 7 years of fertilizer application before observing inhibitory effects.
4.6. Fertilizer Type Influence on GHGs Emissions
The effect of fertilizers on soil GHG emissions varies depending on factors such as fertilizer type, soil characteristics, ecological context, and management strategies. Our meta-analysis indicates that the application of nitrogen (N)-based fertilizers significantly enhanced emissions of both N2O and CH4 (Figure 6d,e). In contrast, CO2 emissions remained unaffected by the type of fertilizer applied (Figure 6f).
Generally, it is postulated that a linear correlation exists between the application of nitrogen (N) and subsequent emissions of N2O from soils. Consequently, the augmented use of N-based fertilizers, such as urea and NH4+ sulphate, has been identified as a significant factor in intensifying soil N2O fluxes [105–107]. Similarly, manure has been observed to exhibit elevated rates of N mineralization [108], potentially heightening nitrification and denitrification rates, consequently leading to increased N2O production [109]. Therefore, the increased N2O emissions in our study could be attributed to the synergistic effect of N-fertilizer and manure, culminating in augmented soil N levels within MCLS. Our findings align with the studies conducted by Piva et al. [60] and Piva et al. [42], demonstrating that the intensity of nitrogen (N) fertilization stands as a key determinant in driving N2O emissions within MCLS. Prior to the application of Urea to maize, the N2O fluxes in MCLS and purely arable cropland (control) were similar; however, Piva et al. [60] noted a significant surge in N2O flux after urea application to maize in both systems, but more in croplands within MCLS. Additionally, Shakoor et al. [110] documented increased N2O emissions with higher levels of N application.
In the context of CH4 fluxes, upland agricultural soils are generally recognized for emitting minimal CH4 [22]. As a result, management practices typically exert little influence on CH4 flux within these systems [55]. However, from our meta-analysis findings, the application of additional mineral N-fertilizers increased CH4 emissions in MCLS when compared to arable systems. Given that mineral N-fertilizer was applied to both systems, a plausible explanation for our results could be attributed to the additional impact of soil compaction induced by livestock trampling in MCLS, resulting in higher soil bulk density, reduced porosity, and subsequently, diminished soil aeration. According to Saggar et al. [27], aerated soil conditions are conducive to favoring the methanotrophic oxidation of CH4 into CO2. Additionally, Zanatta et al. [111] observed peaks in CH4 emissions occurring 4–6 days after N fertilizer application.
4.7. Role of Soil Texture on GHGs Emissions
Soil texture exerts influence over several factors governing GHG emissions, encompassing aeration, soil moisture, WFPSs, bulk density, soil organic C stocks and DOC availability, mineral N availability, and microbial activity. Thus, depending upon the intricate interplay of these controlling factors at specific sites of GHG production in the soil, it is plausible to anticipate diverse effects of soil texture on GHG emissions [112]. Hence, our meta-analysis findings demonstrate that soil texture exerts varying interactions with the magnitude of GHG emissions in MCLS, such that sand textured soils exhibited significantly higher emissions of both N2O and CO2, whiles clay soils contributed to significantly higher CH4 emissions in MCLS (Figure 5a–c).
The cation exchange capacity (CEC) plays a crucial role in regulating N2O emissions by influencing the availability of NH4+ in the soil. Within the textural classes examined in our meta-analysis, it has been documented that sand exhibits the lowest CEC [113]. As a consequence, the increased availability of soil NH4+─N, likely stemming from the application of both N-based mineral fertilizers and livestock manure in sandy soils under MCLS, could be a determinant in the production of N2O. De Visscher et al. [114] illustrated that increasing inputs of NH4+ into soils with low CEC were linked to higher N2O emissions. Similarly, Fernando et al. [115] explored the adsorption of NH4+ from manure and NH4+ sulphate in two soils characterized by varying CEC values. They observed that the clay-rich soil displayed NH4+ adsorption maxima of 1000 and 909 mg NH4+ kg−1 soil for the manure and (NH4)2SO4 treatments, respectively. In contrast, the sandy soil exhibited lower NH4+ adsorption maxima, measuring 625 mg NH4+ kg−1 soil for the manure treatment and 217 mg NH4+ kg−1 soil for the (NH4)2SO4 treatment. Our findings align with the insights provided by these researchers.
Clayey soils within MCLS showed significantly higher CH4 emissions (Figure 5b). Other studies on the effect of fine-textured soils on CH4 emissions obtained similar results [70, 116]. According to Islam and Weil [117], soils with fine textures possess a higher proportion of fine pores, leading to the formation of anaerobic conditions within the soil. Dutaur and Verchot [118] have affirmed this by stating that, soils with fine pores support CH4 emissions in anaerobic conditions. Likewise, the application of manure to the soil not only introduces an inoculum for methanogenic bacteria but also promotes their consumption of oxygen (O2), creating a conducive environment for anaerobic conditions [112]. This application has been observed to prompt an immediate increase in CH4 fluxes in the soil [119, 120]. Consequently, the combination of manure application injecting methanogenic bacteria and the larger proportion of fine pores exhibiting frequent anaerobic conditions, the stimulation of CH4 production by manure clayey soils within MCLS is likely to lead to a rise in net CH4 emissions.
Regarding CO2 emissions, sandy soils under MCLS exhibited the highest levels compared to the arable system. The significant increase in CO2 emissions observed in sandy cropland soils under MCLS is likely attributed to the distinctive properties of this soil texture. Sandy soils, characterized by larger particle sizes, tend to form more macropores which affects gas transport in the soil [121, 122]. The introduction of excrement, including both manure and urine, into the soil by grazing livestock further contributed to this phenomenon, by creating favorable conditions for the decomposition of organic carbon by heterotrophic microbial communities, thereby leading to a subsequent rise in CO2 emission levels. Our findings align with those of Mangalassery et al. [123], who stated that the higher soil porosity in sandy soils may enhance the respiration of aerobic organisms by facilitating the movement of water and air through the soil. This improved soil aeration promotes organic matter mineralization and subsequently enhances CO2 flux.
4.8. Role of Crop Type on GHGs Emissions
The GHG emissions associated with each crop type vary due to distinctions in inputs utilized and their respective nutrient-use efficiencies. Additionally, even within the same crop type, GHG emissions will fluctuate between farms based on specific agronomic choices. Consequently, the optimization of the four Rs (right source, right rate, right time, and right place) in fertilizer management is crucial not only for enhancing yield but also for mitigating GHG emissions from the soils under different/same crop types [124].
MCLS combined with grape production in vineyards exhibited significantly higher N2O emissions, as illustrated in Figure 8a. Several factors related to management decisions could potentially contribute to this outcome. All MCLS plots with grapes in our study received organic fertilizer, particularly compost. Demonstrating the impact of compost applications in vineyards on N2O emissions, Longbottom and Petrie [125] observed that N2O emissions from compost-treated vineyards significantly increased compared to the control, peaking 13–19 days after application at levels up to 40 times that of the control. Similarly, optimal nitrogen fertilizer application through fertigation in vineyards is recommended during periods of active root growth, specifically just before flowering and harvest, according to Comas et al. [126]. Applying nitrogen at other times during the season may result in elevated N2O emissions [125]. Furthermore, grapevine cultivation often occurs in soils with a notably low sorption capacity [127]. Consequently, this raises the probability of increased N availability for nitrifying bacteria, which may potentially align with our observation of higher cumulative N2O emissions from vineyards combined with MCLS.
Our meta-analysis revealed that cereals within MCLS significantly enhanced CH4 emissions compared to cereals in arable systems (Figure 8b). Several studies have established that the cultivation of specific crops can influence soil CH4 emissions. For instance, both maize and paddy fields have been extensively investigated and identified as substantial sources of CH4 fluxes [70, 128]. However, among cereals, it is the cultivation of rice that has received widespread recognition for its substantial contribution to CH4 emissions [129]. Conversely, the cereals predominantly employed in our study within MCLS were primarily maize and wheat. Therefore, our conflicting findings indicate that it is premature to generalize regarding the impact of crop type on CH4 emissions, given the intricate interplay of various factors including microbial composition, soil N availability, and soil aeration and porosity [100, 130].
4.9. Role of Tillage on GHGs Emissions
CST methods, including minimum or no-till approaches, have been widely acknowledged for their potential to enhance soil quality [131], augment soil carbon and nitrogen content [50], and improve crop yields [77]. However, the response of GHG emissions to CST is characterized by variability in the literature, with some studies reporting increased GHG emissions [132, 133], while others indicate reduced emissions [134, 135] compared to CNT practices. In our meta-analysis, we found that within MCLS subjected to CST, there was a significant increase in N2O and CH4 emissions when compared to arable systems employing the same tillage practices.
The higher N2O fluxes observed in the MCLS following CST, in comparison to the arable system, may be attributed to the improved physicochemical properties of the soil. Both the incorporation of manure [80] and the adoption of CST practices [136] have been documented to enhance soil structure and activity of soil macrofauna, improve soil moisture levels, and augment organic matter content. Higher soil moisture and a higher proportion of fine pores can lead to increased WFPS, thereby influencing N2O emissions in agricultural soils [95]. Additionally, Trujillo-Tapia et al. [137] also noted a positive correlation between N2O emissions, soil temperature, and soil water content. Moreover, the higher soil moisture content may have stimulated nitrification and denitrification processes [138], consequently resulting in increased N2O emissions.
CH4 emissions are subject to be influenced by both tillage practices [70, 136] and the impact of livestock trampling [139]. The adoption of CST, coupled with soil compaction from grazing livestock, leads to increased soil bulk density, compaction, and reduced WFPSs [140]. These conditions ultimately create a conducive environment for the anaerobic decomposition of soil organic matter (SOM), consequently inhibiting methanotrophic activity and resulting in elevated CH4 emissions [141, 142].
4.10. Role of Livestock Type on GHGs Emission
Consistent with our meta-analysis findings (Figure 8d–f), the introduction of sheep excrement has been shown to increase emissions of N2O and CH4 from agricultural soils [143]. As a result, our study found that small ruminants, specifically sheep, exhibited greater N2O emissions compared to cattle. This observation arises from known variations in the decomposition rates of livestock manure, attributed to differences in manure chemical composition stemming from the digestive capacities of distinct livestock species, even when provided with the same diet [144]. Consequently, the organic N mineralization rate tends to be slower in sheep dung compared to cattle dung, potentially due to the pelletized nature of sheep excrement, which renders it more resistant to fragmentation and decomposition [145]. This characteristic may have negative impacts on the availability of active organic substances and mineral N in the soil, and hence, reduce GHG emissions. However, sheep produce excreta with higher nutrient concentrations that tend to be more evenly dispersed [146]. Several researchers have corroborated this by observing higher N concentrations in sheep manure when compared to cattle manure [147, 148]. Hence, coupled with their slower mineralization rate, the higher nutrient content of sheep manure may offer a more consistent and sustained source of nitrogen over time for nitrifying bacteria, potentially leading to increased cumulative N2O production in MCLS implemented with sheep.
CH4 emissions from manure are predominantly influenced by factors such as the species of animal, the composition, and digestibility of their feed, as well as the microbial population in their rumen and digestive tracts [149]. In an investigation using the Shannon diversity index to assess microbial community structures in various types of manure compost, Wan et al. [150] observed greater diversity in microbial communities associated with sheep manure compared to cattle manure. Moreover, grazing animals play a substantial role in both removing a considerable amount of plant biomass and translocating nutrients back to the soil through urine and dung [151]. Consequently, the type of feed is a critical factor in determining the quality of manure return to soils. For instance, small ruminants demonstrate a preference for plants with higher nutritional value in comparison to cattle [148]. Among the crop types found in our meta-analysis, leguminous crops like cowpea and common bean have been identified as highly nutritious and appealing fodder for livestock [152, 153]. However, they have also been associated with CH4 production in livestock. Ansah et al. [154] observed significantly higher CH4 production in rams fed with cowpea and groundnut. Additionally, Bamualim et al. [155] noted that forage feeds contribute to elevated CH4 emissions, particularly when they are rich in crude fiber. Likewise, among the crops examined in our meta-analysis, researchers have consistently noted elevated levels of crude fiber in cowpeas and groundnuts relative to maize, wheat, and rice [156, 157]. Thus, our findings on the effect of sheep on CH4 emissions can be explained in the context of the observed feeding preferences of sheep as highlighted by these studies.
4.11. MCLS Type Influence on GHGs Emissions
Mixed crop–livestock farms cultivate forage crops to complement the native range [158], reduce NO3− leaching [159], and reduce GHG emissions [160]. Conversely, to the conclusion drawn by Kebreab et al. [160], our meta-analysis revealed that the inclusion of multiple forages with MCLS significantly increased N2O, CH4, and CO2 emissions (Figure 8g–i). Nevertheless, our finding aligns with previous works that found crop–forage rotation systems to increase GHG.
In a 5-year rotational experiment, where 3 years of alfalfa were followed by wheat and barley, N2O emissions were found to be twice as high compared to the corn–wheat–corn–wheat–barley rotation system [161]. In a separate 24-year rotational study, Ross et al. [162] compared three systems: (1) a continuous annual grain system, (2) a rotation (faba bean, red clover, and alfalfa with manure), and (3) a continuous perennial–grass–legume forage system supplemented with fertilizer (18 kg N ha−1 year−1) and white clover (Trifolium repens). The authors observed N losses to the atmosphere at rates of 4 kg N ha−1 year−1 for the continuous annual grain, 28 kg N ha−1 year−1 for the rotation, and 24 kg N ha−1 year−1 for the continuous perennial–grass–legume forage system. Furthermore, incorporating a high biological nitrogen inhibitor (BNI) forage, particularly Brachiaria spp., was found to decrease the oxidation rates of soil NH4+, leading to a 90% reduction in N2O emissions compared to emissions from plots planted with soybean [163, 164]. Consequently, depending on the succession order and type of grazed forage crops included, rotational forage systems can either act as a source or sink for N2O emissions.
The significantly higher CH4 emissions observed in MCLS under forage rotation contrast with findings from several other studies. Abagandura et al. [55] did not observe significant effects of crop rotational diversity on CH4 flux. Likewise, Behnke et al. [165] reported that a corn–soybean rotation yielded CH4 fluxes similar to those in systems with either corn or continuous soybeans alone, even after 17 years of rotation. However, according to Ozlu and Kumar [166] and Lee et al. [167], whether soil acts as a source or sink for CH4 depends on the activity of CH4-releasing microorganisms (which increase under anaerobic conditions) and CH4-consuming microorganisms (which increase under aerobic conditions). Additionally, there is a scarcity of studies on this topic, underscoring the need for further research to explore the impact of forage rotation on CH4 emissions. For example, in their investigation on the effects of grazed perennial forage–crop rotation system on GHG fluxes, Gamble et al. [19] provided extensive discussion on the effects of crop phase on N2O and CO2 emissions, but the examination of CH4 was notably absent.
The soil CO2 flux results suggest that forage rotation within a MCLS may lead to increased soil CO2 emissions. In an MCLS experiment, Tracy and Zhang [13] observed higher SOC concentrations in integrated crop–oat–pasture systems compared to a continuous corn system. It is plausible that in our study, the surplus SOC in the surface layers of forage rotation under MCLS provided additional substrates for soil microorganisms to respire. Likewise, the inclusion of multiple cover crops in rotation with corn and sorghum resulted in higher CO2 emissions compared to cases with no cover crop in both corn and sorghum [168]. This was attributed to the increased total soil respiration (heterotrophic + root) induced by multiple cover crops. It is well-documented that plant root respiration can contribute anywhere from 7% to 90% of the total soil respiration, contingent on factors such as growth stage, vegetation type, and soil conditions [169, 170]. Hence, in an ICL study, Abagandura et al. [55] examined the impact of crop rotational diversity on GHG fluxes and identified root respiration as a primary contributor to peak CO2 emissions from soils. A similar conclusion was drawn by Gamble et al. [19] in their investigation of the effects of a grazed perennial forage–crop rotation system on soil CO2 flux.
5. Limitations
The result presented, like all soil GHG emission assessments need to be interpreted with caution. Given the transient spikes in these emissions, precise and frequent measurement are needed to accurately gauge emission concentrations [171]. Although most of the studies used in this meta-analysis reported on time of gas measurement, high heterogeneity among studies in the interval between gas sampling sessions might have produced biased emission estimates. In addition, only a limited number of studies used in this meta-analysis conducted simultaneous measurements of all three GHGs. Hence, for a comprehensive evaluation of soil emissions of N2O, CH4, and CO2 linked to a particular treatment within MCLS, future research studies should aim to measure all three GHGs within the same study. Furthermore, we could not unveil the response patterns of N2O, CH4, and CO2 emissions in MCLS in Africa, Europe, and Asia due to differences in system modalities and/or a paucity of published data. For example the modifiable effect of livestock trampling on soil physicochemical properties and GHG emissions is often absent in the default cut-and-carry MCLS of sub-Saharan Africa. Similarly, a meta-analysis by Peterson et al. [5] on yield in co-located MCLS, found data only from North America, South America, and Australia. Furthermore, there is a decline in MCLS in Europe and Asia. Considering all types of farming systems-cropping only, animal husbandry only, and mixed farms-integrated systems constitute only 10%–20% of farms in Europe [65, 172, 173] and <10% in Asia [173]. While our study is the most up-to-date and comprehensive, our restriction to studies with only co-located MCLS, that is, those that use the same land area for both crop and livestock production might limit the ability to identify general patterns at the global scale. Despite these limitations, to the best of our knowledge, our study is the first comprehensive systematic review and meta-analysis that unveils moderating factors influencing three GHG soil emissions in two major MCL production regions.
6. Conclusion
We conducted a meta-analysis of the interactive effects of environmental and management factors with MCLS on soil GHGs emissions. We found that drainage class, stocking density, climate, amount of N fertilizer, fertilizer type, and soil texture exerted greater control over the emissions of N2O, CH4, and CO2 in MCLS. However, differences in CO2 emissions across categories within stocking density, climate, fertilizer type, and amount of N fertilizer, crop type, tillage, and livestock type were not significantly affected by MCLS. Notably, CST methods, such as minimum and no-till, exhibited higher GHG emissions compared to CNT practices. Additionally, the response of GHG emissions varied depending on soil type, underscoring the diversity in sequestration capacities among different soils. While MCLS led to increased GHGs emissions, it is worth noting, however, that this adverse impact can be partially offset by considering the yield-related benefits (both grain and feed) associated with MCLS. All these underscore the need for further research to fully understand and quantify the effects of MCLS on GHG emissions at different scales. Additionally, there is a call for the implementation of sustainably intensified MCLS practices that balance the trade-offs between agricultural productivity and environmental sustainability. In any case this study represents a pioneering effort in quantifying the effect of MCLS on three GHG (N2O, CH4, and CO2) emissions and identifying significant moderating factors. By doing so, it provides valuable insights that contribute to a comprehensive understanding of MCLS-driven changes in soil GHG dynamics.
Conflicts of Interest
The authors declare no conflicts of interest.
Author Contributions
Albert Berdjour, Amit Kumar Srivastava, and Thomas Gaiser were involved in conceptualization. Albert Berdjour, Amit Kumar Srivastava, Frank Ewert, and Safiétou Sanfo were involved in data curation and formal analysis. Amit Kumar Srivastava, Thomas Gaiser, and Frank Ewert were involved in funding acquisition. Albert Berdjour, Safiétou Sanfo, and Bocar Ahamadou were involved in writing – original draft. Amit Kumar Srivastava, Thomas Gaiser, Frank Ewert, and Bocar Ahamadou were involved in writing – review and editing the manuscript. All authors have read and approved the manuscript.
Funding
This work was supported by the West African Science Service Centre on Climate Change and Adapted Land Use (WASCAL). We also acknowledge the funding by the German Federal Ministry of Education and Research (BMBF) in the framework of the funding measure “Soil as a Sustainable Resource for the Bioeconomy-BonaRes,” project BonaRes (Module A): BonaRes Center for Soil Research, subproject “Sustainable Subsoil Management-Soil3” (Grant 031B0151A). In addition, the work was partially funded by the Deutsche Forschungsgemeinschaft (DFG, German Research Foundation) under Germany’s Excellence Strategy-EXC 2,070-390732324, COINS (Grant 01LL2204C).
Acknowledgments
We would like to thank Caitlin A. Peterson and Amelie C. M. Gaudin for their thoughtful responses to our queries, which significantly contributed to shaping the direction and content of this work. We also acknowledge Dr. Goodman Sarfo Kantanka for his willingness to share his institutional privileges in accessing some of the literature. His contribution is a testament to the spirit of academic camaraderie and the pursuit of excellence.
Supporting Information
Additional supporting information can be found online in the Supporting Information section.
Open Research
Data Availability Statement
The data that support the findings of this study are available from the corresponding author upon reasonable request.


