Evaluating the Performance of Tef (Eragrostis Tef [Zucc.] Trotter) Varieties Under Varying Rates of Blended NPSB Fertilizer in the Tembaro Area, Central Ethiopia
Abstract
The Tef crop is significant in Ethiopia for domestic use and as a revenue source. However, the productivity of Tef is hampered by poor soil fertility and a lack of fertilizer recommendations tailored to different Tef varieties. In 2023, a field experiment was conducted in Tembaro District, Central Ethiopia, to address these issues. The main objective of this study was to determine the optimal blended NPSB fertilizer rates for different Tef varieties. Four NPSB fertilizer rates (0, 45, 90, and 135 kg/ha) and four Tef varieties [Local Check, Quncho, Tsedey (Cr-37), and Bosset] with a seed rate of 7.5 kg/ha were used. The experiment used a randomized complete block design with three replications. Growth, yield, and other data were collected and analyzed using SAS 9.4. The results showed significant (p < 0.05) interaction effects between variety and fertilizer rate for most measured traits, like days to 50% emergence, days to 50% flowering, and panicle length. Compared to the other variety-fertilizer combinations analyzed, the study showed that the Quncho, when applied 135 kg/ha of nitrogen, phosphorus, sulfur, boron (NPSB) fertilizer, had the highest grain yield (2.33 t/ha), straw yield (3.20283 t/ha), total biomass output (5.5328 t/ha), and harvest index (HI) (42%). The Quncho variety yielded a net benefit of 134,014 Ethiopian Birr and had the highest marginal rate of return (MRR%) at 1060%. These findings indicated that farmers in the area can increase the yield of Tef by applied with 135 kg/ha of NPSB fertilizer together with the Quncho variety. Additional multiseason research is required to confirm the present findings and offer detailed suggestions.
1. Introduction
Tef [Eragrostis Tef (Zucc.) Trotter] is a vital cereal crop in Ethiopia, crucial for food security and income [1]. However, its productivity in the Tembaro Special District and nationwide remains below potential, with an average yield of 1.748 t/ha compared to the potential of 2.53 t/ha [2–4]. Key constraints include poor soil fertility, inadequate fertilizer use, weed competition, irregular rainfall, lodging, waterlogging, and low-yielding local varieties [5–7].
Blended fertilizers like nitrogen, phosphorus, sulfur, boron(NPSB) show promise in addressing these challenges by improving nutrient availability and crop growth [8–10]. However, research on NPSB’s effects on Tef varieties in Tembaro is limited [11]. This study aimed to evaluate NPSB’s impact on growth, yield, and yield components of different Tef varieties, providing targeted fertilizer recommendations to enhance productivity, income, and food security while minimizing environmental pollution [12].
Despite their potential, comprehensive studies on varietal responses to NPSB rates are scarce, hindering informed decision-making for sustainable farming [13]. This research addressed this gap by assessing varietal performance under varying NPSB rates, aiming to optimize fertilizer use, improve yields, and promote sustainable practices in Tembaro.
- •
To evaluate and compare growth responses of the varieties to NPSB applications.
- •
To determine yield responses of the varieties to NPSB applications.
- •
To analyze NPSB and a variety of interactions on yield components.
- •
To examine economic analysis to assess the profitability of specific varieties and NPSB rates.
2. Materials and Methods
2.1. Description of the Study Area
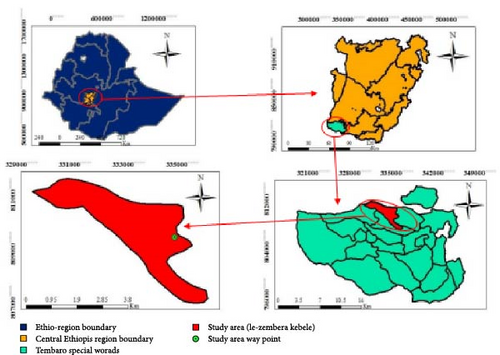
Tembaro Special District, located ~410 km south of Addis Ababa, lies within the coordinates 32°98’00”E to 34°29’00”E and 8°08’00”N to 8°09’00”N, at an elevation of 1748 m.a.s.l., as shown in Figure 1. The area receives an average annual rainfall of 1250 mm, with mean minimum and maximum temperatures of 12.46°C and 27.85°C, respectively, making it suitable for Tef production [14]. The soil is strongly to moderately acidic, with low phosphorus levels, and falls under the clay-loamy textural class [14].
2.2. Treatments and Experimental Design
Four Tef varieties—Tsedey (DZ-Tsedey), Bosset (DZ-Cr-409), Quncho, and a local variety were studied, all developed at Debre Zeit research stations [15, 16]. Four NPSB blended fertilizer levels (0, 45, 90, and 135 kg/ha) were applied to evaluate their effects on Tef yield and yield components. The NPSB fertilizer contained 18.9% nitrogen (N), 37.7% phosphorus(P), 6.95% sulfur (S), and 0.1% boron (B) [17]. The experiment followed a randomized complete block design with three replications, totaling 16 treatment combinations.
2.3. Experimental Procedures and Management
Plots were manually leveled, and the field was plowed four times using oxen to achieve optimal tilth. Each plot measured 2 m × 2 m (4 m2), with a net harvested area of 1.8 m × 1.8 m (3.24 m2) containing eight rows. Row, plot, and block spacings were 0.20 m, 0.50 m, and 1 m, respectively. The total experimental area was 405 m2 (40.5 m × 10 m), with a net experimental area of 155.52 m2. Seeds were sown at 7.5 kg/ha, as recommended by Sahle and Altaye [18], using manual drilling in rows spaced 20 cm apart. Blended NPSB fertilizer was applied entirely at sowing, and almost all standard agronomic practices were maintained until harvest.
2.4. Soil Sampling and Analysis
Soil samples were collected in a zigzag pattern before and after harvest from each treatment. Analysis revealed a clay texture and a pH of 5.18, indicating strong acidity [19]. However, since the pH range of 4–8 is suitable for Tef production, confirming the soil’s appropriateness [20].
2.5. Phenological Data and Growth Parameters
Days to emergence, flowering, and physiological maturity were recorded. Randomly selected plants were measured for height, panicle length, total tillers, and productive tillers. The lodging percentage was visually assessed on a 0–4 scale based on stem inclination.
2.6. Yield and Yield Components
Grain yield was determined from the 3.24 m2 net plot area, manually threshed, and weighed. Total biomass yield was measured after sun-drying the above-ground biomass, with straw yield calculated as the difference between total biomass and grain yield. Thousand-seed weight was determined by counting and weighing 1,000 seeds. The HI was calculated as the ratio of grain yield to total biomass yield [21].
2.7. Statistical Analysis
Data were tested for normality and analyzed using analysis of variance (ANOVA) in SAS 9.4. Fisher’s least significance difference (LSD) test (α = 0.05) was used to assess significant treatment effects [22]. Pearson’s correlation coefficients were calculated to evaluate trait relationships [23].
2.8. Partial Budget Analysis
A partial budget analysis assessed the financial viability of treatments. Yields were adjusted downward by 10% to align with farmer expectations. Input costs (fertilizers, labor, and Tef) were based on market prices. Dominance analysis identified profitable treatments, and the marginal rate of return (MRR) was calculated between treatment pairs. Net benefits and other economic indicators were derived using CIMMYT guidelines [24, 25].
3. Results and Discussion
3.1. Soil Analysis
The study area’s soil is clay-based and slightly acidic, with an initial pH of 5.18, as shown in Table 1 [19, 28]. It has low organic carbon (2.15%), medium total nitrogen (0.13%), medium cation exchange capacity (CEC) (18.7 meq/100 g), very low available phosphorus (12.53 ppm), low available sulfur (10.87 ppm), and low available boron (0.69 ppm). Post-harvest, soil properties improved: the pH increased to 5.8, organic carbon to 2.2%, total nitrogen to 0.14%, CEC to 22.5 meq/100 g [26], available phosphorus to 18.4 ppm, available sulfur to 11.5 ppm, and available boron to 0.73 ppm [27].
| Soil characters | Values | Rating | Source | |
|---|---|---|---|---|
| Before | After | |||
| Sand (%) | 32 | 32.5 | — | — |
| Clay (%) | 46 | 46 | — | — |
| Silt (%) | 22 | 21.5 | — | — |
| Texture class | — | — | Clay | [24] |
| pH (by 1 : 2.5 soil to water ratio) | 5.18 | 5.8 | Slightly acidic | [19] |
| Organic carbon (%) | 2.15 | 2.2 | Low | [19] |
| Total nitrogen (%) | 0.13 | 0.14 | Medium | [19] |
| CEC (meq/100 g of soil) | 18.7 | 22.5 | Medium | [26] |
| Available phosphorous (ppm) | 12.53 | 18.4 | Very low | [27] |
| Available sulfur (ppm) | 10.87 | 11.5 | Low | [27] |
| Available boron (ppm) | 0.69 | 0.73 | Low | [27] |
As the application rates of NPSB fertilizer increased, the residual nutrient levels in the soil showed a corresponding rise after crop harvest across all treatment levels. This trend indicates that higher fertilizer doses led to greater nutrient accumulation in the soil, likely due to the surplus of applied nutrients that were not fully utilized by the crop during the growing season. Recent studies by Desta and Almayehu [29] demonstrated that increased NPSB fertilizer application led to elevated levels of N, P, S, and B in the soil post-harvest, with P showing the most significant accumulation due to its low-mobility and high-fixation capacity in the soil.
3.2. Days to 50% Emergence, Flowering and Panicle Length
The time to 50% emergence varied significantly among Tef varieties. Bosset took the longest time to emerge (7.75 days), while Cross-37 had the shortest emergence time (6.5 days). The local variety showed an intermediate emergence time, averaging 6.58 days (Table 2). This variation can be attributed to a combination of environmental and genetic factors. Genetic diversity, in particular, influences germination rates through differences in seed coat characteristics, metabolic pathways, and seed vigor [30].
| Variety | Days to 50% emergence | Days to 50% flowering | Panicle length (cm) |
|---|---|---|---|
| Quncho | 7.08 ± 0.63b | 58.7 ± 1.70a | 33.68 ± 2.87a |
| Cross-37 | 6.5 ± 0.58c | 52.8 ± 1.53b | 33.04 ± 2.81a |
| Bosset | 7.75 ± 0.69a | 52.9 ± 1.53b | 30.64 ± 2.61b |
| Local | 6.58 ± 0.59a | 58.2 ± 1.68a | 27.23 ± 2.32c |
| LSD (5%) | 0.52 | 1.34 | 2.2 |
| NPSB (kg/ha) | |||
| 0 | 7.2 ± 0.64 | 48.75 ± 1.41c | 26.15 ± 2.23c |
| 45 | 7.0 ± 0.62 | 58.83 ± 1.70a | 31.58 ± 2.69b |
| 90 | 6.9 ± 0.61 | 58.33 ± 1.69a | 32.37 ± 2.76ba |
| 135 | 6.8 ± 0.61 | 58.67 ± 1.70a | 34.5 ± 2.94a |
| LSD (5%) | NS | 1.34 | 2.04 |
| CV (%) | 8.9 | 2.89 | 8.51 |
- Note: Same superscript letters are not significantly different at 5% level of significance. Bold values are used to separate mean values from LSD (0.05) and CV (%).
For days to 50% flowering, Quncho (58.7 days) and the local variety (58.2 days) exhibited the longest durations, while Bosset (52.9 days) and Cross-37 (52.8 days) flowered earlier. These differences are likely due to genetic traits that affect photoperiod sensitivity and developmental timing [31]. Additionally, the application of NPSB fertilizer significantly influenced flowering duration. At a rate of 45 kg/ha, flowering time increased to 58.83 days compared to 48.75 days without fertilizer. However, higher application rates (90 and 135 kg/ha) showed similar effects on flowering time (Table 3). This suggests that nutrient availability, particularly from NPSB, plays a critical role in regulating growth stages by enhancing metabolic processes associated with flowering [32].
| Tef varieties | NPSB (kg/ha) | TN (/plant) | PT (/plant) | PH (cm) | LI (%) | PM (days) | BM (kg/ha) | SY (kg/ha) | GY (t/ha) | HI (%) | TSW (gm) |
|---|---|---|---|---|---|---|---|---|---|---|---|
| Quncho | 0 | 3.4cd | 2.17hg | 77.4e | 22.33j | 93.33b | 2051h | 1384.3h | 0.667i | 0.327fe | 0.303edgf |
| 45 | 3.77b | 3c | 97.9bc | 37edf | 99.67a | 3159.7f | 2016.3fg | 1.1.43g | 0.36dc | 0.337bdac | |
| 90 | 4.7a | 3.87b | 104.4ba | 41.33cd | 98.33a | 4687.4c | 3004.1bdac | 1683d | 0.36dc | 0.313ebdcf | |
| 135 | 4.67a | 4.37a | 109.73a | 44b | 99a | 5532.8a | 3202.8a | 2.33a | 0.42a | 0.298edgf | |
| Tsedey | 0 | 2.5gh | 2.33dgfe | 76.67h | 18k | 81d | 1778.3i | 1285ih | 0.493j | 0.28g | 0.21i |
| 45 | 2.67gf | 2.47dce | 88.87d | 34.33ef | 83.33dc | 2732.7g | 1819.7g | 0.913h | 0.33dfe | 0.287egf | |
| 90 | 3.2de | 2.77dce | 99.8b | 36gf | 81.33d | 4487.3dc | 2964bdc | 1.523e | 0.34dfe | 0.31edcf | |
| 135 | 3.3cde | 3c | 101.73b | 37.33ed | 82.33d | 4757.7c | 3162.7ba | 1.923c | 0.40ba | 0.343bac | |
| Bosset | 0 | 2.8f | 2.17hg | 78e | 13.33l | 86.67c | 1637.9i | 1061.2i | 0.577ji | 0.35dce | 0.32ebdacf |
| 45 | 3.37cde | 2.53dfe | 91.4dc | 28hi | 84.67dc | 2966.7gf | 1840g | 1.127g | 0.38bc | 0.434bac | |
| 90 | 4.43a | 2.7dce | 91.73dc | 30h | 82.67d | 4577c | 2927dc | 1.56d | 0.36bc | 0.357a | |
| 135 | 4.6a | 2.8dc | 97.67 bc | 31hg | 84dc | 5141.8b | 3105bac | 2.037b | 0.39ba | 0.353ba | |
| Local | 0 | 2.27h | 1.07 i | 66.5f | 25.67i | 92b | 1734.5i | 1227.8ih | 0.507j | 0.29g | 0.237hi |
| 45 | 3.1e | 2.1h | 88.8d | 39.33cd | 99a | 3061.7f | 2191.7fe | 0.87h | 0.28g | 0.267hg | |
| 90 | 3.57cd | 2.43hgfe | 98.73bc | 43.33b | 99.33a | 3449.2e | 2365.9e | 1.083g | 0.31gf | 0.283gh | |
| 135 | 3.77b | 2.8dc | 110a | 47.33a | 99a | 4283d | 2876.3d | 1.407f | 0.33dfe | 0.327ebdac | |
| LSD (0.05) | 0.3 | 0.36 | 7.5 | 3.04 | 3.66 | 268.98 | 227.28 | 0.92 | 0.0313 | 0.043 | |
| CV (%) | 5.1 | 8.07 | 4.86 | 5.55 | 2.43 | 4.6 | 5.99 | 4.43 | 5.43 | 8.5 | |
- Note: Mean values in the column followed by the same letters are not statistically different. Bold values are used to separate means from LSD (0.05) and CV (%) and well organized.
- Abbreviation: LSD, least significant difference
Panicle length also showed significant variation among varieties and in response to NPSB application. Quncho produced the longest panicles, while the local variety had the shortest. Higher rates of NPSB application consistently increased panicle length, which aligns with previous studies demonstrating that adequate nutrient availability improves morphological traits in crops [31, 32].
3.2.1. Effects of Blended Fertilizers and Varieties on Total and Productive Tiller Count
The interaction effects significantly influenced the total and productive tiller counts of the varieties (Table 3). Quncho consistently showed the highest total tiller counts across NPSB rates of 90 and 135 kg/ha, indicating a strong response to nitrogen and phosphorus. Higher fertilizer rates increased tiller counts, which is consistent with studies showing that incorporated fertilizers enhance productive tillers [33, 34]. While blended fertilizers provide essential nutrients, it is possible that more fertile tillers could be produced. These results align with [35], which found no increase in productive tillers when NPS fertilization rose from 120 to 135 kg/ha. Quncho outperformed the other varieties at 135 kg NPSB/ha, achieving the highest productive tiller count, while the Local variety had significantly lower across all rates.
3.2.2. Effects on Plant Height
Quncho reached the highest plant height (109.73 cm) at 135 kg/ha NPSB. The local variety also grew significantly, peaking at 110 cm at the highest NPSB rate. In contrast, Tsedey and Bosset had lower maximum heights (101.73 cm and 97.67 cm, respectively) at their optimal NPSB rates (Table 3). Studies [36–40] attribute increased plant height to enhanced nitrogen levels, which promote elongation and vegetative growth. These findings align with [34], highlighting varietal differences in response to nitrogen rates.
3.2.3. Effects on Lodging Index
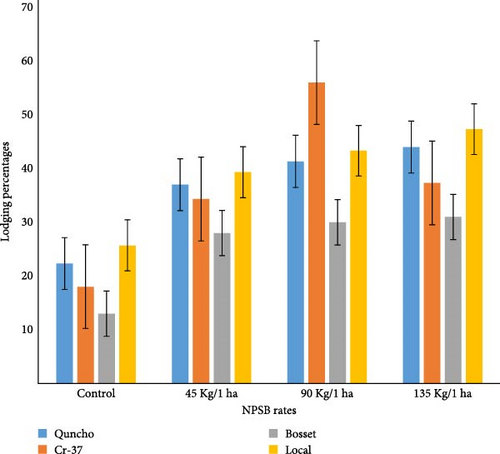
The lodging index, which measures susceptibility to lodging, revealed that Quncho had the highest lodging percentage (44%) at 135 kg/ha (Table 3, Figure 2). Increased nitrogen applications correlated with higher lodging incidence, likely due to greater plant height, stem elongation, and vegetative growth. Bosset showed the lowest lodging index, particularly at 0 kg/ha (13.33%).
These findings align with [41], which linked excessive fertilizer use to lodging in Tef, and [42], which noted significant lodging rates with nitrogen applications above 60 kg/ha. The results also match [43], which reported a 74% lodging rate at 64/46 kg/ha N/P2O5, and [34], which identified a maximum NPK application rate of 138 kg N/ha, 55 kg P/ha, and 0 kg K2O/ha.
3.2.4. Effects on Days to Physiological Maturity
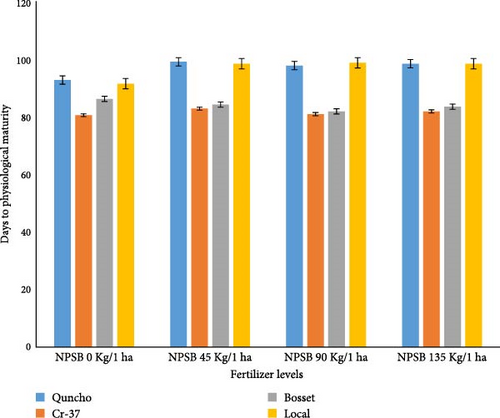
The ANOVA showed a significant interaction (p < 0.05) between variety and NPSB fertilizer rates on physiological maturity (Table 3 and Figure 3). The local variety reached the longest mean physiological maturity (99 days) at 135 kg/ha NPSB, statistically similar to its performance at 45 and 90 kg/ha, as well as the Quncho variety across all NPSB rates (135, 90, and 45 kg/ha). In contrast, the Cross-37 variety had the shortest maturity (81 days) in the control plot (0 kg/ha). Physiological maturity increased with higher NPSB rates (0–135 kg/ha) [44], likely due to the balanced nutrient composition promoting optimal growth [31]. The shorter maturity in the control plot may reflect nutrient limitations [45].
3.2.5. Effects on Total Biomass and Straw Yield
Blended NPSB fertilizer application significantly (p < 0.05) influenced total biomass and straw yields of Tef (Table 3). At 135 kg NPSB/ha, Quncho produced the highest biomass yield (5532.8 kg/ha), a substantial increase from 2051 kg/ha without fertilizer. Bosset and Tsedey showed moderate increases, reaching 5141.8 kg/ha and 4757.7 kg/ha, respectively, while the Local variety had the lowest response, peaking at 4283 kg/ha. For straw yield, Quncho again outperformed other varieties, ranging from 1384.3 kg/ha to 3202.8 kg/ha, making it ideal for farmers prioritizing both grain and straw production. Tsedey followed closely, while the Local variety consistently yielded the least (1227.8–2876.3 kg/ha). Studies [46–48] confirm that blended fertilizers enhance biomass and straw yields, with 100 kg NPSB/ha significantly improving straw yield, improved straw quality, and [50] highlighted the benefits of combining blended fertilizers with conservation agriculture for enhanced straw yield and soil fertility in Tef cultivation.
3.2.6. Effects on Grain Yield
A significant interaction between Tef varieties and NPSB rates was observed for grain yield (Table 3 and Figure 4). Quncho achieved the highest yield (2.33 t/ha) at 135 kg NPSB/ha, demonstrating strong fertilizer responsiveness. Tsedey and Bosset followed with 1.9 t/ha and 2.037 t/ha, respectively, while the local variety had the lowest yield (1.4 t/ha), indicating minimal response to NPSB. These findings align with studies in southern Ethiopia [32], where Tef varieties responded positively to NPSB, emphasizing the role of nutrient availability in yield enhancement. Similar results were reported by Woubshet et al. [33], where 150 kg/ha NPSB combined with compost improved Tef production, and by Tagesse and Seifu [51], where 200 kg/ha NPSB with 92 kg/ha nitrogen yielded the highest output, no significant yield differences between 100 and 150 kg/ha NPSB across Tef varieties.
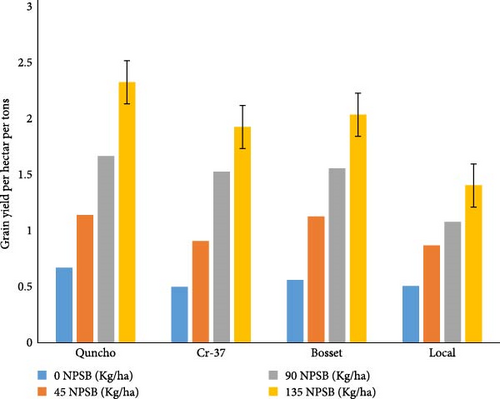
For nutrient-deficient soils, applying 135 kg/ha NPSB with high-yield varieties like Quncho is recommended [8, 53]. Boron application, combined with micronutrients, can further enhance yields [8].
3.2.7. Effects on Thousand-Seed Weight and HI
The study revealed significant interactions between the variety and NPSB fertilizer rates on thousand-seed weight and HI. The Bosset and Quncho varieties, combined with 135 kg/ha NPSB, achieved the highest seed weight (0.357 g) and HI (42%). These results align with previous studies demonstrating that blended NPSZnB and recommended N fertilizers optimize seed weights [54]. The positive effects on seed weight and HI may be attributed to enhanced nutrient uptake and utilization, leading to improved crop productivity [40]. Additionally, the findings are consistent with research indicating that blended fertilizers significantly enhance thousand-seed weight and HI [33].
3.3. Correlations and Regressions
The HI, reflecting the ratio of grain yield to total biomass, exhibits a moderately strong positive correlation (r = 0.65 ∗∗) with grain yield, emphasizing the role of efficient resource partitioning in enhancing yield [55, 56]. Tiller number per plant shows a strong positive correlation (r = 0.80 ∗∗∗) with grain yield, consistent with prior research [57], as more tillers typically increase panicle production and grain number. Plant height has a moderate positive correlation (r = 0.56 ∗∗∗) with grain yield, likely due to better light interception and resource utilization in taller plants. Panicle length is strongly correlated (r = 0.79 ∗∗) with grain yield, as longer panicles often support more spikelets and grains, directly boosting yield potential [57] (Table 4).
| DE | TN | DM | PT | CL | PH | PL | LI | BM | SY | GY | HI | TS | |
|---|---|---|---|---|---|---|---|---|---|---|---|---|---|
| DE | 1 | 0.19ns | 0.005ns | 0.24ns | 0.10ns | 0.02ns | 0.10ns | 0.16ns | 0.10ns | 0.1ns | 0.010ns | 0.27ns | 0.32 ∗ |
| TN | — | 1 | 0.3 ∗ | 0.77 ∗∗∗ | 0.44 ∗ | 0.67 ∗∗ | 0.56 ∗∗ | 0.77 ∗∗∗ | 0.79 ∗∗ | 0.73 ∗∗ | 0.80 ∗∗ | 0.64 ∗∗ | 0.55 ∗∗ |
| DM | — | — | 1 | 0.51 ∗∗ | 0.07ns | 0.26ns | 0.01ns | 0.15ns | 0.07ns | 0.07ns | 0.02ns | 0.10ns | 0.11ns |
| PT | — | — | — | 1 | 0.13ns | 0.005ns | 0.19ns | 0.13ns | 0.005ns | 0.19ns | 0.13ns | 0.005ns | 0.37 ∗ |
| CL | — | — | — | — | 1 | 0.67 ∗∗ | 0.56 ∗∗ | 0.77 ∗∗∗ | 0.79 ∗∗ | 0.73 ∗∗ | 0.67 ∗∗ | 0.56 ∗∗ | 0.31 ∗ |
| PH | — | — | — | — | — | 1 | 0.02ns | 0.0.4ns | 0.56 ∗∗ | 0.77 ∗∗∗ | 0.79 ∗∗ | 0.73 ∗∗ | 0.45 ∗∗ |
| PL | — | — | — | — | — | — | 1 | 0.46 ∗∗ | 0.67 ∗∗ | 0.56 ∗∗ | 0.77 ∗∗∗ | 0.79 ∗∗ | 0.49 ∗∗ |
| LI | — | — | — | — | — | — | — | 1 | 0.7 ∗∗ | 0.48 ∗∗ | 0.46 ∗∗ | 0.55 ∗∗ | 0.42 ∗∗ |
| BM | — | — | — | — | — | — | — | — | 1 | 0.01ns | 0.15ns | 0.07ns | 0.49 ∗∗ |
| SY | — | — | — | — | — | — | — | — | — | 1 | 0.92 ∗∗ | 0.005ns | 0.46 ∗∗ |
| GY | — | — | — | — | — | — | — | — | — | — | 1 | 0.78 ∗∗ | 0.53 ∗∗ |
| HI | — | — | — | — | — | — | — | — | — | — | — | 1 | 0.65 ∗∗ |
| TS | — | — | — | — | — | — | — | — | — | — | — | — | 1 |
- Abbreviations: BM, biomass; DE, days to emergence; DM, days to maturity; GY, grain yield; HI, harvest index; LI, lodging index; PH, plant height; PL, panicle length; PT, productive tillers per plant; SY, straw yield; TN, total tillers; TSW, thousand seed weight.
- ∗ for 0.05, ∗∗ 0.01, and ∗∗∗ level for 0.001.
3.4. Partial Budget Analysis
The Quncho variety, when paired with 135 kg NPSB/ha, achieved the highest net benefit of 215,058.7 Birr/ha, while the control plots for the same variety yielded the lowest net benefit of 34,499.22 Birr/ha (Table 5). These findings emphasize the importance of optimizing crop inputs and agronomic practices to enhance farmer profitability, aligning with the research of [58]. Studies by Abraha et al. [59] further demonstrated that combining balanced fertilizers with high-yielding varieties significantly boosted net benefits for smallholder farmers in similar agroecological zones [29, 60]. These results highlight the necessity of adopting science-based agricultural practices to improve both farm profitability and sustainability.
| Tef varieties | NPSB rate (kg/ha) | AJGY | AJSY | TVC | TR | NB | MRR (%) |
|---|---|---|---|---|---|---|---|
| Local | 0 | 456 | 1105.05 | 15,460.7 | 49,950.3 | 34,489.6 | — |
| Bosset | 0 | 519 | 955.11 | 15,711.3 | 62,820.66 | 47,109.36 | — |
| Cr-37 | 0 | 444 | 1156.5 | 15,817 | 49,119 | 33,302 | — |
| Quncho | 0 | 390 | 1245.87 | 15,876 | 50,375.22 | 34,499.22 | — |
| Local | 45 | 783 | 1972.5 | 27,238.9 | 86,220 | 58,981.1 | 2008 |
| Bosset | 45 | 1014 | 1656 | 27,489.5 | 121,476 | 93,986.5 | 399 |
| Cr-37 | 45 | 822 | 1637.73 | 27,595.2 | 100,246.4 | 72,651.18 | 335 |
| Quncho | 45 | 1029 | 1814.7 | 27,654.2 | 124,078.2 | 96,424 | 530 |
| Local | 90 | 975 | 2129.28 | 29,865.1 | 105,400.7 | 75,535.58 | 295 |
| Bosset | 90 | 1485 | 2634.3 | 30,115.7 | 179,155.8 | 149,040.1 | 708 |
| Cr-37 | 90 | 1371 | 2667.6 | 30,221.4 | 166,815.6 | 136,594.2 | 720 |
| Quncho | 90 | 1515 | 2703.66 | 30,280.4 | 182,872 | 152,591.6 | 820 |
| Local | 135 | 1266 | 2588.7 | 32,491.3 | 135,802.2 | 103,310.9 | 405 |
| Bosset | 135 | 1833 | 2794.5 | 32,741.9 | 218,397 | 185,655.1 | 814 |
| Cr-37 | 135 | 1731 | 2846.4 | 32,847.6 | 207,488.4 | 174,640.8 | 830 |
| Quncho | 135 | 2097 | 2882.55 | 32,906.6 | 247965.3 | 215,058.7 | 1060 |
- Note: Whereas prices of Tef = 110 ETB/kg for improved variety; for local cultivate = 95 ETB/kg; cost of NPSB = 58.36 ETB/kg; cost of urea = 55.72 ETB/kg; price of straw = 6.0 ETB/kg; labor cost for fertilizer (NPSB) application = 8 person/ha, each 200 ETB/day; labor cost for urea side dress fertilizer application = 9 person/ha, each 220 ETB/day.
4. Conclusion
Notably, the Quncho variety produced the highest grain yield, straw yield, total biomass, and HI when treated with 135 kg/ha of NPSB fertilizer. This variety not only provided a substantial net benefit but also demonstrated a high MRR, indicating its economic viability for farmers. Therefore, farmers in the region are encouraged to apply 135 kg/ha of NPSB fertilizer with the Quncho variety to improve their yields. To further validate these findings and refine fertilizer recommendations, additional multiseason studies are suggested.
Conflicts of Interest
The authors declare no conflicts of interest.
Author Contributions
Daniel Manore, Hiwot Kelbo, and Melaku Bonkola from Wachemo University’s Department of Plant Science significantly contributed to this research. Daniel Manore supervised the study, prepared, and edited the manuscript. Hiwot Kelbo handled data analysis and language editing, while Melaku Bonkola provided research supervision and review. Temesgen Gebremariam from the Tambaro Special District Agricultural Office designed the field research, collected, and analyzed data. All authors were involved in the research design and approved the final manuscript.
Funding
The authors received no specific funding for this work.
Acknowledgments
We sincerely thank Wachemo University for excellent internet and laboratory facilities, and the Tambaro Special District for invaluable fieldwork support. We also acknowledge Poe and Quillbot for their language editing assistance.
Open Research
Data Availability Statement
The raw data supporting this article’s conclusions will be provided by the corresponding author upon reasonable request, without undue reservation.


