Investigation on Glass Fiber-Reinforced Polymer Bars in Concrete Beams
Abstract
The use of glass fiber-reinforced polymer (GFRP) bars is an innovative approach to replace traditional reinforcement of steel into concrete structures. GFRP bars provide notable benefits like corrosion resistance, electromagnetic neutrality, higher tensile stress by weight ratio, sustainability, and cost-effective construction reducing maintenance cost. However, challenges like brittleness, reduced ductility, and lower elastic modulus limit their practical applications. This research examines the flexural behavior of GFRP-reinforced concrete beams using experimental and numerical methods. Nonlinear finite element analysis (FEM) was performed in ABAQUS, employing a three-dimensional deformable model, concrete damage plasticity (CDP) theory, and detailed material properties for concrete, steel and GFRP. Four-point flexural load conditions were simulated, and mesh sensitive analysis was conducted to ensure model accuracy. Experimental results demonstrated that GFRP-reinforced beams had higher load-bearing capability, but wider cracks and larger deflections compared to steel-reinforced beams. Failure of flexural members primarily due to concrete crushing was observed. Numerical simulations closely exhibited experimental load deflection performance, stress distributions, and failure patterns with accuracy variation of ~10%–16%. This study highlights the potential of FEM for correctly simulating the performance of GFRP-reinforced concrete beams and comparing the numerical outcomes with experimental studies. It was observed that GFRP-reinforced beams had 20% more load-carrying capacity compared to steel-reinforced beams based on grade of concrete and size of reinforcement. Deflection values for GFRP-reinforced beams were higher compared to steel-reinforced beam leading to requirements for serviceability considerations. The outcome of the study exhibited the potential of GFRP as a superior reinforcing material for specific applications.
1. Introduction
1.1. Background
The maintenance and durability [1] of concrete structural members [2] having steel reinforcement [3] is a critical concern in the construction industry. Short life span of steel-reinforced structures in marine environment and high maintenance cost require alternative solutions, and fiber-reinforced bars are considered as promising alternative [4] An fiber-reinforced polymer (FRP) bar is comprised of continuous fibers inserted in polymeric resin’s matrix. The fibers support to take the load; the resin has the ability to bind the fibers together, transmitting the load to the fibers, and protecting the fibers. The volume fraction of fibers notably affects stiffness and strength of the FRP, while the resin type affects the failure mechanism. “Fibers commonly used are glass, carbon, aramid, and basalt.” Glass fibers offer an economical balance between cost and specific strength properties; this makes them preferable to carbon and aramid in most reinforced concrete (RC) applications. Basalt fibers have recently emerged as an alternative to glass fibers. Matrices are commonly thermoset polymeric [5] resins. In their initial form, thermoset resins are usually liquids, or low melting-point solids and they are cured with a catalyst and heat, or a combination of the two. Unlike thermoplastic [4] resins, once cured, solid thermoset resins cannot be converted back to their original liquid form or reshaped. The most common thermosetting resins used in the composites industry are epoxies, polyesters, and vinyl esters. Additives and fillers may be mixed with the resin to impart performance improvements, tailor the performance of the composites, and reduce costs. Recent studies showed that the influence of Nylon 6 (PA6) [6] as a toughening agent in epoxy-based composites can improve mechanical properties maintaining stability under temperature variations. Addition of 7.5% PA6 by weight can significantly improve fracture toughness and tensile strength.
Structures exposed to deicing salts and harsh environmental and other harsh conditions demand specialized protection strategies to mitigate corrosion of steel reinforcements, leading to increased maintenance cost and reduced service life. It is well recognized that the bars made of “glass fiber-reinforced polymer (GFRP)” [7] offer more suitable alternative [8] to steel reinforcing bars in construction using concrete, especially in marine environments [9] due to their resistance to corrosion [10], high strength [11], and low density [12–14]. These attributes make GFRP suitable for application in aggressive environments where traditional steel reinforcement fails to perform adequately. However, GFRP bars show a linear elastic relationship [15] between stress and strain until failure, resulting in brittle failure without warning. Consequently, design guidelines recommend an over-reinforced approach for RC structures to ensure a less catastrophic failure mode with greater deformation. GFRP-reinforced members experience increased deformations and deeper cracks over “steel-reinforced” [16] beams of similar dimensions, caused by the lower elastic modulus of GFRP. Because of this approach, the serviceability limits govern the design of [17] “GFRP-reinforced” [18] concrete. Various strategies are explored over the past two decades [19] to enhance the ductile performance of GFRP strengthened beams and avoid brittle failure. One of the approaches is using hybrid FRP bars containing different fibers [5]. Another approach is hybrid reinforcement with both steel and FRP bars. These methods have shown notable results in recent experimental studies, but still practical application is restrained due to high initial costs. As suggested by ACI 440 guidelines [20], another solution to improve structural performance of such members is using high-grade concrete, which favors over reinforcement to cause failure due to concrete crushing. Higher strength concrete provides pseudo-ductile behavior [21] with bilinear response to flexural loading, although it has minimal impact on increasing cracking loads. To overcome brittle nature, the use of thermoplastic veils has been suggested by researchers inf FRP composites [22]. Recent advancements in preparation technologies and numerical modeling have significantly improved the understanding and performance of GFRP-RC. Kabir and Aghdam [23] demonstrated the application of Bezier-based solutions for nonlinear analysis of FRP-RC members, highlighting the importance of advanced numerical techniques predicting mechanical behavior under diverse loading conditions. Comprehensive examination of the relationship between preparation methodologies and the mechanical properties of FRP composites done by Xian et al. These studies explain the need to explore quantitative relationships between preparation techniques and design improvements to optimize GFRP applications in structural elements. Nima et al. in comprehensive survey on FRP observed that more than 80% research work in the area of GFRP-RC columns and beams have been conducted to understand application of FRP in concrete structure and further study is required to know seismic performance of such members [24]. Gupta, Pal, and Ray [25] suggested that properties and constituent materials FRP composites like type of fibers orientation, matrix can be altered to achieve better properties of such composites.
Table 1 gives a summary of the literature studied to understand various aspects of FRP-reinforced beams based on experimental and analytical studies. Comparative analysis is done based on various parameters like grade of concrete, type of reinforcement, flexure strength, shear strength, and deflection.
| References | Reinforcement type | Concrete grade (MPa) | Findings on bending strength | Findings on shear strength | Findings on deflection |
|---|---|---|---|---|---|
| [26] | BFRP | 30 | Bending strength of BFRP-reinforced beam increased 58.2% compared to steel-reinforced beam | Addition of 2% of basalt fibers enhanced the cracking load by 18% leading to increase in shear strength | With the increase in fiber content maximum midspan deflection decreased |
| [27] | GFRP | 30 and 35 | The ultimate load of GFRP-RC beam was found 32% lower than steel-reinforced beam. Increasing reinforcement ratio from 0.62% to 1,76% load-carrying capacity of GFRP RC beam increased by 58% GFRP RC beams need higher reinforcement ratio to improve flexural performance. | Despite shear reinforcement few beams failed in shear–flexure interaction indicating lower compressive strength of the concrete than expected | GFRP RC beams exhibited 16% higher deflection than steel RC beams |
| [28] | Hybrid reinforcement (GFRP + steel) | 30 | The maximum load-carrying capacity of hybrid GFRP-steel beams was 95% of steel-reinforced beams | Hybrid reinforcement improved crack resistance and structural durability | Hybrid- reinforced beam exhibited 2 times larger deflection compared to steel-reinforced beams |
| [29] | BFRP sheets | 40 | Bending strength of BFRP-reinforced member increased by 78% compared to plain concrete member. | Shear strength was not investigated, but it is observed that BFRP sheet resists the crack propagation and increases the ductility of the member significantly | NA |
| [30] | GFRP | 120 | Bending strength of GFRP-reinforced beam 55% more compared to steel-reinforced beams. GFRP bars in UHP concrete significantly increase flexural strength and ductility. | NA | GFRP RC beams with UHP concrete exhibited 55% higher deflection than steel RC beams |
| [31] | CFRP and GFRP wrapping | 30 | Control beam exposed to fire, laminated with CFRP exhibited 30% increase in flexural strength. Control beam exposed to fire, laminated with GFRP exhibited 35% increase in flexural strength. | NA | Deflection of CFRP/GFRP wrapped beams were higher compared control beam without wrapping |
| [32] | CFRP laminate | 60 | Fire-damaged RC beams with CFRP laminates regained the original load capacity, with 60% increase in load capacity compared to an undamaged reference beam | CFRP laminates increased the shear capacity of the beams. | The stiffness of fire-damaged beams decreased and then increased after CFRP wrapping |
| [33] | GFRP and Steel | 30 | Hybrid-reinforced slab exhibited greater flexural strength compared to only steel-reinforced slab and only GFRP-reinforced slab | NA | Hybrid-reinforced slabs showed lower deflection compared to only GFRP-reinforced slabs. |
- Abbreviations: BFRP, basalt fiber-reinforced polymer; CFRP, carbon fiber-reinforced polymer; UHP, ultrahigh performance.
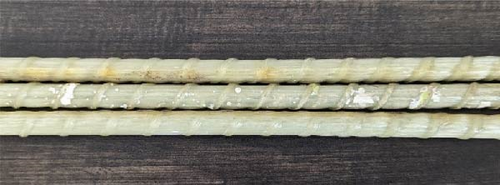
The present study explores the bending performance [34] of GFRP [35] strengthened beams with M 30 and M 40 grades of concrete and with varying diameters of GFRP as shown in Figure 1a.
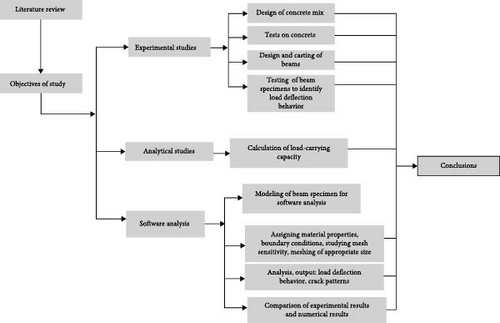
Load-deflection behavior is compared to experimental as well as FEM analysis by using ABAQUS as design software. Using software four-point loading conditions are simulated. Recent studies, such as Kabir and Aghdam [23], have utilized Bezier-based solutions for nonlinear analysis of graphene nanoplate-reinforced beams, providing enhanced accuracy in mechanical response predictions under diverse loading conditions. Finite difference method is a complex numerical method, which can be adopted for modeling GFRP-reinforced beam due to its ability to handle complex material behavior and boundary conditions. This is a numerical technique used for solving differential equations by approximating them with different equations. In this research, numerical models were validated based on concrete grades, and results were compared with experimental findings. Figure 1b presents the methodology used in this study to carry out the research work. Based on the review of literature and after framing the methodology, the scope and limitations of the present study were formulated.
1.2. Scope of the Study
The study investigated the flexural performance of concrete beams using both steel and GFRP reinforcement. Medium grades of concrete, M30 and M40 were used to analyze the load deflection behavior of the beams by experimental studies and numerical modeling using ABAQUS software. Analytical formula is used to calculate the load-carrying capacity of the beam and to compare with the experimental data
1.3. Limitations
The study does not focus explicitly on shear resistance of the specimens and uniform shear reinforcement is adopted. The study does not extensively investigate the long-term durability of GFRP in harsh environmental conditions such as high temperatures and moisture. However, these parameters will be considered in our further research work.
1.4. Methodology Adopted for the Study
2. Experimental Analysis
2.1. Test Samples
All 16 beam samples were tested with a four-point bending test [36] assembly. Among the 16 rectangular beams, eight beams were strengthened by GFRP bars, and eight were strengthened through only steel. The length of beam specimens measured 1200 mm with cross-section [37] of 100 mm × 150 mm. A steel reinforcement of a diameter 8 mm was used at the compression side of the beam. Additionally, secondary reinforcements having diameter [38] of 8 mm and a spacing of 75 mm were fitted to the beam specimens to make them safe in shear. During casting of the beams, a cover of 25 mm was adopted as the clear cover. The cross section (C/S) and the longitudinal section (L/S) are presented in Figure 2. Table 2 presents [2] the specimen details. The test observations were recorded, and cracks in the specimens were marked during the test and at the stage of failure.

| Specimen ID | Nos. | C/S (mm2) | Concrete grade | Tension reinforcement | Shear reinforcement (steel) | Top reinforcement (steel) | |||
|---|---|---|---|---|---|---|---|---|---|
| GFRP bar | Steel bar | ||||||||
Dia. (ø) (mm) |
No | Dia. (ø) (mm) |
No | ||||||
| M30S10 | 2 | 100 × 150 | M30 | — | — | 10 | 2 | 2 # 8 mm 75 mm c/c | 2 # 8 mm |
| M30S08 | 2 | 100 × 150 | — | — | 08 | 2 | |||
| M30G10 | 2 | 100 × 150 | 10 | 02 | — | — | |||
| M30G08 | 2 | 100 × 150 | 08 | 02 | — | — | |||
| M40S10 | 2 | 100 × 150 | M40 | — | — | 10 | 2 | 2 # 8 mm 75 mm c/c | 2 # 8 mm |
| M40S08 | 2 | 100 × 150 | — | — | 08 | 2 | |||
| M40G10 | 2 | 100 × 150 | 10 | 02 | — | — | |||
| M40G08 | 2 | 100 × 150 | 08 | 02 | — | — | |||
- Note: #, diameter; 08, diameters of the bar M30; G, GFRP 10; M40, grades of concrete.
- Abbreviations: C/S, cross section; S, Steel.
2.2. Test Specimens and Testing Set Up
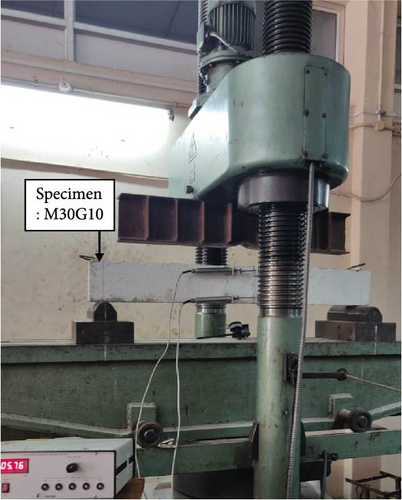
The specimens tested on a loading frame assembly of 50 T. Dial gauges were fitted to the bottom side of the central span of the beam specimen to calculate the displacement. Figure 3 shows the testing assembly of the experimental study.
2.3. Materials and Mix Proportions
2.3.1. Concrete Ingredients
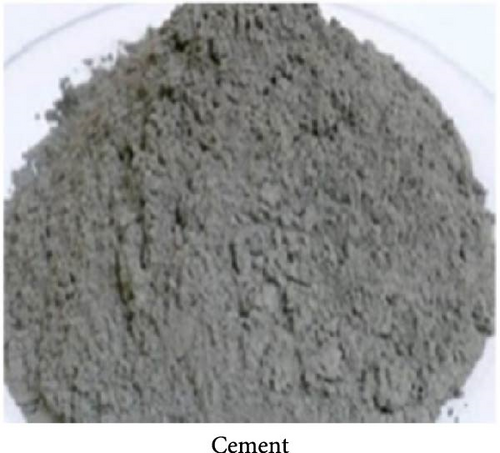
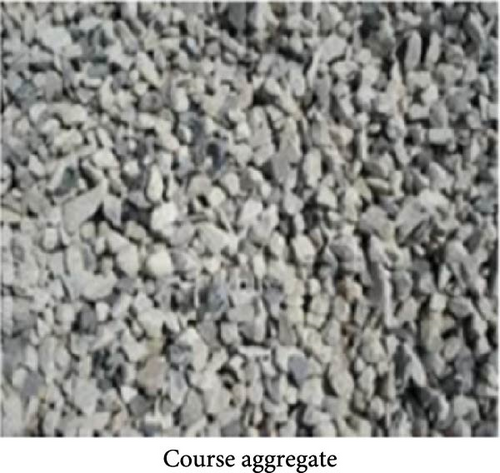
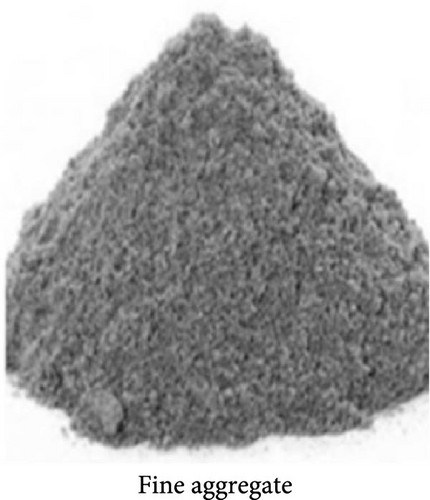
M30 grade and M40 grade concrete were used in this study. A “53-grade Portland Pozzolana Cement (PPC),” as shown in Figure 4a, having specific gravity of 2.97 was used. The coarse aggregates shown in Figure 4b were tested as per IS 2386-1997 and IS: 383-1970 (reaffirmed 2002). The specific gravity of aggregate was 2.62. M-sand or manufactured sand confirming the second zone is used, as shown in Figure 4c. The properties were tested according to the guidelines provided by IS 383-1970 (Reaffirmed 2002). The specific gravity [39] of the fine aggregate identified as 2.60. Potable water was used for experimental purposes. According to the IS 456-2000 standard, the pH lies between 6 and 8.
2.3.2. Mix Design
For preparation, a conventional concrete mix design of grades M30 and M40, as per the recommendation of the IS 10262-2019 calculation, is performed from the material properties. The mix design proportion per meter cube of the concrete is specified in Table 3. Table 4 shows the properties of concrete.
| Grade | Cement (kg) |
Coarse aggregate (kg) |
Fine aggregate (kg) |
Water cement ratio | Water (kg) | Mix proportion |
|---|---|---|---|---|---|---|
| M 30 | 450.00 | 500.00 | 892.00 | 0.40 | 180.00 | 1:1.25:2.23 |
| M 40 | 450.00 | 517.50 | 945.00 | 0.38 | 171.00 | 1:1.15:2.10 |
| Grade | W/C ratio | Compressive strength (N/mm2) | Split tensile strength (N/mm2) | Flexural strength (N/mm2) |
|---|---|---|---|---|
| M 30 | 0.40 | 38.00 | 2.75 | 4.60 |
| M 40 | 0.38 | 44.50 | 3.70 | 5.80 |
2.3.3. Reinforcement
The core reinforcement comprised of 10 and 8 mm GFRP bars manufactured by KOMAR Ltd., Russia, and tested at the URAL Scientific and Research Institute of Construction Materials, which were used to conduct the experiments. Table 5 exhibits the important properties of GFRP bars [40].
| Strength in tension (MPa) | Elastic modulus (GPa) | Relative extension (%) |
|---|---|---|
| 1100 | 51.5 | 2.04 |
8 mm diameter steel HYSD [41] bars [42] of Grade Fe 415 were used as shear reinforcement and hanger bars, respectively. Diameters of 8 and 10 mm are considered to constitute the main reinforcement in the steel-reinforced beam specimens.
3. Analytical Investigations
In Table 6, bending stress [46] is presented along with the “reinforcement ratio”. The theoretical moment capacity (Muth) of each beam [47] specimen is assessed according to the concrete strength and actual tensile strength of the longitudinal reinforcement.
| Beam | ρs | ff (N/mm2) | Mu,th (kN-m) | Pu,th (kN) | Pu,exp (kN) | ||
|---|---|---|---|---|---|---|---|
| M30S08 | 0.87 | — | — | 4.20 | 21.00 | 35.00 | 1.66 |
| M30S10 | 1.4 | — | — | 5.86 | 29.30 | 43.00 | 1.47 |
| M40S08 | 0.87 | — | — | 4.39 | 21.95 | 44.00 | 2.00 |
| M40S10 | 1.4 | — | — | 6.31 | 31.55 | 52.00 | 1.64 |
| M30G08 | — | 0.87 | 583.56 | 5.83 | 29.15 | 45.00 | 1.55 |
| M30G10 | — | 1.4 | 445.00 | 7.15 | 35.75 | 50.00 | 1.39 |
| M40G08 | — | 0.87 | 663.10 | 5.30 | 26.50 | 52.00 | 1.96 |
| M40G10 | — | 1.4 | 506.37 | 7.96 | 40.00 | 60.00 | 1.50 |
The experimental load-carrying capacity (Pu,exp) are compared with theoretical load-carrying capacity (Pu, th) as shown in Table 6. It is observed that experimental results of load-carrying capacities were greater than the theoretical load-carrying capacities. It is due to the fact that the “partial safety factors” for material strength were taken into account in the estimation of theoretical load-carrying capacity. The variation of experimental values over theoretical values is between 24% and 50%.
4. Numerical Analysis
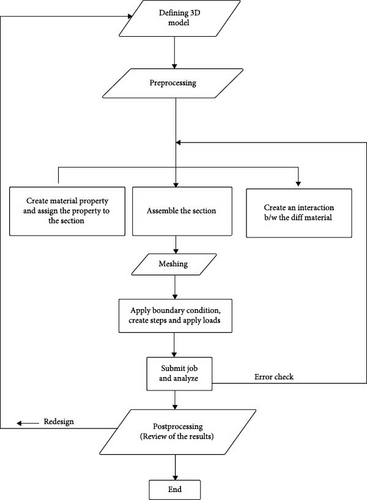
Utilizing the software program “ABAQUS,” a nonlinear analysis was done to evaluate a response of the reinforced beams using steel and GFRP under pure bending. Figure 5 displays a graphical representation of the analysis procedure [48].
4.1. Defining the 3D Model
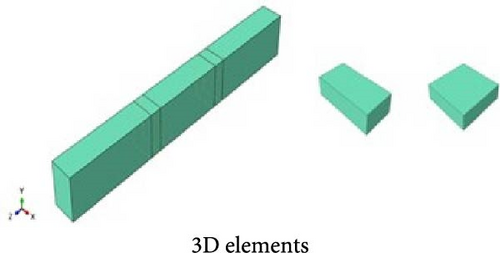
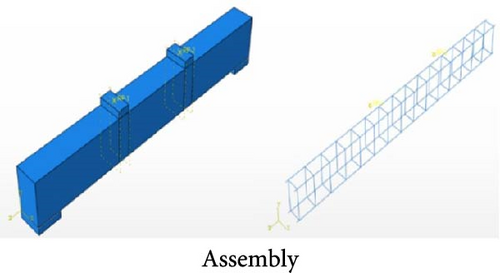
The initial phase of model creation involves defining its geometry. For this study, a three-dimensional, deformable body with a solid, extruded base feature was generated. The process commences with sketching a two-dimensional profile of the beam and supports, followed by extrusion. The modeling is carried out based on the concept of symmetry. The parameters like axis of symmetry, plane, and center of symmetry were considered while defining the geometry of the model [49]. Similarly, a three-dimensional, deformable body with a wire, extruded base feature will be generated. The process commences with sketching a two-dimensional profile of the reinforcement, followed by extrusion. The International System of Units (SI) will be employed, utilizing meters for length, seconds for time, and kilograms for mass. Figure 6a represents the modeling of 3D elements.
4.2. Material Properties
In the model, it is necessary to define and assign material and section properties to the part. For every region of the deformable body, a section property must be specified, which includes the definition of the material used in that region. Table 7 shows the material properties considered in numerical analysis.
| Properties | Value |
|---|---|
| Concrete | |
| Density | 2.5 × 10⁻⁵ N/mm3 |
| Poisson’s ration | 0.2 |
| Young’s modulus (M 30) | 27,386.13 N/mm2 |
| Young’s modulus (M 40) | 31,622.78 N/mm2 |
| Cover | 25 mm |
| Steel | |
| Density | 7.85 × 10⁻⁵ N/mm3 |
| Poisson’s ratio | 0.3 |
| Elastic modulus | 210,000 N/mm2 |
| GFRP | |
| Density | 2.0 × 10⁻⁵ N/mm3 |
| Poisson’s ratio | 0.3 |
| Elastic modulus | 50 N/mm2 |
4.3. Concrete Damage Plasticity
Within ABAQUS, three distinct constitutive models are available for characterizing the inelastic characteristics of concrete. These models include [50] the concrete damaged [21] plasticity (CDP) model, the concrete smeared cracking model (CSCM), and the “brittle cracking concrete” (BCC) model. Notably, the CDP model [51] comprehensively addresses plastic behavior, both tensile and compressive behavior, confinement, and the mechanisms underlying concrete damage. This particular model has the capacity to yield outcomes of high precision and accuracy, particularly when contrasted with alternative models. In direct comparison with steel, concrete displays distinct nonlinear behavior immediately from the outset when subjected to either tension or compression tests. The CDP properties that are used in this analysis are exhibited in Table 8.
| Parameters | Ψ | E | Fb0/fc0 | K | M | |
|---|---|---|---|---|---|---|
| Values | 310 | 0.1 | 1.16 | 0.667 | 0.0001 | |
- Note: Ψ = dilation angle; E = eccentricity; Fb0 = maximum biaxial compressive stress; fc0 = maximum uniaxial compressive stress; K = shape factor; M = viscosity parameter.
4.4. Assembly and Interaction
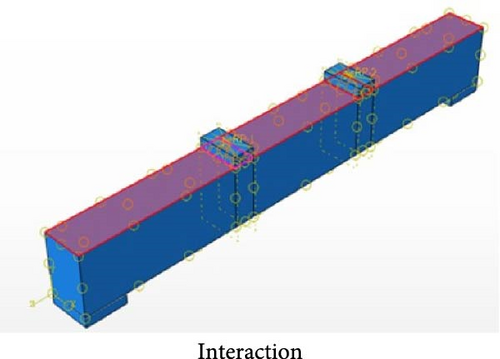
In ABAQUS, an assembly encompasses all the geometries incorporated within the FE model. Figure 6b shows the assembly of the ABAQUS model. General contact interactions provide the capability to define connection between multiple or entire regions within a model using a single interaction. Usually, general “contact interactions” [52] are established for a comprehensive surface that encompasses all exterior faces, shell perimeter edges, edges associated with beams and trusses, and analytical rigid surfaces present in the model. Figure 6c shows the interactions of all the surfaces considered in the assembly. To develop bond [53] stress effect between the concrete and reinforcement, an element of “elastic‒plastic ring” contact was considered, and by reducing the bond strength, the amount of slip [54] between the concrete as well as reinforcement [55] and its effect was considered on the concrete damage-plastic parameters [23, 24]. The software analysis is based on assumption of the perfect bond between bar and concrete ignoring the slip between reinforcement and concrete [25–27]. Based on the literature review, the interface between concrete and GFRP is generally assumed to be perfect. This assumption simplifies the modeling of the beam using software and is commonly used in various studies. Experimental results validate the accuracy of the model.
4.5. Meshing
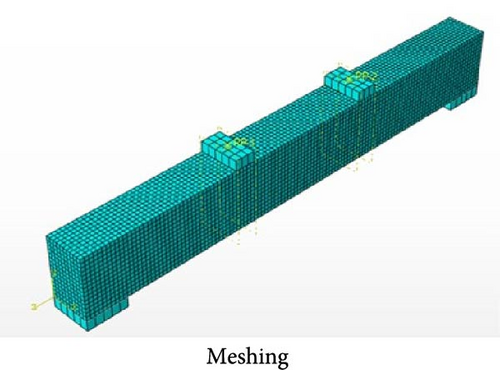
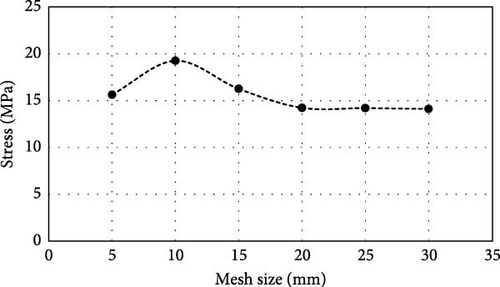
In ABAQUS, meshing involves the process of dividing a three-dimensional geometric model into smaller discrete elements called finite elements [56]. These elements collectively create a mesh, which represents the model computationally for finite element analysis (FEA). Meshing is critical because in analysis it will manage random discretization and irregular geometry. Meshing is done such that the number of interface nodes will be less. Figure 6d shows the meshing adopted in the study. Figure 7 shows the stress vs mesh size values. After 20 mm mesh size, the stress values are constant. Therefore, the mesh size of 20 mm × 20 mm was adopted for the beam. With an optimized size of 20 mm, the model strikes a balance between computational efficiency and accuracy. A coarser mesh size may not capture localized phenomena such as stress concentration near cracks accurately leading to underestimation or overestimation of the load-bearing capacity. The reinforcement bars were 150 mm × 150 mm, the supports were 20 mm × 20 mm, and the stirrups were 30 mm × 30 mm.
5. Results and Discussion
The tests in flexure were carried out on the beams in the case of experimental analysis, and the numerical analysis was performed using ABAQUS as discussed earlier. Table 9 shows the results for various parameters observed during the experimental work.
| Beam ID | Pcr (kN) | Δcr (mm) | Pu, exp (kN) | Δu (mm) | |
|---|---|---|---|---|---|
| M30S08 | 5.00 | 0.20 | 35.00 | 3.69 | |
| M30S10 | 10.00 | 0.31 | 43.00 | 3.21 | |
| M40S08 | 15.00 | 0.40 | 44.00 | 2.81 | |
| M40S10 | 15.00 | 0.09 | 52.00 | 2.50 | |
| M30G08 | 10.00 | 1.00 | 45.00 | 7.70 | |
| M30G10 | 10.00 | 1.50 | 50.00 | 6.80 | |
| M40G08 | 15.00 | 1.00 | 52.00 | 5.84 | |
| M40G10 | 15.00 | 0.6 | 60.00 | 5.51 | |
- Note: Pcr = initial cracking load; Δcr = deflection corresponding to initial cracking load; Pu = maximum load; Δu = deflection Corresponding to maximum load.
5.1. Load‒Deflection Behavior
The load‒deflection performance of a flexure member is crucial. Figure 8a displays the load vs deflection curve for the M30 grade concrete beam with an 8 mm steel reinforcing bar (M30S08) with experimental and numerical data. Figure 8b presents [57] load vs deflection curve of an M30 grade concrete beam consisting of an 8 mm GFRP reinforcing bar (M30G08) with experimental and numerical data. The load vs. deflection curve is linear for GFRP-reinforced members.
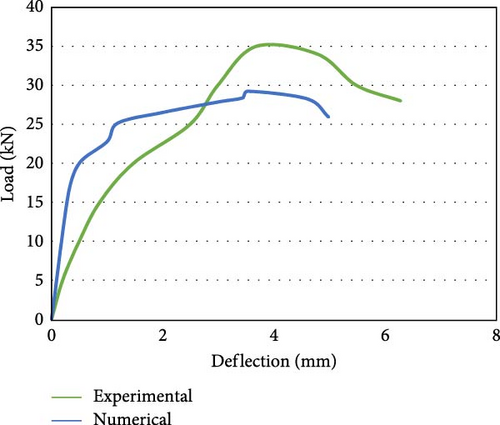
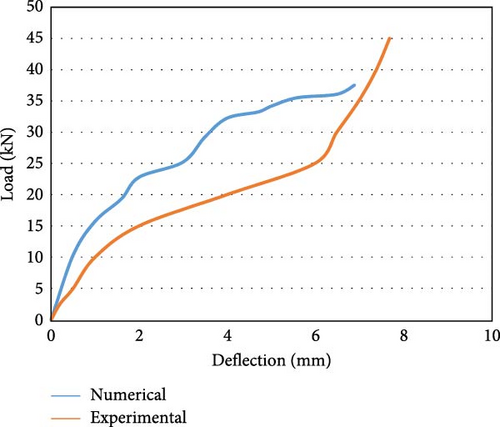
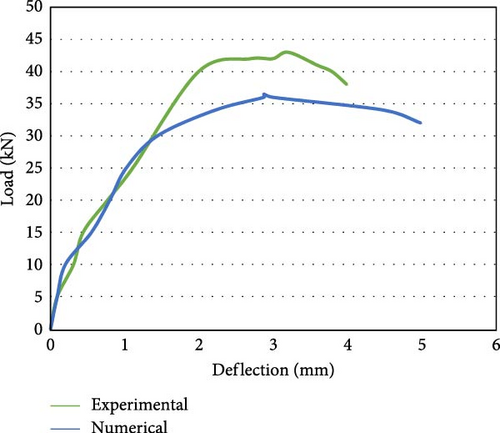
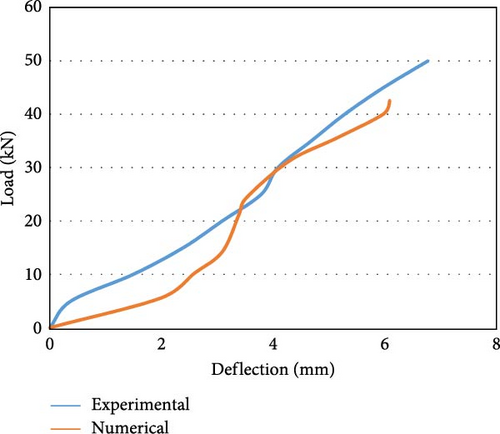
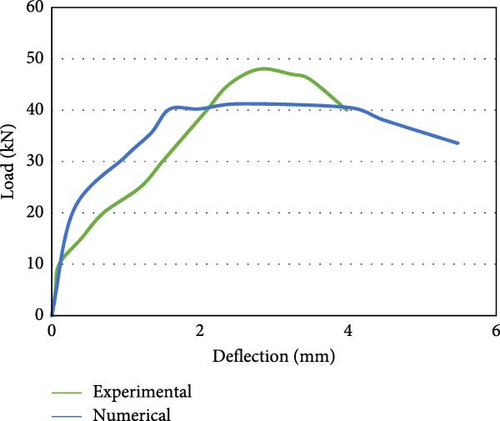
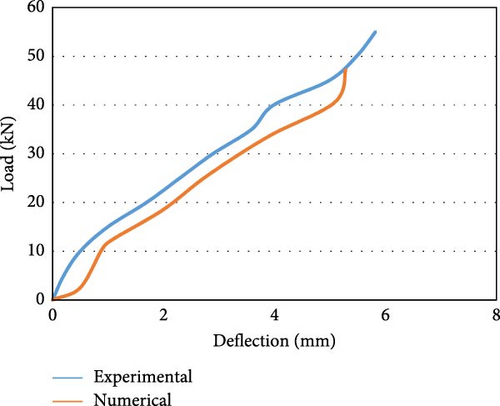
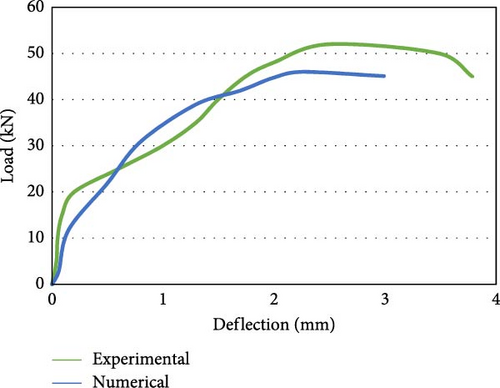
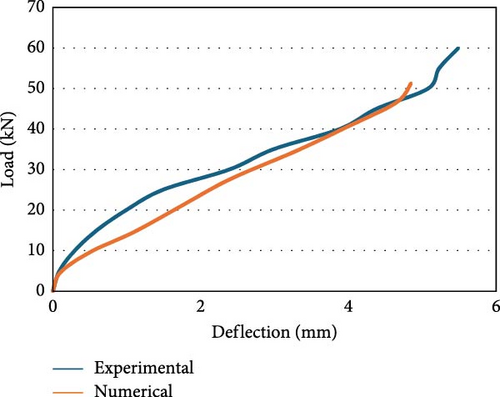
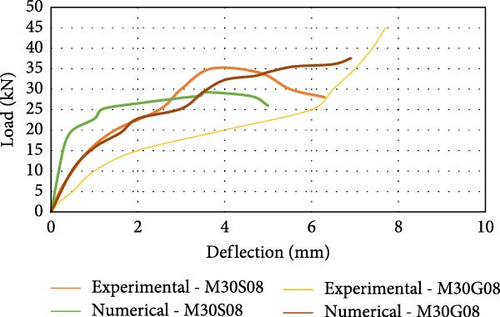
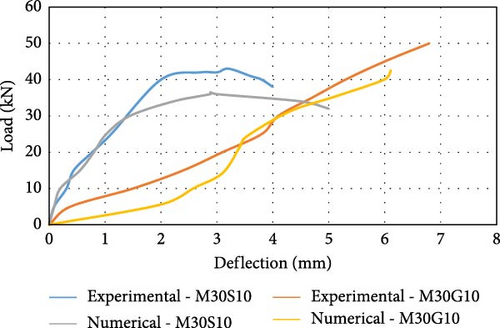
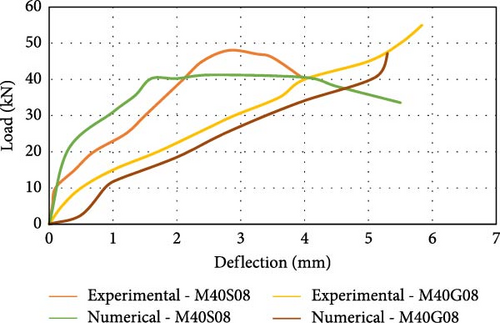
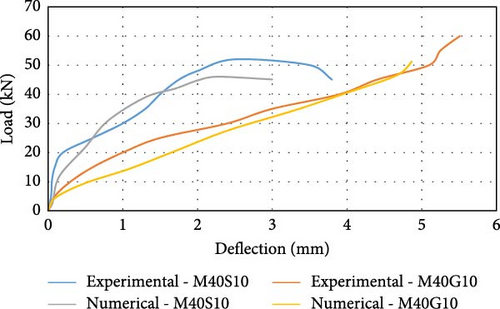
Figure 8c displays the load vs deflection curve for the M30 grade concrete beam with an 10 mm steel reinforcing bar (M30S10) with experimental and numerical data. Figure 8d shows the load vs deflection curve of an M30 grade concrete beam consisting of an 10 mm GFRP reinforcing bar (M30G10) with experimental and numerical data. The load vs. deflection curve is linear for GFRP-reinforced members. Similarly load vs deflection behavior is represented of M40 grade concrete with steel and GFRP reinforcement if following figures form Figure 8e–h.
The maximum capacity to carry the load for the steel-reinforced beam in the experimental work was 35.00 kN, with an extreme deflection of 3.70 mm. Similarly, in the numerical analysis, the highest “load-bearing capacity” [58] of the specimen is 29.20 kN, and the ultimate deflection is 3.55 mm. The “maximum load-carrying” [2] capability of the GFRP-reinforced flexural member in the experimental work is 45.00 kN with deflection at mid span is 7.70 mm. Similarly, in the FEM analysis, the “maximum load-bearing capacity” of the specimen is 37.55 kN, and the mid span deflection is 6.90 mm. The load resisting capability of the GFRP-reinforced flexure member is ~25% greater than the steel-reinforced beam. At the initial stage of loading, the GFRP-reinforced beam is stiff and uncracked. An increase in the load leads to cracks near the central span. At the maximum load, the gradual increase in the load supplements larger defects at a higher rate, and the beam exhibits a linear elastic relation until failure. The maximum load-bearing capability of the steel-reinforced specimen with 10 mm bar in the experimental analysis is 43.00 kN with a deflection of 3.20 mm, which is the maximum reported load-bearing capacity. Similarly, in the numerical analysis, the extreme load-bearing capability of the beam is 36.50 kN, with an extreme deflection of 2.90 mm. The maximum load-bearing capability of the specimen strengthened with GFRP bars in the experimental work is 50.00 kN, and the maximum deflection is 6.80 mm. Similarly, in the numerical analysis, the critical load-carrying capability of the member is 42.50 kN, with a maximum deflection of 6.10 mm. The load-bearing capability of the member reinforced with GFRP was ~15% greater than that of the steel-reinforced beam. It is also observed that the load-bearing capability of the beam strengthened with 8 mm long GFRP bars is equivalent to the load-bearing capability of the flexure member strengthened with 10 mm long steel reinforcement. The reason for the greater decrease in the stiffness of the beams of GFRP reinforcement after the initiation of cracking compared to that of the steel-reinforced beams and the greater deflection is the lower “modulus of elasticity” [2] of these bars and the distinct characteristics of FRP bars related to bond. To maintain the flexural strength, the FRP-reinforced beams are designed as over reinforced sections. Figure 8e depicts the load against deflection behavior for the M40 grade concrete beam with an 8 mm steel reinforcing bar (M40S08) plotted using experimental and numerical analysis data. The extreme load-carrying capability of the beam in the experimental work was 44.00 kN, with a maximum deformation of 2.80 mm at the center. Similarly, in the numerical analysis, the maximum load-carrying capacity of the beam is 41.25 kN, with a maximum deflection of 2.55 mm. Figure 8f shows the load vs. deformation curve for the M40 grade concrete beam with an 8 mm GFRP reinforcing bar (M40G08) using experimental and analytical data. The final load-carrying capacity of the member in the experimental study is 52 kN, and the deflection is 5.85 mm, which is the highest load-bearing capacity. Similarly, in the numerical analysis, the maximum capacity of the beam is 47.20 kN to carry load with a mid-span deflection of 5.30 mm. The load-carrying capability of the member with GFRP reinforcement is ~10% better than the steel-reinforced beam.
Figure 8g shows the load against the deflection behavior of the M40 grade concrete beam with a 10 mm steel reinforcing bar (M40S10) plotted using numerical and experimental analysis data. The highest load-carrying capability of the beam in the experimental work was 52.00 kN, with a deflection of 2.50 mm reported as the maximum. Similarly, in the numerical analysis, the ultimate load-carrying capacity of the beam is 46.00 kN, with a maximum deformation of 2.25 mm at the central span. Figure 8h displays the load vs. deformation curve for the M40 grade concrete beam with a 10 mm GFRP reinforcing bar (M40G10) using experimental and analytical data. The ultimate capability of the beam to carry load in the experimental work was 60.00 kN, with maximum deflection of 5.50 mm. Similarly, in the software analysis, the load-bearing capacity of the beam is 51.20 kN is maximum with a deflection of 4.15 mm. The load-carrying capability of flexure members reinforced with GFRP is ~16% greater than that of steel-reinforced beams. It is also seen that load-bearing capability of the specimen reinforced with 8 mm GFRP bars is in line with the capability of member strengthened with 10 mm steel bars. Figure 8i shows the assessment of the load vs. deflection [59] behavior of the beams reinforced with 8 mm steel bars (M30S08) and 8 mm GFRP (M30G08) bars using experimental and numerical data for M30 grade concrete. An ~16% difference was observed between the experimental and numerical load capacities [60] of the beam, and a difference of 7% was observed between the experimental and numerical deflection values for M30 grade concrete. When GFRP was used as the reinforcing bar in the beam, there was a 25% increase in the percentage of the “load-bearing” capability of the beam compared with that when steel was used as the reinforcing bar. The deflection in the GFRP-reinforced beam is two times greater than that in steel-reinforced beam because of the greater stiffness and lower elastic modulus of the GFRP. Figure 8j shows the comparison of the load vs deflection behavior of the beams reinforced with 10 mm steel bars and 10 mm GFRP bars using experimental and numerical data for M30 grade concrete. An ~15% difference was observed between the “load-bearing capacities” of the beam via experimental and numerical analysis for the steel-reinforced beam, and a difference of 10% was observed between the deflection values via experimental and numerical analysis. A difference of 16% was observed between the load-bearing capacities of the GFRP-reinforced beams via experimental and numerical analyses, and a difference of 11% was observed between the deflection values via experimental and numerical analyses. When GFRP was used as the reinforcing bar in the beam, there was a 15% increase in the percentage of the load-bearing capacity of the beam compared with that when steel was used as the reinforcing bar. The deflection value reported for the beam strengthened with GFRP was twice that of the steel-reinforced beam due to the large stiffness and low elasticity modulus of the GFRP bars.
Figure 8k displays the comparison of the load vs. deflection behavior of the beams reinforced with 8 mm steel bars and 10 mm GFRP bars using experimental and numerical data for M40 grade concrete. An ~12% difference was observed between the load-bearing capacities of the beam via numerical and experimental analysis for the steel-reinforced beam, and a difference of 10% was observed between the deflection values via experimental and numerical analysis. A difference of 16% was observed between the load-bearing capacities of the GFRP-reinforced beams via experimental and numerical analyses, and a difference of 18% was observed between the deflection values via experimental and numerical analyses. As shown in Figure 8l, when GFRP was used as the reinforcing bar in the beam, there was a 16% increase in the percentage of the load-bearing capacity of the beam compared with that when steel was used as the reinforcing bar. The deflection value detected in the beam with GFRP reinforcement is approximately two times greater than that in the beam reinforced with steel because of the larger stiffness and lower modulus of elasticity of the GFRP bars. To overcome this issue, larger cross sections can be used to reduce deflections and stress. Referring to ACI 440 [61] guidelines, creep coefficient can be applied to adjust deflections under long-term loading and higher serviceability limits can be considered to ensure structure remains functional for longer time.
5.2. Mode of Failure and Crack Patterns
Figure 9 represents the cracking patterns observed in the experimental and numerical analyses. The earliest cracks were [57] generally vertical flexural cracks within the tensile region near the continuous moment zone. Existing cracks spread in vertical direction toward [57] the compression side, and tiny branches appeared near the surface of the lower zone [62] of tension till 40% of the ultimate load. The development rate of new cracks drops dramatically at increasing loading stages. Furthermore, existing cracks become larger, particularly the initially developed cracks, before separating into small, short cracks next to the main reinforcement. Cracks originated in the highest bending moment zone and propagated upward toward the compression zone of the concrete. As the load increased, additional cracks appeared in the flexural span of the beam [63], and the cracks within the shear span inclined to the middle zone.


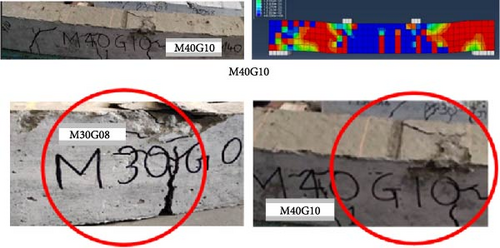
The crack patterns observed during the experimental and numerical analyses indicate that in the steel-reinforced beam, initial cracks form near the tension zone, inclined at ~45°. These cracks can propagate diagonally toward the center. With an increase in load, flexure cracks continue to develop and extend diagonally and vertically, as shown in Figure 9a,b. In the case of the beam reinforced with GFRP, the initial crack pattern in the tension zone is similar [64] to that of the steel-reinforced beam. The beam reinforced with GFRP exhibited fewer flexure cracks, and the cracks were wider than those in the steel-reinforced beam, as exhibited in Figure 9c,d. It was also observed that the failure of the GFRP-reinforced beam was mainly due to concrete crushing, whereas the steel-reinforced beam failed due to steel yielding and concrete crushing. A higher grade of concrete results in a greater load-carrying capacity with greater deformation in the case of the GFRP-reinforced beam. The capacity of FRP-reinforced member in flexure depends on the failure due to concrete crushing or FRP rupture. Figure 10 shows the failure of the section due to concrete crushing.
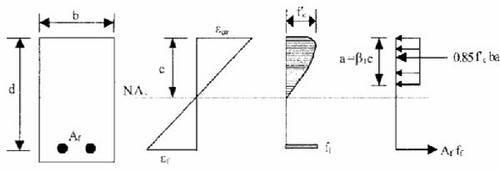
If ρf < ρfb Failure mode is governed by FRP rupture otherwise it will be governed by concrete crushing. Table 10 shows comparative observations on the load-carrying capability, deflection, and failure types for different specimens with GFRP and steel reinforcement with different concrete strengths.
Beam ID |
Ultimate loads (kN) |
Deflection (mm) |
Failure type | |||||
|---|---|---|---|---|---|---|---|---|
| Experimental | Numerical | (%) variation |
Experimental | Numerical | (%) variation |
|||
| M30S08 | 35.00 | 29.25 | 16.00 | 3.70 | 3.55 | 4.00 | Steel yielding and concrete crushing | |
| M30S10 | 43.00 | 36.50 | 15.00 | 3.20 | 2.90 | 9.00 | Steel yielding and concrete crushing | |
| M30G08 | 45.00 | 37.55 | 16.50 | 7.70 | 6.90 | 10.00 | Concrete crushing | |
| M30G10 | 50.00 | 42.50 | 15.00 | 6.80 | 6.10 | 10.00 | Concrete crushing | |
| M40S08 | 44.00 | 40.25 | 10.00 | 2.80 | 2.55 | 9.00 | Steel yielding and concrete crushing | |
| M40S10 | 52.00 | 46.00 | 12.00 | 5.50 | 4.50 | 18.00 | Steel yielding and concrete crushing | |
| M40G08 | 52.00 | 47.20 | 10.00 | 5.85 | 5.30 | 9.00 | Concrete crushing | |
| M40G10 | 60.00 | 51.20 | 16.00 | 5.50 | 4.20 | 20.00 | Concrete crushing | |
5.3. Crack Width
Many design codes set the maximum permissible flexural crack width for steel RC structures to ensure they meet serviceability requirements and [57] to preserve the aesthetic appearance of structure. The design guidelines for FRP allow large width of crack [57] for FRP-reinforced elements in comparison to those reinforced with steel. “CAN/CSA S8063” [65] defines the maximum flexural crack width 0.5 mm for the exterior environments and 0.7 mm for interior exposure to meet serviceability criteria. ACI 440.1R6 also recommends these limits for various cases [66]. The crack width by experimental studies at the flexural zone was calculated by an optical micrometer at sequential load steps. Figure 11 shows that the crack width of GFRP-reinforced beam is very high compared to steel-reinforced beams. Since the stiffness of GFRP bars is less than that of steel bars, wider cracks are observed in “GFRP-reinforced beams” than in steel-reinforced beams.
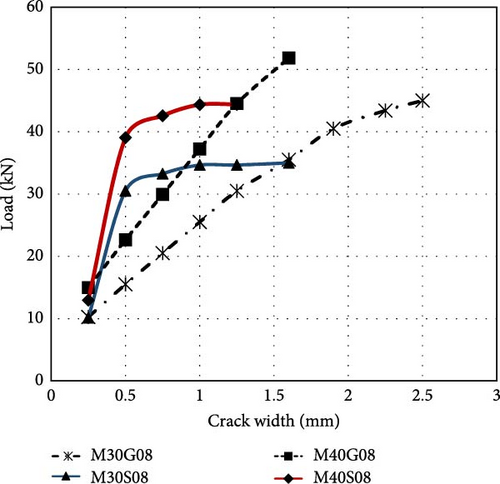
At 30% of ultimate load steel-reinforced beams showed average crack width 0.25 mm, whereas GFRP-reinforced beams showed average crack width 0.4 mm. At 50% of ultimate load steel-reinforced beam demonstrated average crack width 0.4 mm, whereas GFRP beam depicted 1.2 mm average crack width. At 80% of ultimate load average crack width of steel-reinforced beam was 1.00 mm, whereas at GFRP-reinforced beam showed average crack width of 1.50 mm at the same load. At ultimate load, the average crack widths shown by steel and GFRP-reinforced beam were 1.5 and 2.00 mm, respectively. The wider crack widths and large deflections in GFRP-reinforced beam can affect the durability of the beam because serviceability limit states are closely related to crack control and deflection. Closer spacing of stirrups, GFRP bars, and hybrid reinforcement might be necessary for effective crack control.
6. Conclusions
The computational and experimental analysis provided in this study [67] assesses the flexural performance of beams with GFRP and steel reinforcements. GFRP-reinforced beams exhibited 15%–16% more load-bearing capacity and wider cracks than steel-reinforced beams, with typical failure of concrete crushing. Numerical analysis using ABAQUS demonstrated close match with experimental results, with accuracy variation of 10%–16% for load deflection behavior. The use of higher grade of concrete improved the performance of GFRP-reinforced beams, while serviceability issues like crack control and deflections were observed as challenges. These findings demonstrate potential of GFRP bars in improving durability and structural performance especially for environments prone to steel corrosion.
The use of GFRP bars exhibits many advantages such as higher load-carrying capacity, durability in a harsh environment. However, GFRP bars are expensive compared to steel bars, which can impact on the overall cost of the project. To overcome this issue, hybrid reinforcement systems combining steel and GFRP bars have been proposed as cost-effective solutions maintaining balance in practical application and economy. Advanced techniques of manufacturing process such as automated pultrusion and recycled materials in production can lead to economic solution. Literature on life cycle cost analyses indicate that though the initial cost of the project is more, the maintenance cost of the project will be negligible because of the noncorrosive nature of these bars making the GFRP as viable solution for durable and sustainable construction. Application of such material on a large scale will lead to reduce production costs, and it can be the economical alternative for the reinforcement.
7. Future Scope
Further research is required to enhance the characteristics of GFRP bars to improve the bond stress and ductility when used as reinforcement in concrete. The advanced studies to develop hybrid fiber-reinforced polymer or additives to improve their mechanical characterization without affecting the cost are needed. Moreover, research assessing long-term durability of GFRP-reinforced members under varying environmental conditions like elevated temperatures, presence of moisture under sustained loading conditions, and UV exposure with higher grades of concrete are important to validate practical implementation of these materials.
Ethics Statement
On behalf of all authors, the corresponding author declares that we have followed the accepted principles of ethical study, there is no financial or personal conflicts of interest that might have impacted the research reported in this publication. No animal or human subjects were used in this work. This manuscript is an original paper and has not been published in other journals. We also confirm that there is no way our manuscript is in possible conflict with the ethical standards required by the journal.
Conflicts of Interest
The authors declare no conflicts of interest.
Funding
No funding was received for this research.
Acknowledgments
The authors would like to thank Manipal Academy of Higher Education, Manipal, Karnataka, India, for supporting the research studies. The authors also acknowledge their previously submitted preprint, (https://www.researchgate.net/publication/375684951_Flexural_behavior_of_reinforced_concrete_beams_with_steel_and_GFRP_reinforcement), which is appropriately cited in this edited version as per journal guidelines.
Open Research
Data Availability Statement
The data that support the findings of this study are available from the corresponding author upon reasonable request.


