Characterization of Low Visibility and Forecasting Model in Chongqing Central Area
Abstract
By using the hourly visibility, temperature, pressure, humidity, wind, and atmospheric particulate concentration data in Chongqing from 2015 to 2023, the characteristics of low visibility (visibility <1000 m) in Chongqing and the influence of various factors on low visibility in Chongqing were analyzed. The visibility prediction model was established by using the neural network method, and the effect of introducing the PM2.5 concentration factor on low visibility prediction was analyzed and compared. Findings: Low visibility in Chongqing is dominated by precipitation low visibility (PLV), followed by fog low visibility (FLV), with the least proportion of fog-haze mixed low visibility (FHLV). However, as visibility decreases further, the proportion of fog with low visibility increases significantly. The average visibility when fog occurs is lower than that when precipitation occurs and also much lower than that of fog-haze mixed, indicating that low visibility is more affected by atmospheric water vapor. Over the past decade, as air pollutants have decreased each year, the proportion of fog and FHLV has also trended downward. The proportion of fog increases significantly in winter, and the low visibility below 200 m is mainly caused by fog in winter, while the increase of precipitation in June is the main cause of low visibility in this month. The diurnal variation of mean visibility under precipitation is relatively small. In contrast, the mean visibility during fog and fog-haze mixed conditions is lower at night than during the day. The higher occurrence rate of these two types of low visibility conditions at night is a significant factor contributing to reduced visibility during nighttime. Atmospheric humidity, temperature, and particulate matter concentration are important factors affecting visibility, and visibility decreases significantly with the increase of PM2.5 when relative humidity (RH) is less than 70%, and PM2.5 has a lower effect on visibility when RH is greater than 70%. The forecast effect of introducing the PM2.5 concentration factor into the objective forecast model of visibility is better than that of not introducing the factor. The effect of introducing this factor is better than that of not introducing it, especially in the fall.
1. Introduction
Chongqing is located at the eastern edge of the Sichuan Basin, with a landscape dominated by mountains and hills. Low wind speeds and high frequency of static winds due to terrain obstruction, making it difficult for air pollutants to diffuse rapidly outward. At the same time, due to the intersection of the Jialing River and the Yangtze River in the center of Chongqing, Chongqing is in a state of high humidity all year round [1]. The low diffusion of air pollutants and high humidity make Chongqing a world-famous “fog city.” The frequent occurrence of low visibility events has a very great impact on people’s production and life, especially on aviation, highways and shipping on the Yangtze River. Low visibility not only affects the smoothness of transportation but also increases the risk of traffic accidents, bringing huge economic losses and social problems. Therefore, it is of great significance to study the characteristics and influencing factors of low visibility (visibility lower than 1000 m) in Chongqing, and to establish a visibility forecasting model, provides technical support for establishing fog decision service system [2].
In recent years, the research on the causes of reduced visibility has made progress in stages. It has been shown that precipitation [3], relative humidity (RH) [4], pollutant concentration [5], and other factors change the extinction characteristics of the atmosphere in different ways, thus affecting the magnitude of visibility. Under unfavorable meteorological conditions, the aggregation of atmospheric particulate matter will lead to a significant reduction in visibility [6, 7]. Bari and Bergot [8] made sensitivity experiments of a foggy day in Casablanca and found that numerical coastal fog prediction is influenced by local topography, urbanization, and aerosol types. Therefore, the forecasting of visibility must not only consider the influence of meteorological factors [9], but also the influence of atmospheric particulate matter concentration. More and more scholars have begun to analyze the joint influence of meteorological factors and particulate matter concentration on visibility. Wang et al. [10] analyzed the relationship between visibility and PM2.5 concentration and found that there is a good correlation between the two, and a linear correlation can be established within a certain RH interval. Wang et al. [11] found that the increase in pollutant concentration in Qingdao was negatively correlated with visibility. Meng et al. [12] analyzed the persistent hazy weather in Beijing and found that the deterioration of visibility was closely related to the persistent fluctuating growth of PM2.5. Liu et al.’s [13] study of the relationship between visibility and PM2.5 concentration in winter in the Beijing–Tianjin–Hebei region found that the increase in PM2.5 concentration was the dominant factor for the rapid decrease in visibility when the RH was below 70%, while the correlation between PM2.5 concentration and visibility weakened when the RH increased from 85% to 95%. Bai et al. [14] found that in the Wuhan area, when RH < 40%, the key to visibility reduction is the increase of PM2.5 concentration, and the visibility 10 Km corresponds to a PM2.5 threshold of 70 µg/m3. Chen et al. [15] analyzed the evolutionary characteristics of fog and haze in the middle reaches of the Yangtze River over the past 58 years and proposed that three factors, regional-scale climate change, urbanization, and air pollution, have considerable quantitative impacts on fog. Peng et al. [16] analyzed the relationship between atmospheric particulate matter and visibility in Chengdu and found that under different RH conditions, the concentration of particulate matter in different particle size segments had different impacts on visibility. Previous characterization and forecasting of visibility in Chongqing have focused on meteorological conditions [17–19], and the relationship between particulate matter concentration and visibility has been mainly analyzed in terms of the contribution of the extinction coefficient of particulate matter [20]. The forecasting methods for visibility have also been compared by many scholars; Herman and Schumacher [21] developed an aviation forecasting model based on multiple statistical model configurations by applying the GEFS/R dataset, which significantly improves the probabilistic forecasting skill for cloud top heights and visibility at airports. Zhang et al. [22] utilized multiple machine learning methods to build a forecast model for objective forecasting of light fog and heavy fog and found that the LightGBM model performed the best. However, the quantitative relationship between atmospheric visibility and particulate matter concentration and meteorological factors in Chongqing is not clear, and there are fewer studies on the impact of the particulate matter concentration factor on the forecast effect after it is introduced into the objective forecast model. This paper attempts to analyze the characteristics of low visibility in Chongqing, find out the quantitative relationship between meteorological factors and changes in atmospheric particulate matter concentration and visibility, and comparatively examine the influence of PM2.5 factor in the objective visibility forecasting model of Chongqing, so as to provide a reference and basis for the establishment of an objective visibility forecasting model in Chongqing.
The rest of this paper is organized in the following way: Section 2 details the study area. Section 3 describes the information and methodology used in this study. Section 4 analysis of the low visibility characterization of the central city of Chongqing, and the factors influencing visibility, and the effect of particulate matter concentration on low visibility forecasting. In Section 5, summary and discussion are made.
2. Overview of the Study Area
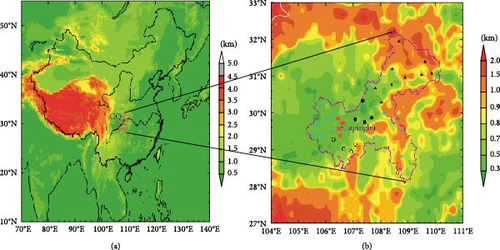
Figure 1 shows the location of the representative station Shapingba (57516, the WMO ID) in the center of Chongqing, which is located in the second terrain of China, the transition zone between the Tibetan Plateau and the middle and lower reaches of the Yangtze River. Chongqing is at the eastern edge of the Sichuan Basin, showing a general topographic trend of low west and high east, with a landscape dominated by mountains and hills. The center of Chongqing is located in the western part of the region, at the confluence of the Jialing River and the Yangtze River.
3. Materials and Methods
3.1. Materials
The low visibility characteristics of Chongqing Shapingba station (57516) were analyzed using hourly data. Chongqing has been carrying out hourly automated observation of visibility since 2013 and excluding the data with more missing measurements in 2013–2014. The hourly surface observation meteorological data of Chongqing from January 1, 2015 to December 31, 2023, were selected to analyze the yearly, monthly, and daily variation characteristics of low visibility.
The relationship between visibility and meteorological elements and particulate matter concentration was analyzed using hourly surface visibility from January 1, 2017 to December 31, 2020 at Chongqing Shapingba Station, and hourly observations of PM2.5 and PM10 in the central city of Chongqing provided by the National Real-Time Urban Air Quality Distribution Platform. The effect of particulate matter concentration on visibility under different temperature and humidity conditions was also analyzed using the information of daily minimum visibility and daily average humidity from 2016 to 2019 and the daily average PM2.5 concentration in the central urban area of Chongqing provided by the Chongqing Municipal Automatic Atmospheric Environment Monitoring Station.
The hourly meteorological data of Chongqing from 2017 to 2019 and the hourly live data of PM2.5 and PM10 hourly observations in the central city of Chongqing provided by the National Urban Air Quality Real-Time Distribution Platform (NUAQRDP) were used as the training set, and the neuronal network method was introduced to establish the visibility prediction model, and the 2020 data were used for the test. All data were quality-controlled to remove singular values.
All parameters are observed at the surface and were quality-controlled to remove singular values.
3.2. Methods
The earth’s atmosphere is mainly composed of a dry clean atmosphere, water vapor, and aerosol particles suspended in the air [23], so atmospheric visibility is mainly affected by precipitation, fog, and changes in the concentration of particulate matter in the atmosphere, in order to better study the characteristics of low visibility in Chongqing City, low visibility is divided into three categories for research. When hourly visibility is less than 1000 m and precipitation occurs at the same time, it is defined as precipitation low visibility (PLV); when hourly visibility is less than 1000 m without precipitation and RH is greater than or equal to 90%, it is defined as fog low visibility (FLV); when hourly visibility is less than 1000 m without precipitation and RH is less than 90%, it is defined as fog-haze mixed low visibility (FHLV). The first two types of low visibility are mainly affected by water vapor in the atmosphere, while the latter type of low visibility is more affected by the concentration of particulate matter in the atmosphere. The characteristics of low visibility in Chongqing are analyzed by statistically analyzing the proportions and mean values of the occurrence of the three types of low visibility. The yearly (monthly) proportion of the three types of low visibility is calculated by taking all the cases of low visibility in the year (month) as the total number of samples and then dividing the total number of samples by the number of samples of each of the three types of low visibility. The hourly ratio is calculated by taking all instances of a particular type of low visibility as the total sample size and dividing the number of samples of this type of low visibility in each hour by the total sample size.
An hourly visibility forecasting model was developed using the BP neural network approach. Correlation coefficients were calculated for visibility with surface meteorological elements and atmospheric pollutant concentrations in order to select variables with better correlation for introduction into the forecasting model. Using the correlation coefficient and root-mean-square error as assessment indicators, the effect of introducing PM2.5 concentration information on the forecasting model was analyzed and compared.
4. Results
4.1. Characterization of Low Visibility in Chongqing
4.1.1. Comparison of Low Visibility Classification in Chongqing
Table 1 gives the hourly data statistics of Chongqing Shapingba Station (57516) from 2015 to 2023, which analyzes the proportion of three types of low visibility when the visibility is less than 1000 m, less than 500 m, and less than 200 m. From Table 1, it can be seen that when the visibility is less than 1000 m, the proportion of PLV is the highest, it’s 59.3%, and the mean value of PLV is 692.2 m; the proportion of FLV is 26.8%, and the mean value of this kind of low visibility is the lowest of the three types of visibility, which is only 494.6 m; and the proportion of FHLV is only 13.9%, with the mean value of 848.2 m. when the visibility is lower than 500 m, the proportion of FLV rises significantly to 51.7%; the mean value is still the lowest among the three types of low visibility at 203.8 m; the proportion of PLV drops to 46.1%, the mean value is 355.2 m; the proportion of FHLV drops to only 2.2%, the mean value is 441.6 m. As the visibility decreases further, when the visibility is lower than 200 m, the proportion of FLV rises to 91.3%, with an average value of 100 m; the proportion of low visibility of precipitation accounts for only 8.8%, with an average value of 150.1 m; no FHLV occurs in this visibility section.
| Low visibility type | Visibility <1000 m | Visibility <500 m | Visibility <200 m | |||
|---|---|---|---|---|---|---|
| Proportion (%) | Mean (m) | Proportion (%) | Mean (m) | Proportion (%) | Mean (m) | |
| Precipitation low visibility | 59.3 | 692.2 | 46.1 | 355.2 | 8.8 | 150.1 |
| Fog low visibility | 26.8 | 494.6 | 51.7 | 203.8 | 91.2 | 100 |
| Fog-haze mixed low visibility | 13.9 | 848.2 | 2.2 | 441.6 | — | — |
4.1.2. Interannual Variation of Low Visibility in Chongqing
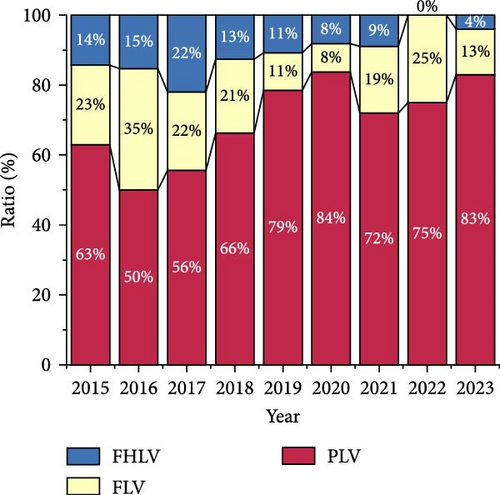
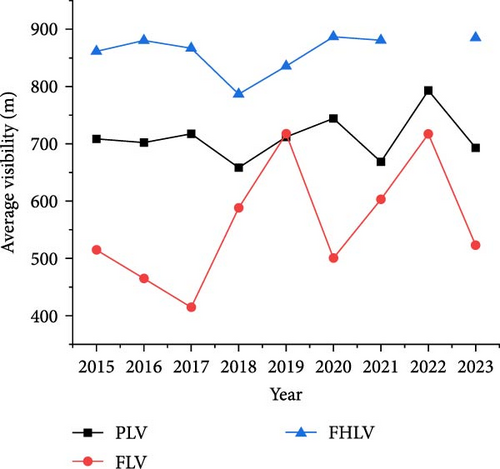
Hourly data from Chongqing station (57516) are used to analyze the interannual variation characteristics of low visibility in Chongqing from 2015 to 2023 (Figure 2). The statistical results show the annual mean values of the three types of low visibility (Figure 2b), except for the FLV mean value of 717 m in 2019, which is slightly higher than the PLV mean value of 712 m. In the rest of the years, the FLV mean value is the lowest among the three types of visibility, and the FHLV mean value is the highest in all the years. The annual mean values of FLV fluctuated greatly, with a maximum of 717 m in 2019 and a minimum of only 415 m in 2017, with a difference of more than 300 m between the highest and lowest values. The annual mean values of PLV and FHLV both fluctuated within 200 m. The interannual fluctuations in the proportion of FLV (Figure 2a) are large, with 2015–2018 accounting for more than 20% of the overall low visibility, and then the proportion of FLV decreasing to less than 20% in 2018–2021, with the proportion recovering to 25% in 2022, but then decreasing to 13% in 2023. Overall, there is a decreasing trend in the FLV percentage. The decreasing trend in the proportion of FHLV is more pronounced, with no individual cases of low visibility due to fog-haze mixing occurring in 2022. The decrease in the proportion of FLV and FHLV is related to the significant improvement in air quality in the Chongqing area in recent years [26], where the decrease in the concentration of particulate matter in the atmosphere has made the formation of fog and haze more unfavorable.
4.1.3. Characteristics of Monthly Changes in Low Visibility in Chongqing
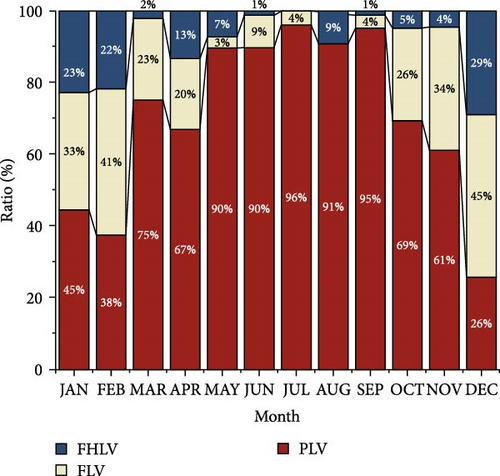
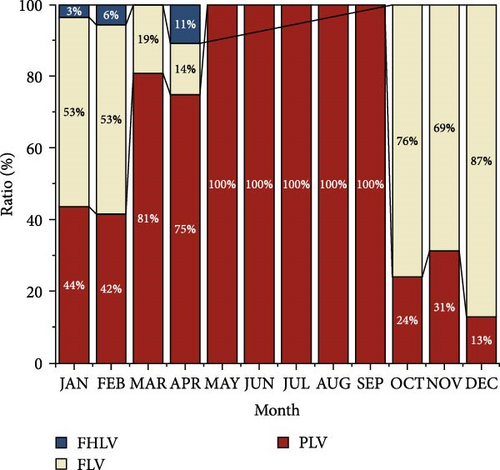
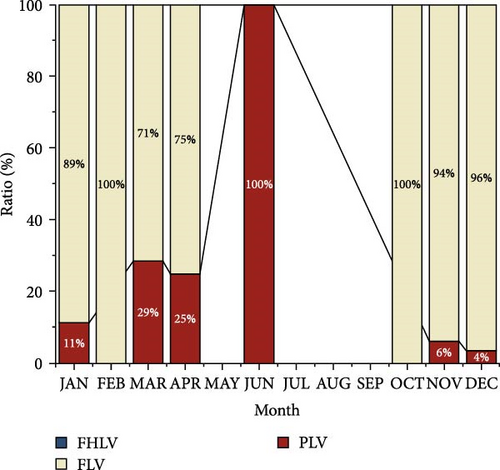
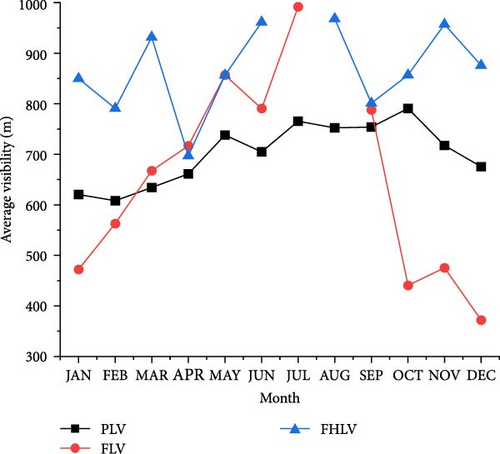
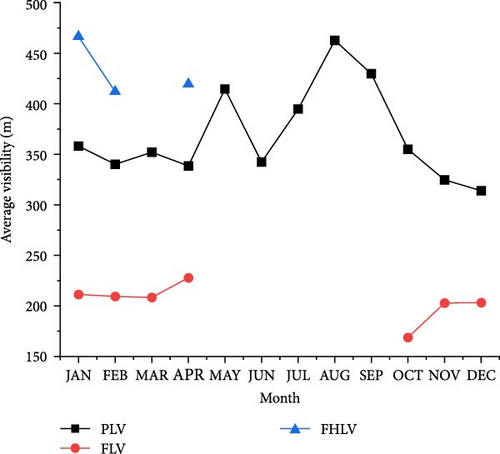
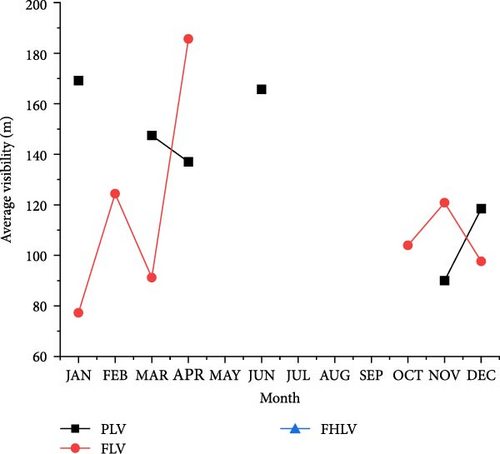
Using the hourly visibility, RH, and precipitation data at Shapingba station (57516) in Chongqing from January 1, 2015 to December 31, 2023, the monthly changes in the proportions (Figure 3) and means (Figure 4) of the three types of low visibility in Chongqing, PLV, FLV, and FHLV, are analyzed. It can be seen from Figures 3a and 4a that when the visibility is lower than 1000 m. The proportion of FLV is higher from October through February, with more than 26% of the low visibility being this type of low visibility. The proportion of FHLV is higher from December to February, with more than 20% of the low visibility. Stable atmospheric stratification in autumn and winter is not conducive to the diffusion of pollutants, while low temperatures in winter make it easier for atmospheric water vapor to reach saturation, which leads to a significant increase in the proportion of fog and FHLV in winter. The proportion of the two types of low visibility occurring in December is the highest, accounting for 45% and 29% of the low visibility samples of the month, respectively, and the mean values are also the lowest of the whole year at 372 and 876 m, respectively. The proportion of FLV and FHLV decline significantly after March. The proportion of PLV rises, exceeding 67% from March through October, and the mean of PLV is also lower than the mean of the other two types of low visibility from March through September. When visibility is below 500 m (Figures 3b and 4b), the FHLV occurs only in January, February, and April, and the proportion is low, not exceeding 10%. The proportion of FLV is higher than that of PLV from October to February, and the proportion of PLV increases markedly from March to September, and the low visibility below 500 m in May–September is produced only by precipitation. In months where fog and PLV coexisted, the mean value of FLV was much lower than that of PLV. When visibility was below 200 m (Figures 3c and 4c), no low visibility samples were produced in May and July–September; all low visibility in June was produced by precipitation, and all low visibility in October and February was caused by fog. The mean low visibility of fog was below 130 m from October to March, with a maximum of 186 m in April, and the mean low visibility of precipitation ranged from a low of 90 m in November to a high of 169 m in January.
4.1.4. Characteristics of Daily Changes in Low Visibility in Chongqing
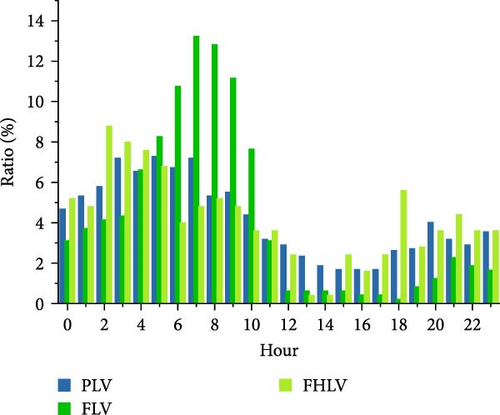
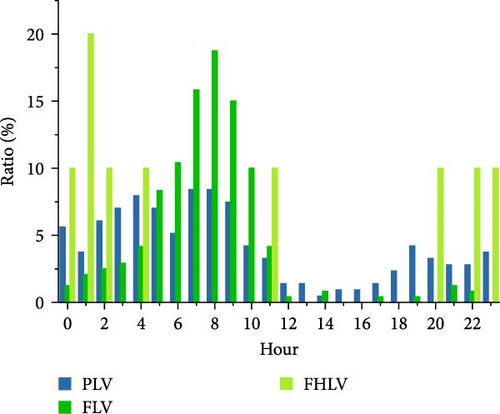
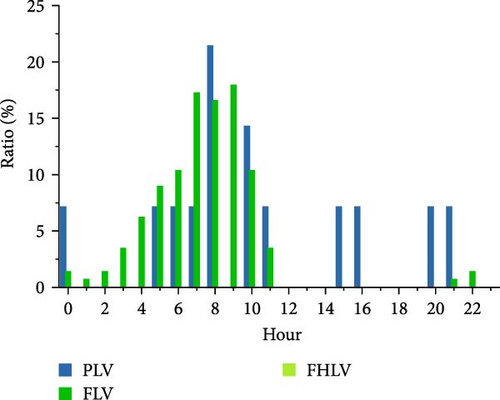
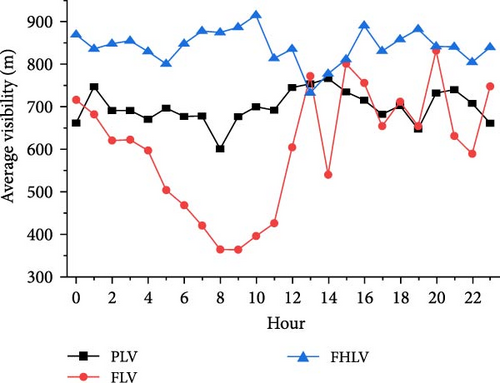
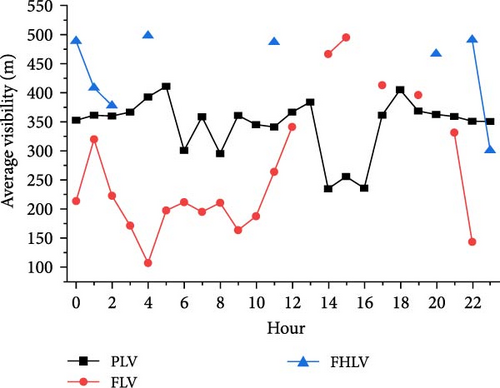
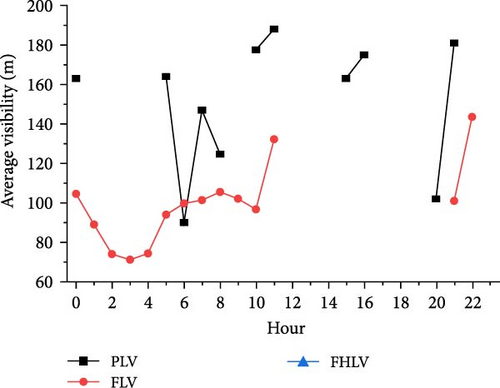
Hourly surface visibility, precipitation, and RH observations from January 1, 2015 to December 31, 2023 at Shapingba Station (57516) in Chongqing were utilized. The hourly averages of each type of low visibility and the hourly probability of occurrence of each type of low visibility as a percentage of the full-day low visibility were analyzed (Figure 5). Figure 5 shows that fog, and FHLV means are lower at night than during the day, and the high proportion of both types of low visibility occurring at night is an important cause of low visibility at night. This feature has a great relationship with the stability of the atmosphere and daily change. During the daytime, the radiation is strengthened, the ground temperature rises, the stability of the atmosphere decreases, the turbulence and vertical diffusion capacity are strengthened, which is conducive to the diffusion of particulate matter in the atmosphere, and the temperature also makes the moisture evaporate, and the radiation fog gradually disappears, which leads to the increase of the visibility; and at night the ground is cooled by the long-wave radiation, and an inversion layer is easy to appear in the lower layers of the atmosphere. Enhancement of atmospheric particulate matter in this weather condition is not easy to diffuse, the night temperature is significantly lower, and the lower level of water vapor is easy to saturates condensation to form fog, resulting in reduced visibility. The daily variation of PLV is smaller than the other two types of low visibility. When the visibility is below 1000 m (Figure 6a), the mean PLV basically varies between 600 and 750 m. When the visibility is below 500 m (Figure 6b), the lowest values of PLV occur at 14–17 h, mostly caused by precipitation generated by afternoon thermal convection. When the visibility was below 200 m (Figure 6c), 80% of the FLV occurred between 05:00 and 10:00, and the occurrence of the thick fog time period at night was an important reason for the low visibility at night.
4.2. Influence Factor Analysis of Visibility
4.2.1. Correlation Analysis
In order to analyze the influencing factors of visibility, the hourly surface visibility and precipitation, RH, wind speed, barometric pressure, and depression of dew point observations at the Shapingba station provided by the Chongqing Meteorological Bureau for the 5-year period from January 1, 2017, to December 31, 2020, as well as the hourly observations of PM2.5 and PM10 in the central urban area of Chongqing provided by the NUAQRDP were utilized. Correlation analysis was performed (Table 2).
| Meteorological elements | Depression of dew point | Relative humidity | Air temperature | PM2.5 | PM10 | Wind speed | Atmospheric pressure | Precipitation |
|---|---|---|---|---|---|---|---|---|
| Visibility | 0.61 | −0.59 | 0.52 | −0.47 | −0.41 | 0.3 | −0.39 | −0.12 |
Visibility correlates well with meteorological factors as well as atmospheric particulate matter concentration, and all elements except precipitation passed the significance level test of α = 0.05. As can be seen from Table 1, the visibility has the best correlation with RH and depression of dew point, which are −0.59 and 0.61, respectively, indicating that the humidity state of the atmosphere has a great influence on visibility, and when the humidity is high, it is prone to fog and precipitation and other weather phenomena that have a high impact on visibility, and at the same time, the increase in humidity will make the atmospheric particulate matter form aerosol particles that are not easy to diffuse, which is not conducive to the pollutants’. The increase in humidity will cause particulate matter in the atmosphere to form aerosol particles that are not easily dispersed, which is not conducive to the diffusion of pollutants, thus affecting visibility. In addition to humidity conditions, visibility and temperature also have a high correlation; the correlation coefficient reaches 0.52; the increase in temperature makes the turbulence in the near-earth layer strengthened significantly, which is favorable to the diffusion of pollutants and makes the visibility increase. At the same time, the rising temperature makes the air contain water to enhance the ability of the air is not easy to reach saturation, water vapor is not easy to condense to form the fog that affects the visibility. Another high correlation with visibility is PM2.5 and PM10, with correlation coefficients of −0.47 and −0.41. The concentration of particulate matter in the atmosphere not only directly affects visibility but also provides condensation nuclei for the formation of rain and fog, which have a high impact on visibility reduction. The correlation coefficients for wind speed, barometric pressure, and precipitation, on the other hand, are lower, with the absolute value of the correlation coefficient being less than 0.4.
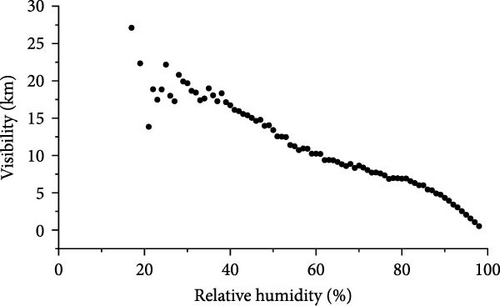
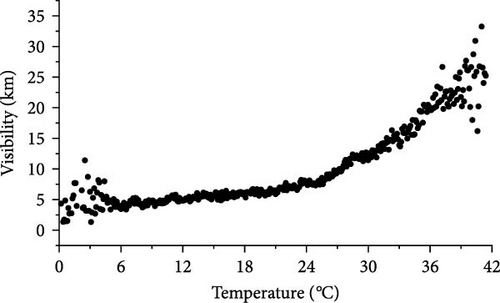
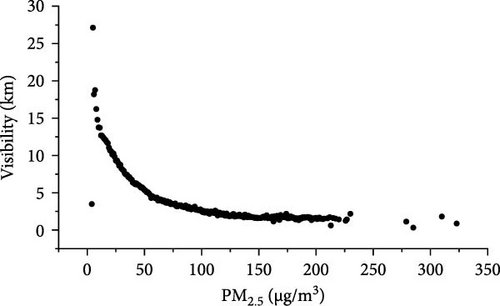
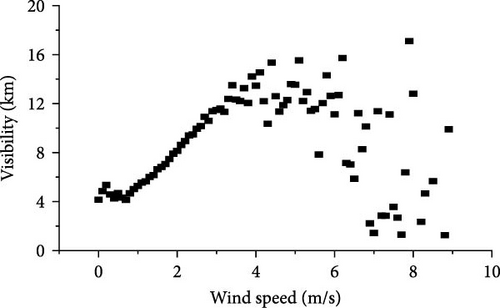
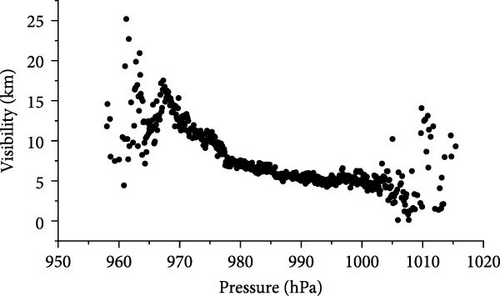
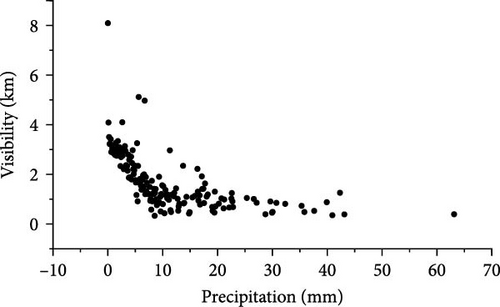
Since the correlation coefficient is a statistic of linear correlation between two variables, and the relationship between visibility and the influencing factors is not a simple linear relationship, it is impossible to comprehensively judge the degree of influence of each element on visibility based on the correlation coefficient alone. In order to study the relationship between visibility and each influencing factor more intuitively, the scatter plot of the mean values of each element with visibility is given at intervals of 1% for RH, 0.1°C for temperature, 1 µg/m3 for PM2.5, 0.1 m/s for wind speed, 0.1 hPa for barometric pressure, and 1 mm for precipitation (Figure 7). Because depression of dew point and RH, PM10, and PM2.5 are all elements that characterize the same type, no further scatter plots of the mean values of visibility are given for depression of dew point and PM10. As seen in Figure 7a, RH and visibility are nonlinearly related, but in general, visibility decreases with increasing RH; when RH is lower than 50%, the visibility is basically greater than 10 km. When RH is greater than 50% and less than 90%, the visibility fluctuates and decreases from 10 to 3 km. When the RH is greater than 90%, the visibility decreases rapidly. It shows that the effect of high humidity on visibility is very significant. Figure 7b shows that the visibility increases with the increase in temperature, when the temperature is less than 10°C, the average value of visibility is less than 3 km, and when the temperature is more than 20°C, the visibility increases sharply. The lower base temperature is a necessary condition for the fog formation, and the low temperature makes it easier for the water vapor to reach the saturation and thus condense into fog. Figure 7c shows that the visibility decreases with the increase of PM2.5 concentration; when the PM2.5 concentration is 150 µg/m3 is the inflection point of the visibility change, and the degree of visibility decreases from fast to slow. Figure 7d shows that the visibility increases with the increase of wind speed, especially when the wind speed increases from 0 to 3.5 m/s; the visibility changes almost linearly with the wind speed, but when the wind speed is greater than 4 m/s, the dispersion of the change of visibility increases significantly, on the one hand, it is easy to form the floating dust that affects the visibility, on the other hand, due to the strong convection caused by the windy time is mostly accompanied with strong precipitation, which also makes the visibility decrease. The visibility decreases with the increase of air pressure (Figure 7e), reflecting the characteristic of better visibility in summer and worse visibility in winter. The dispersion of visibility with precipitation (Figure 7f) is large, but in general, it decreases with increasing precipitation.
4.2.2. Effect of Particulate Matter Concentration on Visibility Under Different Temperature and Humidity Conditions
From the correlation analysis between visibility and the influencing factors (Table 2), it can be seen that visibility is most affected by humidity, temperature, and particulate matter concentration. Temperature is an important criterion for seasonal classification, and by analyzing the scatter distributions and fitted curves of daily minimum visibility versus daily average humidity and PM2.5 concentration for different seasons from 2016 to 2019 (Figure 8), it is possible to derive how particulate matter concentration affects visibility under different temperature and humidity conditions.
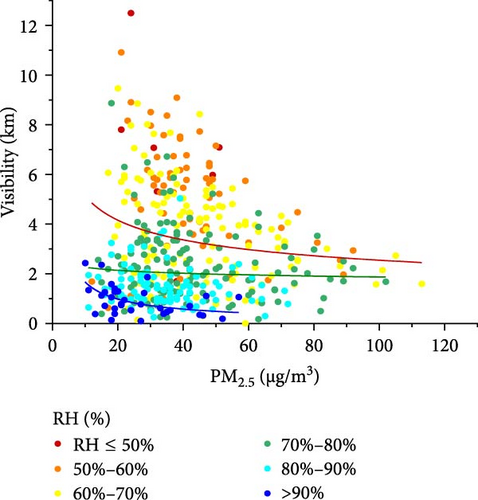
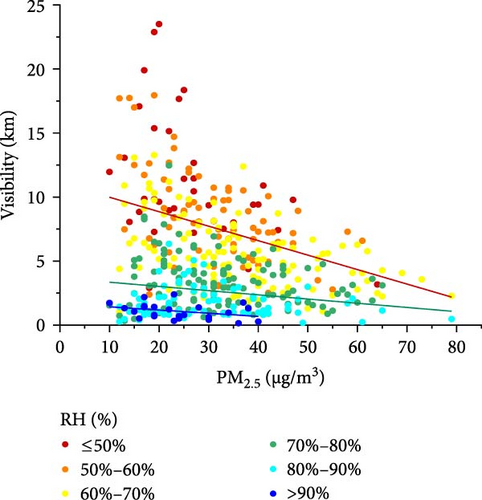
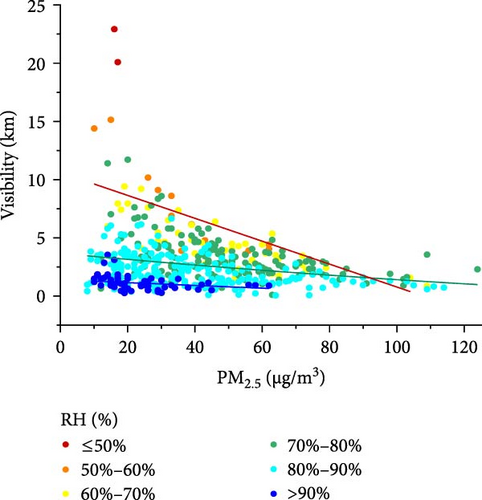
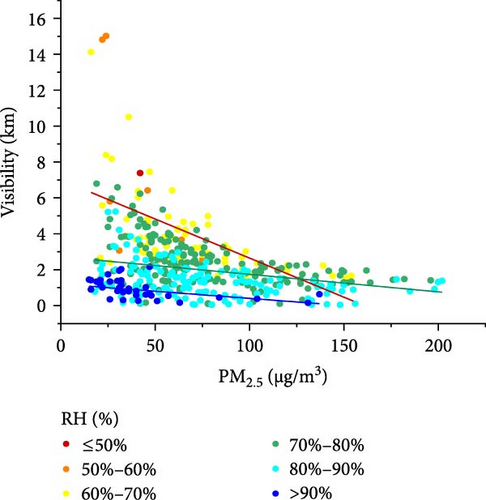
The RH interval was divided into rh < 70%, 70% ≤ rh < 90%, and rh ≥ 90% for fitting. This is mainly based on the conceptual model of Wu [27] on the distinction between fog, light fog, and haze: low visibility is mainly considered to be caused by haze when RH is lower than 70%, by fog-haze mixed when RH is higher than 70% and lower than 90%, and by fog mainly when RH is greater than 90%.
The average temperature in Chongqing is 19.6°C in spring, and in this season (Figure 8a), when the RH is less than 70% and the PM2.5 concentration is less than 75 µg/m3, the visibility decreases from 12 km to about 3 km with the increase of PM2.5 concentration and humidity conditions, and at this time, the change of the visibility is determined by the combination of the humidity conditions and the degree of cleanliness of the atmosphere. In this humidity band, as the PM2.5 concentration further increases to 113 µg/m3, the visibility further decreases to about 2 km, at which time the decrease in visibility is mainly influenced by the increase in PM2.5 concentration, while the effect of humidity is weakened. When the RH was between 70% and 90%, the visibility did not decrease significantly with the increase of PM2.5 concentration; instead, the visibility decreased from 3 km to about 1 km with the increase of humidity, which indicated that the correlation between visibility and PM2.5 concentration was significantly reduced in this humidity band, and the reduction of the visibility at this time was more affected by the growth of moisture absorption of the water-soluble particles in the atmosphere [28]. Most of the low visibility cases occur in the case of RH greater than 90%, the visibility in this humidity section is basically below 1.5 km, the PM2.5 concentration varies in the range of 10–60 µg/m3 and there is no light and above polluted weather, and the change of visibility is mainly affected by the increase of humidity.
In summer (Figure 8b), the average temperature in Chongqing was 28.6°C, and the PM2.5 concentration exceeded 75 µg/m3 on only 2 days, with fewer polluted days. When the RH was less than 70%, the visibility decreased from 25 km to about 4 km with the increase of PM2.5 concentration and humidity conditions. In the 70%–90% humidity band, from the fitted curve of the scatter distribution of visibility versus PM2.5 concentration, when the PM2.5 concentration increased from 10 to 50 µg/m3, visibility showed a slightly increasing trend, and when the PM2.5 concentration increased further visibility began to decrease. When the RH is greater than 90%, the PM2.5 concentrations are all lower than 50 µg/m3, and the change of visibility in this humidity band is mainly affected by the increase in humidity.
The characteristics of visibility changes with humidity and PM2.5 concentration in fall and winter (Figure 8c,d) are more consistent. The average temperatures of the two seasons were 18.8 and 9.9°C, respectively. Unlike spring and summer, when the RH was less than 70%, and the PM2.5 concentration was less than 75 µg/m3 in fall and winter, the visibility decreased rapidly with the increase of PM2.5 concentration to about 4 km, and the trend of the decrease of the visibility was slowed down when the PM2.5 concentration was greater than 75 µg/m3. The number of polluted days increased significantly in fall and winter, and the mild and above pollution with PM2.5 concentration greater than 75 µg/m3 was mainly concentrated in the humidity band of 70%–90% RH, at which time the decrease of visibility was not significant from about 2 to 1.5 km. When the RH increased further to more than 90%, the individual cases of visibility less than 1 km were mainly found in the case of PM2.5 concentration less than 75 µg/m3, indicating that low visibility in fall and winter is more influenced by atmospheric humidity conditions than by PM2.5 concentration.
Overall, the effects of RH and PM2.5 on visibility in the four seasons show more consistent characteristics, when the RH is less than 70%, the visibility decreases significantly with the increase of PM2.5; when the RH is between 70% and 90%, the effect of PM2.5 on visibility decreases, especially in the summer visibility with the increase of the PM2.5 concentration shows a tendency of increasing and then decreasing; when the RH is When the RH is greater than 90%, the visibility is generally lower than 2 km, but the concentration of pollutants is less likely to exceed the standard, indicating that the reduction of visibility under high humidity is more affected by the RH.
4.3. Impact of Particulate Matter Concentration on Low Visibility Forecasting
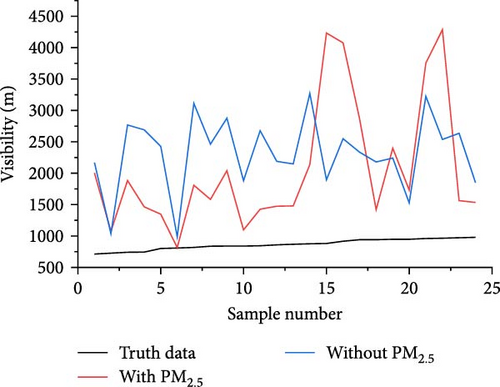
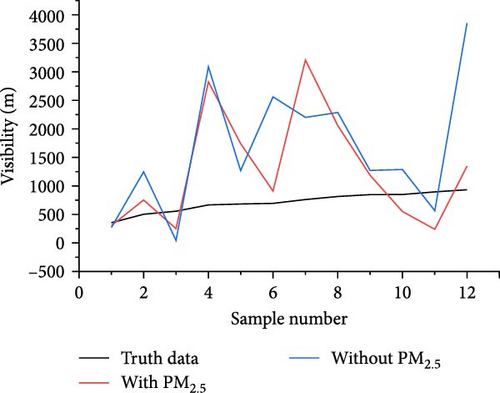
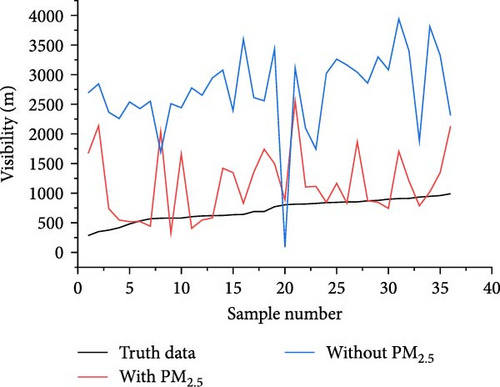
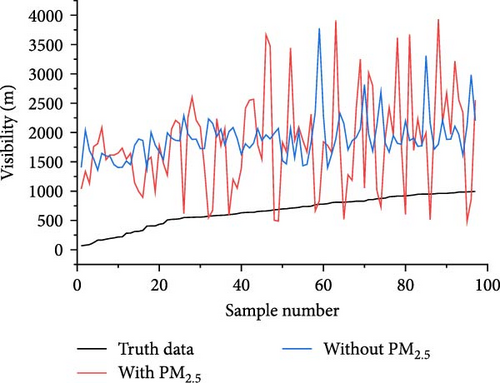
Based on the analysis of the influence factors of visibility in Chongqing, it can be seen that visibility is in a nonlinear relationship with all kinds of influence factors. Zhou et al. [29] used linear and nonlinear models in the comparative study of forecasting meteorological factors and found that the forecasting effect of the nonlinear model was much better than that of the linear model in the forecasting of meteorological factors that had nonlinear relationships with the forecasting factors. Therefore, the neural network [30] method, which has a strong ability to deal with nonlinear problems, was chosen to establish the visibility forecasting model in Chongqing. In order to further analyze the effect of particulate matter concentration on visibility, modeling forecasts with and without the introduction of the PM2.5 concentration factor were conducted in the experiments. The six training model forecast factors in the experimental scheme I are hourly precipitation, hourly maximum wind speed, air temperature, RH, depression of dew point, and barometric pressure at this station. The PM2.5 concentration factor is added in scheme II. The parameters of the model were finalized based on the forecasting effects of several previous experiments: 1 hidden layer and hidden layer factors are 4, and the values of learning factor and momentum factor are taken as 0.9 and 0.7, respectively, with a predetermined convergence error of 0.001, and the number of operations is 10,000. The hourly data from 2017 to 2019 were used as the training set, and the number of samples of the training set was 6534 in the spring, 6017 in the summer, 6229 in the fall, and 6203 in the winter. In 2019, the hourly data were used as the training set. The hourly data of 2020 is used as the forecast factor of the test set and the cases with visibility lower than 1000 m are extracted as the test set, and the sample numbers of the test set are 24 in the spring, 12 in the summer, 35 in the fall, and 97 in the winter, and the forecast results of the test set are examined with the real cases with visibility lower than 1000 m.
Figure 9 gives the time series of the two models for the comparison between the forecast results and the real conditions when the real conditions of visibility are lower than 1000 m. From Figure 9, it can be seen that the forecast curves of the neural network forecasting model are consistent with the change trend of the real condition curves and have a high degree of fit. From the forecasting results of the four seasons (Table 3), the forecasting effect of introducing the PM2.5 concentration factor is significantly better than that of not introducing the factor. However, the forecasts of both models are overestimated for low visibility when compared with the actual conditions. From the root-mean-square errors between the forecast and actual for the individual cases below 1000 m in both models, it can be seen that the introduction of the PM2.5 factor significantly improves the forecasts, especially in the fall, and the root-mean-square error of the model without the PM2.5 factor in the fall is 2166 m, while the root-mean-square error of the model with the PM2.5 factor is 716 m, which is a 67% reduction in the error; in the summer, the introduction of the PM2.5 factor has reduced the error of the PM2.5 factor. In summer, the introduction of the PM2.5 concentration factor reduces the error by 316 m, which is nearly 22%; in winter and spring, there is not much change, and the error change is less than 1%. It can be seen that the introduction of PM2.5 factor is particularly important for the enhancement of model forecasting ability, mainly because Chongqing fall and winter is the most polluted period of the year as well as the highest frequency of fog, air pollutants on the one hand, directly affecting visibility, but also as a condensation nucleus in the formation of fog plays an important role in the formation of the process of atmospheric pollutants in the density of the fog and fog concentration has a close relationship [31].
| Model category | Spring | Summer | Fall | Winter |
|---|---|---|---|---|
| With PM2.5 | 1541 | 1092 | 716 | 1307 |
| Without PM2.5 | 1564 | 1408 | 2116 | 1299 |
5. Summary and Discussion
- 1.
When the visibility is lower than 1000 m in Chongqing, the proportion of PLV is the highest at 59.3%; the proportion of FLV is 26.8%, and the mean value of this kind of low visibility is the lowest of the three types of visibility, only 494.6 m; the proportion of FHLV is only 13.9%. As visibility decreases, the proportion of FLV increases, and the proportion of PLV when visibility and FHLV decreases. When the visibility is lower than 200 m, the proportion of FLV rises to 91.3%, with a mean value of 100 m; the proportion of PLV accounts for only 8.8%, with a mean value of 150.1 m; no FHLV occurs. It can be seen that fog is the main cause of visibility reduction in Chongqing.
- 2.
The analysis of the proportion of the three types of low visibility in the past decade shows that the proportion of fog and FHLV in the Chongqing area is on a downward trend, which is mainly related to the reduction of the concentration of atmospheric pollutants from year to year.
- 3.
Stable atmospheric stratification in winter is not conducive to the dispersion of pollutants. At the same time, low temperatures in winter make it easier for atmospheric water vapor to become saturated, which leads to a significant increase in the proportion of fog and FHLV in winter, resulting in a significant decrease in the average visibility in winter and an increase in precipitation in June and October is an important factor leading to the significant decrease in the average visibility in these 2 months. The low daily variability of the mean PLV is small, the mean FHLV is lower at night than during the day, and the high proportion of both types of low visibility occurring at night is an important cause of low visibility at night.
- 4.
The correlation analysis of visibility with meteorological elements and pollutant concentrations found that atmospheric humidity, temperature, and particulate matter concentration are all important factors affecting visibility.
- 5.
The effects of RH and PM2.5 on visibility in the four seasons show more consistent characteristics. When the RH is less than 70%, the visibility decreases significantly with the increase of PM2.5; when the RH is between 70% and 90%, the effect of PM2.5 on visibility decreases, especially in the summer, the visibility shows a trend of increasing and then decreasing as the concentration of PM2.5 increases; when the RH is more than When the RH is greater than 90%, the visibility is generally lower than 2 km, but the pollutant concentration is less likely to exceed the standard, which indicates that the visibility reduction in high humidity is more affected by the RH.
- 6.
Analyzed and compared the effect of introducing PM2.5 information on the forecast model and found that the forecast effect of introducing the PM2.5 concentration factor is significantly better than that of not introducing the factor, especially for the visibility in autumn.
Through this study, it was first found that the proportion of fog and FHLV in the Chongqing area showed a decreasing trend, which coincided with some findings in Chinese studies, especially the study by Wu et al. [32], which showed a similar trend. At the same time, it also contrasts with the results of Indian studies, such as Mohan and Payra [33], in which the same effect was not observed, suggesting that region-specific influences may need to be considered. Second, it was found that in addition to the strong influence of humidity, the atmospheric concentration of particulate matter is also an important factor in fog formation in Chongqing, a finding that is in line with most of the studies conducted globally. For example, Bari and Bergot [8] conducted a series of sensitivity experiments for a fog event in Casablanca, Morocco, and found that fog is more likely to occur in environments with high aerosol concentrations. By comparing the results of this paper with other global studies, it not only confirms the validity of our work, but also reveals potential directions for future research. This global perspective analysis contributes to a better understanding of the impact of the study and promotes international academic exchange and cooperation.
This study helps to further understand the changing characteristics of low visibility in Chongqing, and the established artificial intelligence forecast model of visibility in Chongqing provides an objective reference for visibility forecasting. It is an important indication for the management of atmospheric particulate matter pollution and the improvement of visibility in the Chongqing region. In the forecast, the focus of the forecaster should be shifted with the change in the degree of visibility, and more attention should be paid to the impact of precipitation for lower visibility (200 m ≤ vis <1000 m), while the focus should be shifted to the generation of fog when forecasting very low visibility (vis <200 m). For lower visibility, by analyzing the relationship between RH and the quantitative effect of particulate matter concentration on visibility change, it can be known that when the RH is less than 70%, decreasing the concentration of PM2.5 will improve the visibility. However, as the RH increases, the effect of measures to reduce PM2.5 on visibility improvement decreases.
A detailed review of daily visibility data in the Chongqing area revealed a number of days of abnormally low visibility. After analysis, these anomalies are closely related to changes in the weather situation, and most of the unusually low weather occurs under the control of the northwesterly airflow after the influence of cold air, which has few clouds at night, with significant radiative cooling of the ground, and the atmosphere is very susceptible to saturation in the early hours of the morning, and it is very easy to produce a dense fog to form an abnormally low visibility if the ground winds are small at this time. In addition, successive periods of static weather in winter can cause localized particulate matter concentrations to rise, thereby reducing visibility. Future research considers incorporating information on weather conditions into the forecast model to increase the model’s ability to forecast very low visibility. Since the impact factors of low visibility vary from region to region, the conclusions of this study are only applicable to Chongqing and its neighboring regions. Due to the limited length of the data, the depth of analysis of the climate impacts in this study is insufficient, and subsequent studies will use data with larger sample sizes, consider more visibility impact factors, further refine the climate characteristics of low visibility, and improve the visibility forecasting model.
Conflicts of Interest
The authors declare no conflicts of interest.
Funding
This study was supported by the Innovative Team Project of Southwest Regional Meteorological Center, China Meteorological Administration (XNQYCXTD-202203), the Special Project for Science and Technology Innovation and Application Development in Chongqing (CSTB2022TIAD-KPX0123), and the Key Technology Research on High-Impact Weather Intelligent Early Warning in the Chengdu-Chongqing Urban Agglomeration (CSTB2023TIAD-KPX0065).
Acknowledgments
This study was supported by the Innovative Team Project of Southwest Regional Meteorological Center, China Meteorological Administration (XNQYCXTD-202203), the Special Project for Science and Technology Innovation and Application Development in Chongqing (CSTB2022TIAD-KPX0123), and the Key Technology Research on High-Impact Weather Intelligent Early Warning in the Chengdu-Chongqing Urban Agglomeration (CSTB2023TIAD-KPX0065).
Open Research
Data Availability Statement
The data used to support the findings of this study are available from the corresponding author upon request.


