Analysis of Observational Characteristics of Extra-Large Hail in Shandong Peninsula on 1 October 2021
Abstract
Based on observational data, ERA5 hourly reanalysis data, and s-band dual-polarization radar data, the extremely severe convective weather happening in Shandong Peninsula on 1 October 2021 is analyzed. The results show that the process was affected by the upper-level cold vortex, and extremely severe convective weather happened from west to east in the northern area of Shandong Peninsula. Extra-large hail occurred in this process. The upper-level cold vortex provided the synoptic-scale dynamic forcing and unstable thermal stratification conditions, which were conducive to the occurrence of severe convective weather. About 2400 J · kg−1 sufficient convective available potential energy (CAPE) and 30.2 m · s−1 strong vertical wind shear between 0 and 6 km altitude prompted this severe convective weather to arise in October. Due to the special coastal geographical environment of Shandong Peninsula, the surface sea-breeze front triggered this severe convection process, and the movement of the surface convergence line stimulated the occurrence and development of convection nearby upstream and downstream. The three-body scatter spike (TBSS) and bounded weak echo region (BWER) of the storm were very significant. The value of ZDR is lower below 0°C layer than that above 0°C layer; meanwhile, the values of CC and KDP are higher below 0°C layer than that above 0°C layer. There were two ZDR columns on the east and west sides in the supercell storm, and the height (HT) of the east ZDR column top exceeds that of the −20°C layer. The thickness of the east ZDR column (about 3.2 km) was thicker than that of the west ZDR column (about 2.2 km). These all indicate that the storm had a deep updraft, which was conducive to the formation and growth of hail. There were also two KDP columns on the east and west sides of the BWER, which had almost the same thickness about 3.2 km, and both extended beyond the HT of the −20°C layer. The thickness of the strong reflectivity above 65 dBZ reaches 7 km, and the thickness of the ZDR column and KDP column reaches 2–3 km can be used as a reference for predicting extra-large hail in autumn short-term forecasting.
1. Introduction
Hail, especially large hail whose diameter is more than 2 cm, is the product of a strong convective system developing to the mature stage. Hail shows a characteristic that it is small spatial scale, sudden, greatly destructive, rapidly developing, and evolving. Hail is the disaster-causing strong convective weather prone to occur in Shandong in the summer half-year [1, 2]; thus, there have been many related researches. For hail, scholars have carried out a lot of deep researches in terms of its formation mechanism, spatial and temporal distribution, numerical simulation, mesoscale characteristics, storm evolution, and short-time forecasting techniques.
Dual-polarization radar has unique advantages for detecting and early warning of hails [3–9]. In recent years, the case observations and studies of hails have begun to increase. On one hand, many researchers study on dual-polarization radar monitoring of hails [10–19]; on the other hand, lots of researchers’ study on the causes of strong convective weather by using dual-polarization radar from the views of dynamics and physics of cloud precipitation [20–27]. There are also many studies about the causes of strong convective weather in Shandong based on dual-polarization radar. Xiuguang Diao and Feiyan Guo [28] analyzed the dual-polarization structural features of the Zhucheng supercell thunderstorm of 16 August 2019 and found that there were deep ZDR columns and KDP columns above the 0°C layer in the storm, with their tops both reaching the −20°C layer height (HT). The ZDR columns correspond to a high value of ZH, about 35–60 dBZ, and a low value of KDP, indicating that a few large liquid or wet ice particles appear in storm. While the KDP columns correspond to a higher value of ZH, about 55–72 dBZ, and a low value of ZDR, indicating that a certain number of small liquid or (and) wet ice particles and large hail particles appear in storm. Dianli Gong et al. [29] also analyzed the same process, and they studied the observational characteristics of the structure of strong hail storms and the formation of large hails. It is found that the hail cloud developed rapidly, and passed through five stages: occurrence, jump increase, brewing, hail, and extinction. They also analyzed the radar echo pattern, radial velocity, and three-dimensional wind field of the mature stage of the hail cloud and gave a framework of the main ascending airflow in the hail cloud and a schematic diagram of the “0-line.”
At present, the researches on dual-polarization radar applications in Shandong are mainly based on analysis of strong convective storms cases in spring and summer [30, 31]. Due to the regional and seasonal differences in storm types and structures, it is necessary to continue to analyze whether these conclusions about hails in spring and summer found in studies are applicable in autumn. A strong convective storm occurred from west to east in the northern coastal area of Shandong Peninsula on 1 October 2021, with extra-large hails up to 6 cm in diameter and a tornado. The convective process was significant in terms of happening season and intensity. Therefore, this paper first analyzes the process based on the multisource observational data such as dual-polarization radar and the ERA5 reanalysis data, and then summarizes the indicators of the short-range forecast and warning of strong convective weather, finally provides an effective reference for Shandong short-range forecast and warning of extreme strong convective weather in autumn.
2. Data and Method
In this paper, the real-time data used are conventional observations of precipitation, temperature and wind at hourly encrypted automatic stations in Shandong Province and non-conventional observations such as hails, focusing on the s-band dual-polarization radar observations at Yantai for the radar characteristic analysis and process diagnostic analyses mainly using ERA5 hourly reanalysis data from the European Centre for Medium-Range Weather Forecasts (spatial resolution 0.25° × 0.25°) and T-logP observation data from China Meteorological Administration (CMA).
Yantai dual-polarization radar has a longitude of 37.49°N and a latitude of 121.39°E. The time resolution is 6 min, and the spatial resolution is 250 m. The number of conventional observational elevation angles of this radar is 9, with the lowest elevation angle of 0.5° and the highest elevation angle of 19.5°. Based on transmitting and receiving electromagnetic waves, it can get observational elements such as the base reflectivity, base radial velocity, ZDR, CC, and KDP.
3. Weather Facts and Atmospheric Circulation
3.1. Weather Facts
From 11:00 BTC to 16:00 BTC on 1 October 2021, strong convective weather happened from west to east in the northern region of Shandong Peninsula. Precipitation of this process was scattered and uneven. The maximum hourly rainfall was 40.6 mm · h−1, and the maximum gust wind speed was 23.4 m · s−1. Hail was the most widespread and longest-lasting disastrous weather in the process (Figure 1) because more than 300 villages in nearly 30 towns, such as Penglai District, Laishan District, Muping District of Yantai, Wendeng District, and Rushan City of Weihai, were all hit by hails. The largest hail was about 6 cm in diameter and appeared at about 14:20 BTC in the Huanghai City Garden Community of Laishan District. The second largest hail was about 5 cm in diameter and appeared between 14:40 BTC and 15:00 BTC at Longquan Town of Muping District. According to Yantai historical records, there are two times hails in October since 2006. One is this process, and the other is on 15 October 2011 with hails under 1 cm diameter.
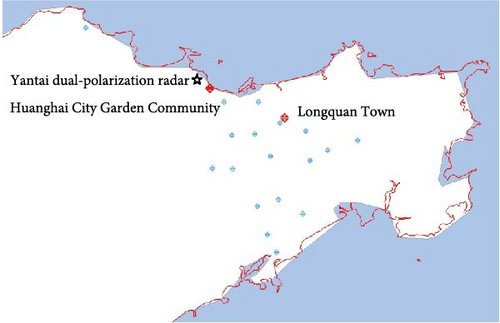
In addition, a tornado also appeared in this process and it has not been classified. This tornado lasted in short time with weak intensity and occurred in mountain areas, so it is difficult to obtain the complete occurrence of the process.
The strong convective weather occurred at the nearing harvest time of apples, which is one of the major cash crops in Yantai and Weihai. These large hails caused severe damages to apples, and the tornado destroyed several 100 houses. This strong convective weather caused hundreds of millions of yuan in economic losses to Yantai and Weihai and reached the standard of a large-scale meteorological disaster.
3.2. Synoptic Scale Background and Atmospheric Stratification Conditions
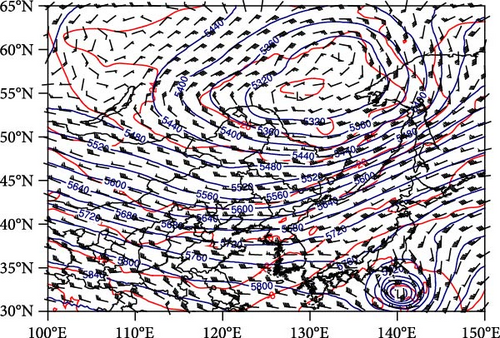
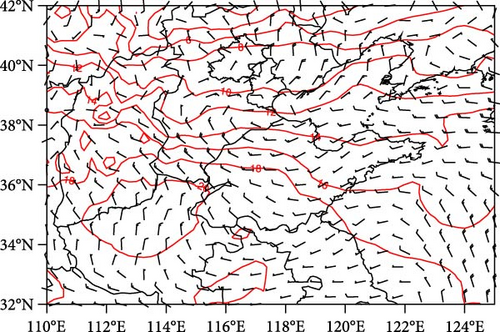
From 500 hPa at 08:00 BTC on 1 October (Figure 2a), Shandong was at the bottom of the upper-air cold vortex trough. Dominated by overall west winds, Shandong Peninsula was in the westerly jet, and wind speeds reached as high as 22 m · s−1. From 700 hPa (Figure omitted), similar to 500 hPa, Shandong was still at the bottom of the cold vortex and dominated by west winds. From 850 hPa (Figure omitted), the southern boundary of the cold vortex was significantly northward compared to that at 500 hPa and 700 hPa. From the vertical distribution of temperature, the weak cold air after 500 hPa upper-air cold vortex west wind trough (Figure 2a) moved eastward and southward, and 850 hPa temperature ridge (Figure 2b) extended from southwest to northeast. The distribution of temperature stratification in Shandong Peninsula is that the upper level was cold, and the lower level was warm. The upper-air cold vortex is the main affecting system of this process. On the one hand, the cold vortex trough forced in the synoptic scale above Shandong Peninsula; on the other hand, the dry cold air after the cold vortex trough moved southward, influenced Shandong Peninsula, formed the temperature stratification of upper cold and lower warm, which is conducive to the formation of strong convective weather. In addition, the westerly jet at the bottom of the cold vortex circulation enhanced the vertical wind shear over Shandong Peninsula, which was conducive to the development of strong convective weather.
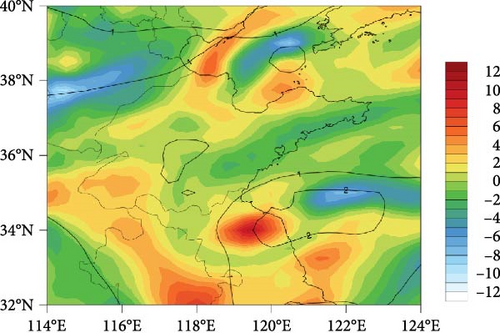
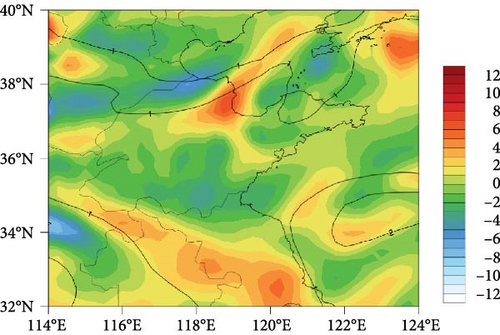
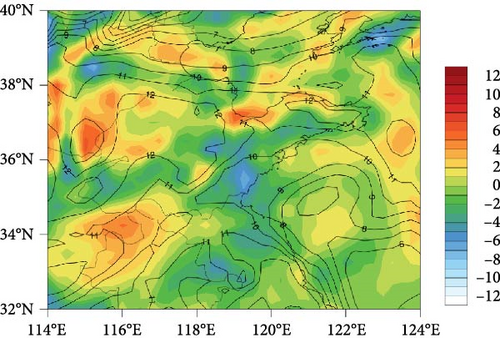
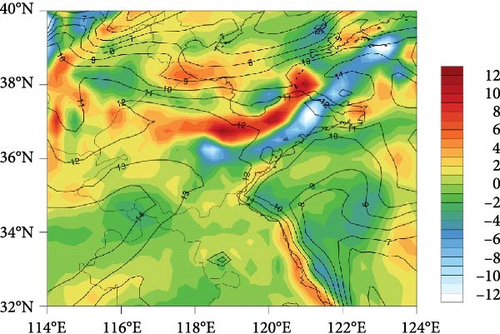
Here, select 11:00 BTC on 1 October to represent the initial stage of convection and 14:00 BTC on 1 October to represent the mature stage of convection, and then the water vapor conditions are analyzed. At 500 hPa (Figure 3a,b), the specific humidity at 11:00 BTC and 14:00 BTC in Shandong Peninsula was about 1 g · kg−1, and this means there was very little water vapor. At 925 hPa (Figure 3c,d), specific humidity in Shandong Peninsula at 11:00 BTC was basically at 10–12 g · kg−1, and at 14:00 BTC, it was slightly higher at 11–12 g · kg−1. The vertical distribution of water vapor was that dry air was at the top and wet air was at the bottom, and there was sufficient water vapor in the lower level. Compared with the specific humidity of 8.9–10.1 g · kg−1 in the process of Zhucheng extra-large hail on 16 August 2019 [28], the water vapor conditions of this process were fully satisfied the conditions for the occurrence of strong convection. The vertical motion conditions are also analyzed. At 500 hPa, there was a weak divergence in the northern and a weak convergence in the southern of Shandong peninsula at 11:00 BTC. While convergence dominated in most parts of Shandong peninsula at 14:00 BTC. At 925 hPa, there was divergence in the northern coastal area of Shandong peninsula at 11:00 BTC, but with a general intensity. It indicated that the convective system was at the initial stage, so the upward motion was still developing. There were significant convergence and divergence in Shandong peninsula at 14:00 BTC, and the intensity of divergence and convergence center was obviously increased compared with that at 11:00 BTC. The maximum value of divergence and convergence was about 12 × 10−5 s−1, indicating that the convective system was at the mature stage, and upward and downward motions were occurring at the same time.
The analysis of the temperature–logarithm-of-pressure (T–logP) plots of the soundings taken at Rongcheng station on 1 October reveals the following. At 08:00 BTC (Figure 4a), before the convection occurred, the atmospheric stratification showed an unstable state that upper level was dry and the lower level was wet. There was a certain amount of unstable energy, and the value of convective available potential energy (CAPE) was about 156.5 J · kg−1. The vertical wind shear between 0 and 3 km was about 18.8 m · s−1, and between 0 and 6 km was about 30.2 m · s−1. Both of them were strong vertical wind shear and very favorable for the development and structure organization of strong convective systems. By using the temperature and dew point of the Rongcheng surface observational station at 14:00 BTC, T–logP plots at 08:00 BTC were modified. After the modification (Figure 4b), the unstable energy of the atmospheric stratification grew exponentially and up to 2386.9 J · kg−1, which provided sufficient energy for the formation of this strong convection.
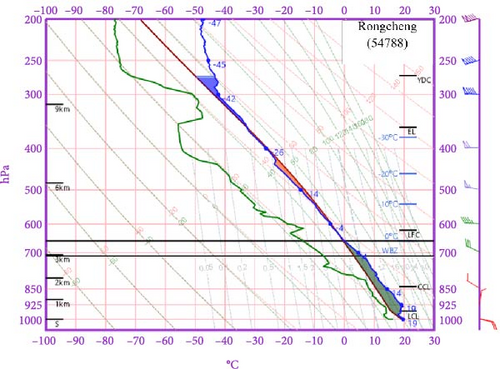
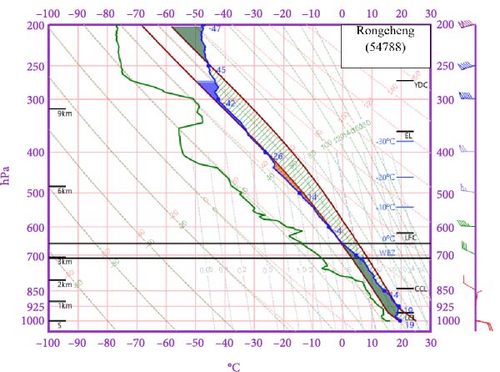
From the comparison of convective parameters before and after the modification (Table 1), the CAPE increased exponentially, and the convective inhibition (CIN) decreased significantly after the modification. The lifting condensation level (LCL) was 475.9 m before the modification and changed to 707.3 m after the modification. The low value of LCL has a beneficial effect on the emergence of tornado [2]. The HT of the wet blub zero (WBZ) remained unchanged at 2956.5 m before and after the modification, which is favorable for the occurrence of hail [31]. The temperature difference between 850 and 500 hPa was 28.9°C before and after the modification, which meets the index of strong convective weather (28°C and above) happening in Shandong. Environmental parameters such as sufficient CAPE of nearly 2400 J · kg−1 and strong vertical wind shear between 0 and 6 km at 30.2 m · s−1 contributed to the occurrence of this strong convective weather in October.
| Convective parameters | Before modification | After modification |
|---|---|---|
| CAPE (unit: J · kg−1) | 156.5 | 2386.9 |
| CIN (unit: J · kg−1) | 360.9 | 0 |
| LCL (unit: m) | 475.9 | 707.3 |
| WBZ (unit: m) | 2956.5 | 2956.5 |
| The temperature difference between 850 and 500 hPa (unit: °C) | 28.9 | 28.9 |
- Abbreviations: CAPE, convective available potential energy; CIN, convective inhibition; LCL, lifting condensation level; T–logp, temperature–logarithm-of-pressure; WBZ, wet blub zero.
3.3. Analysis of Mesoscale Characteristics
The surface distribution is revealed as follows: During the happening time of this strong convection (Figure omitted), the distribution of pressure showed that low pressure was in the east and high pressure was in the west. As the convective system moved eastward, Shandong Peninsula, located on the front of the high pressure, and weak cold air spread southward to affect the region. In a further analysis by using surface-intensive observational data, it was found that when the weak cold air was affected, some triggering and prompting development systems related to strong convection arose in both the wind and temperature fields.
Shandong Peninsula is surrounded by sea on three sides, and the thermal difference between land and sea often causes the formation of sea-breeze fronts in the atmospheric boundary layer. When the sea-breeze front moves toward inland, it will provide the triggering conditions for strong convection [32]. At 10:00 BTC on 1 October (Figure omitted), the coastal area of the northern Penglai switched from south winds to northeast winds. The persistent northeast winds from the sea and the southwest winds from the south-central part of Penglai confronted with each other, thus formed a 90 km length surface convergence line. And the distribution of the temperature field indicates that the north and south sides of the convergence line had a significant temperature difference of 4–5°C, but there was no obvious dew point difference. It shows that the convergence line was the sea-breeze front. At 11:00 BTC (Figure 5a), the sea-breeze front moved slowly and was still located in the northern Penglai. This region had some convective cells developing. At 12:00 BTC (Figure 5b), these convective cells in the northern Penglai began to move eastward to the Bohai Sea, and the sea-breeze front also moved eastward and developed. At 13:00 BTC (Figure 5c), under the influence of the eastward moving sea-breeze front, some new convective cells began to generate in the northern of Yantai City, moved eastward, and developed rapidly. At 14:00–15:00 BTC (Figure 5d,e), the sea-breeze front kept moving eastward and southward, and the convective cells in the northern of Yantai city also moved eastward and southward, then developed into the mature stage. During this period, extra-large hail appeared, new convective cells were generated in the vicinity, and multiple convective cells moved and developed to Weihai. At 16:00 BTC (Figure 5f), multiple convective cells continued to move eastward and southward from Weihai with intensity weakening and then gradually disappeared into the Yellow Sea.
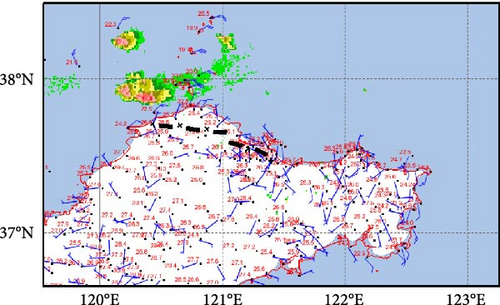
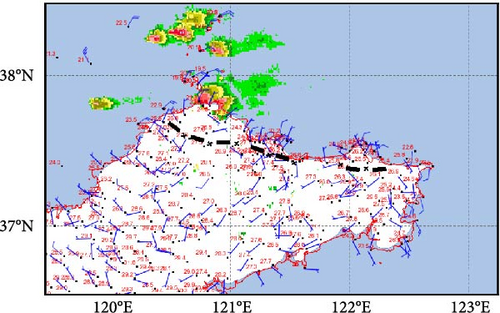
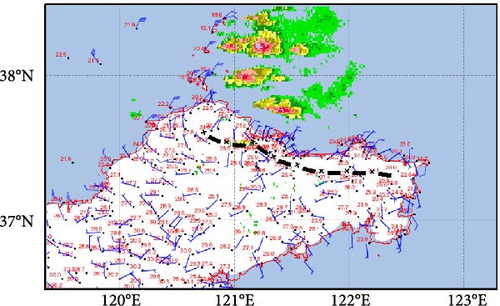
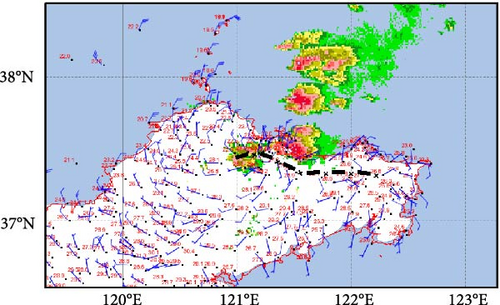
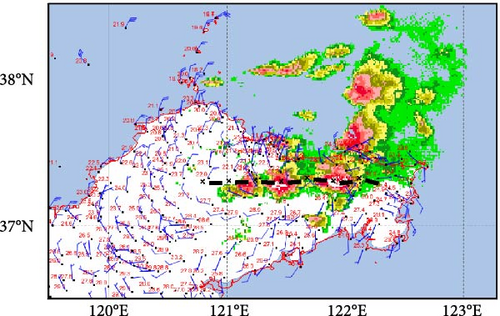
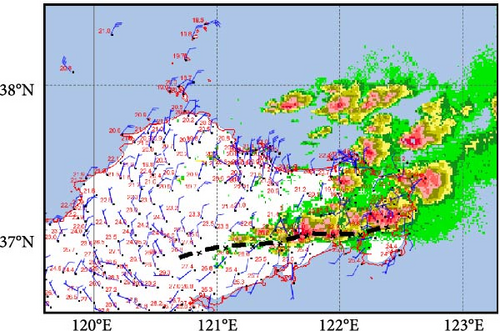
During the convective system affecting period, the sea-breeze front moved eastward and southward. In the process of moving, there were splits and mergers happening to the sea-breeze front affected by topography. The minimum range was about 30 km after splitting, and the maximum range was about 150 km after merging. Wherever the sea-breeze front arrived, it caused the development of convection in its neighbor upstream and downstream. At last, the convective area developed from Yantai to Weihai. Thus, the sea-breeze front played a triggering role for this strong convection.
4. Analysis of Dual-Polarization Radar Observational Characteristics of Extra-Large Hail
The mature stage of this strong convective process mainly arose in Yantai, so Yantai dual-polarization radar captured the features of this strong convective system well, especially the features of dual-polarization parametric about extra-large hail. Here, the observational analysis is mainly based on the dual-polarization radar parameters.
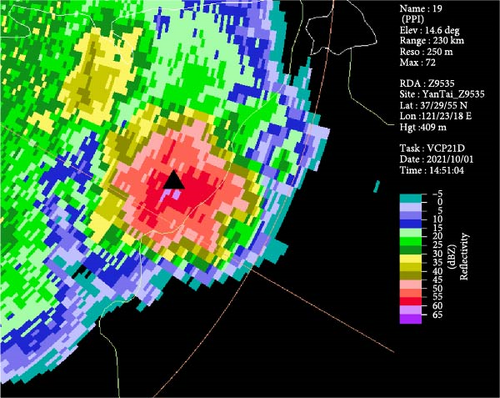
The large hails usually show significant echo features on the dual-polarization radar [33–36]. During this process, a large scale of hails occurred, and the maximum diameter of hails was 6 cm, which appeared in the Laishan District of Yantai. Since Laishan District is in the cone of silence of Yantai radar, Longquan Town of Muping District, where extra-large hails of 5 cm diameter occurred with good radar observation, is selected for analysis. On the high elevation angles of 9.9° (Figure 6a) and 14.6° (Figure 6b) at 14:51 BTC, when the moment of the extra-large hails occurred, the distribution of base reflectivity shows that there was a high-value area of strong reflectivity above 60 dBZ near Longquan Town, and there was also an obvious three-body scattering spike (TBSS) feature. They indicate that the size of the hails was very large.
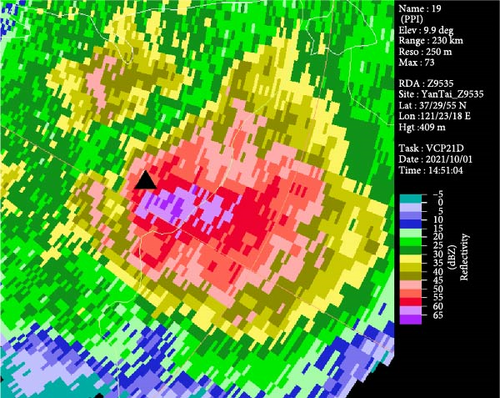
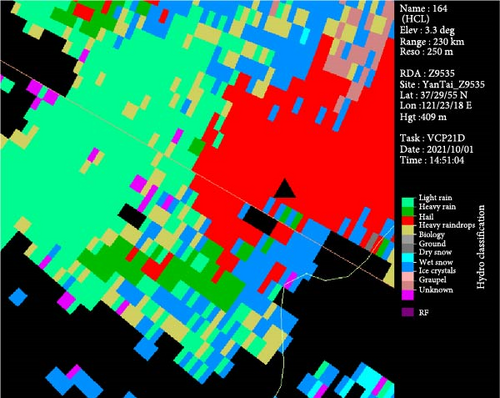
At 14:51 BTC, the particle classification products express that there were lots of hail particles over Longquan Town at both 0.5° (Figure 7a) and 3.3° (Figure 7b) elevation angles, even at elevation angles from 4.3° to 14.3°. These indicate that the layer of hail was deep; thus, there were more opportunities for the hail particles to touch and grow during the process of generation to fall. The environmental conditions were favorable to the generation of extra-large hails.

5. Analysis on the Causes of Dual-Polarization Radar Observational Characteristics of Extra-Large Hail
The extra-large hail mainly happened in the Muping District, and the vertical structure of the supercell storm is analyzed in order to explore the causes of this extreme and intense weather process.
5.1. Characteristics of Storm Parameters
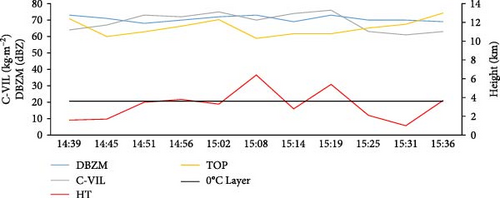
Storm parameters include the maximum reflectivity (DBZM) and its HT, cells-vertical integrated liquid (C-VIL), and the top HT of the cell (TOP). These parameters can be read directly from the storm structure product (No. 62). The supercell storm was generated in the Fushan District of Yantai City at 13:24 BTC. It developed rapidly, with the maximum reflectivity reaching 65 dBZ after two body scan times, and then the maximum reflectivity remained above 65 dBZ. The supercell storm began to weaken gradually after 16:00 BTC and entered the Yellow Sea at 16:30 BTC, finally dissipated after a 3-h duration. In the maturity stage, the storm basically moved toward the southeast, with a traveling distance of about 130 km and a speed of 43 km · h−1. During the peak time (14:39–15:40 BTC, Figure 8), the values of DBZM, C-VIL, HT, and TOP were 70.7 dBZ, 68.9 kg · m−2, 3.2 km, and 11.4 km, respectively. The HT of the strong center of the storm was always above the HT of 0°C layer (ZH), and the HT of the storm top remained above 10 km. During the happening period of extra-large hails from 14:20 BTC to 15:00 BTC, the value of DBZM was higher than 68 dBZ, accompanied by a significant bounded weak echo region (BWER) and TBSS. A mesocyclone appeared from 14:39 BTC to 15:36 BTC, lasted for 57 min, and accounted for one-third of the life of the storm. The top of the mesocyclone reached 7.4 km altitude at the peak time, and the bottom of the mesocyclone was at 1.8 km. The mesocyclone had a thick thickness and strong intensity.
5.2. The Characteristics of the Storm Below 0°C Layer
The Yantai radar observational data at 14:51 BTC was selected for analysis. At that moment, the convective storm developed vigorously, and extra-large hail occurred at Longquan Town. The value of DBZM, C-VIL, HT, and TOP were 68 dBZ, 73 kg · m−2, 3.5 km, and 11 km, respectively. The HT of 0°C layer is about 3.6 km, and here, it distinguishes into two parts below and above 0°C layer for characteristics analysis.
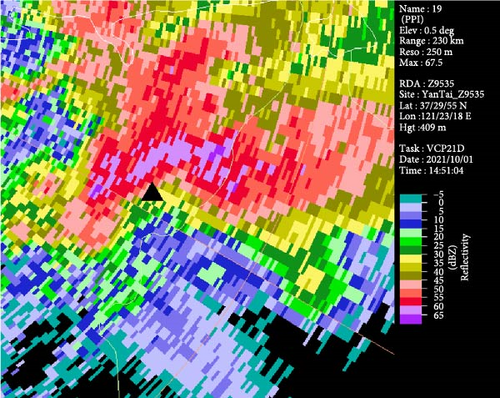
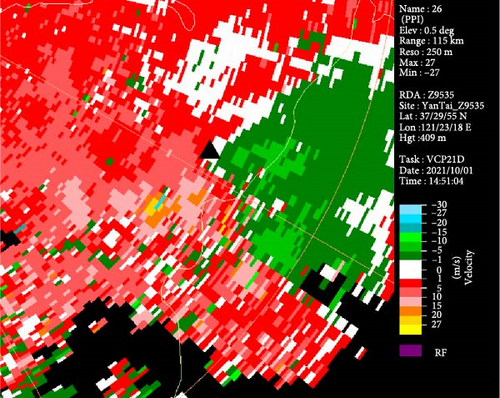
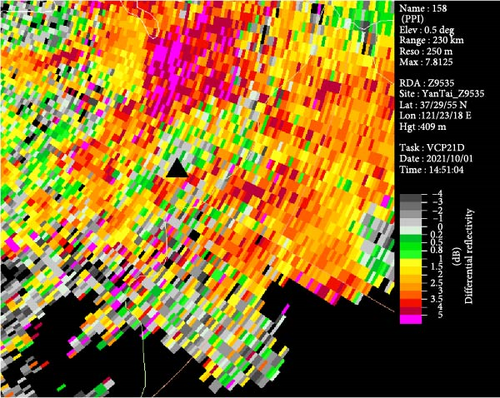
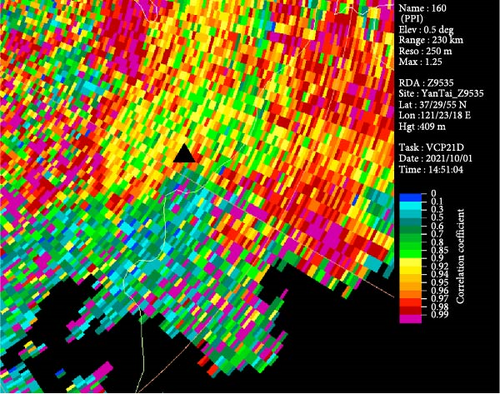
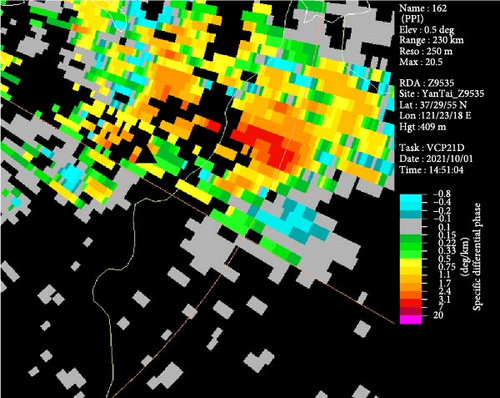
Figure 9a–e shows the base reflectivity, base radial velocity, ZDR, CC, and KDP at the 0.5° elevation angle of Yantai dual-polarization radar at 14:51 BTC. The altitude of the location of the supercell storm is ~0.8 km. The low-level strong reflectivity region (≥50 dBZ, the same as below) of this supercell storm had an east–west length of 18 km and a north–south width of 10 km. The reflectivity at Longquan Town was in the range of 60–65 dBZ. The base radial velocity shows that there was radial convergence at Longquan Town. The value of ZDR at Longquan Town was mixed by positive and negative and the minimum value was about −3 dB. The value of CC at Longquan Town was basically in the range of 0.9–0.95, while the value of KDP at Longquan Town, where the high reflectivity appeared, was in the range of 2.4–3.1° · km−1.
5.3. The Characteristics of the Storm Above 0°C Layer
Figure 10a–e shows the base reflectivity, base radial velocity, ZDR, CC, and KDP at the 6.0° elevation angle of Yantai dual-polarization radar at 14:51 BTC. The altitude of location of the supercell storm is ~4.7 km. The size of strong reflectivity (≥50 dBZ) region was close to that of 0.5°. The value of reflectivity at Longquan Town reached more than 60 dBZ, and the highest reached 67.5 dBZ. The base radial velocity shows that there was radial dispersion at Longquan Town. The ZDR gives a result that Longquan Town was in the value range of −1−1 dB. The CC shows that the value of Longquan Town was in the lower range of 0.85–0.95. The KDP makes it clear that the value of Longquan Town was basically in the range of −0.4−0.75° · km−1.
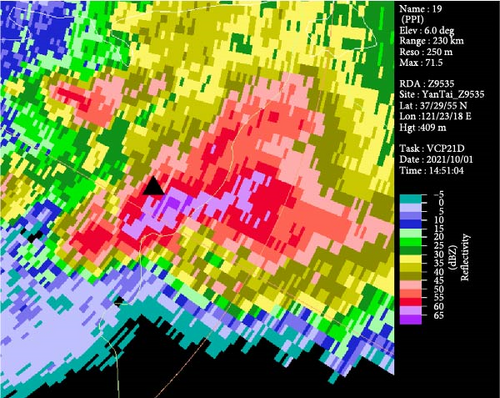
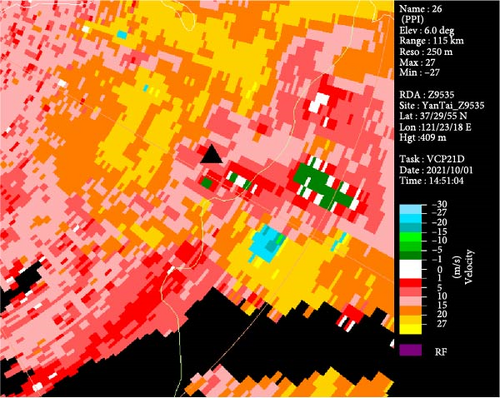
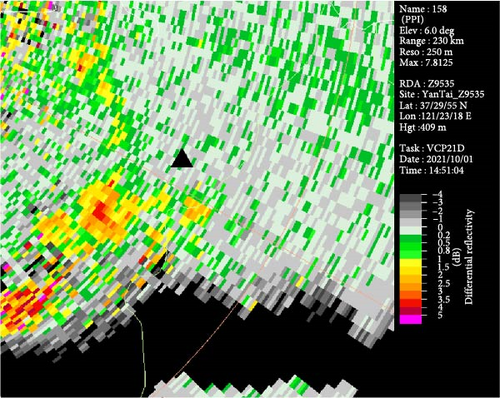
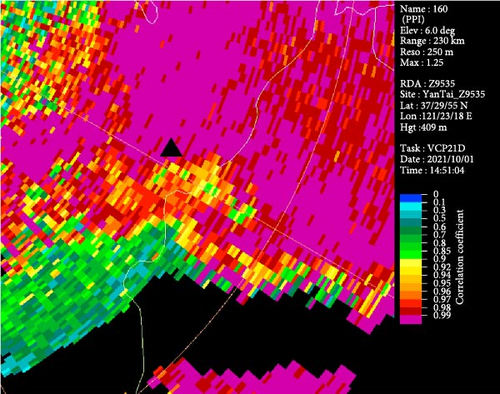
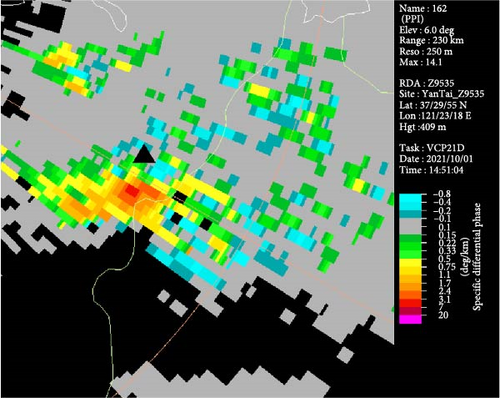
The differences arise in dual-polarization characteristics exhibited by the storm of different HTs in extra-large hail regions. It (Table 2) shows that ZDR, CC, and KDP are significantly different at different HTs. The value of ZDR is lower below 0°C layer than that above 0°C layer; meanwhile, the values of CC and KDP are higher below 0°C layer than that above 0°C layer.
| Classified strong convection | Height | ZDR (unit: dB) |
CC | KDP (unit: ° · km−1) |
|---|---|---|---|---|
| Extra-large hail | Below 0°C layer | −3 | 0.9–0.95 | 2.4–3.1 |
| Above 0°C layer | −1–1 | 0.85–0.95 | −0.4–0.75 |
5.4. Vertical Structural Characteristics of the Storm
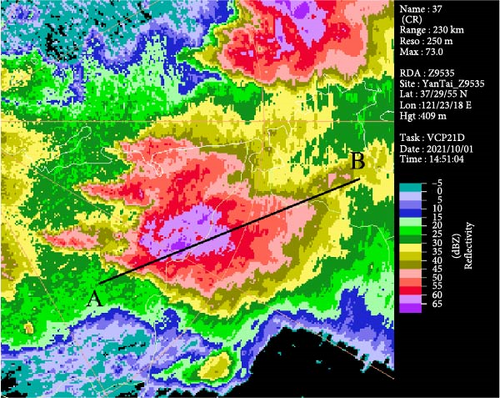
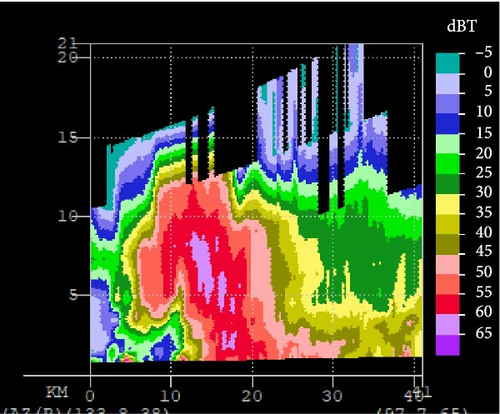
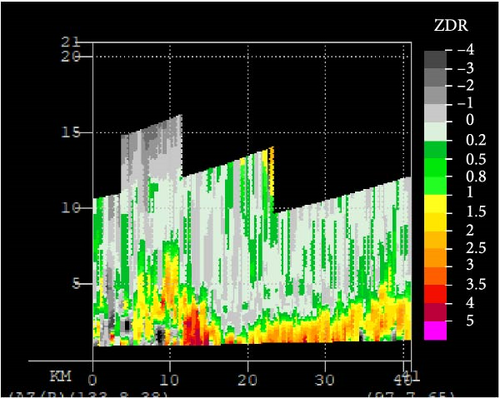
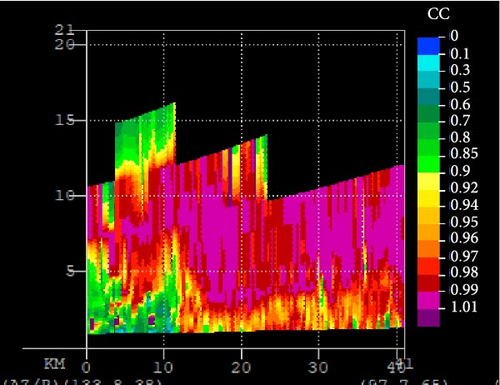
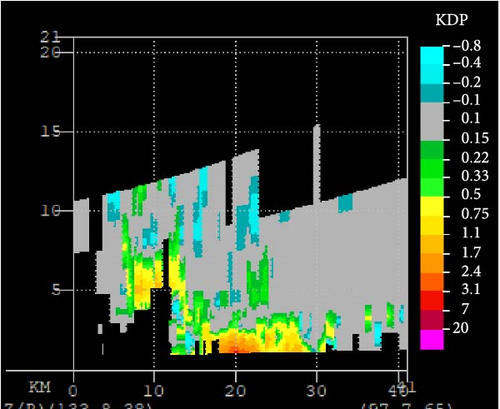
Vertical profiles of the supercell storm are analyzed. The exact location of the profiles is shown in Figure 11 a, and the vertical profiles of the base reflectivity, ZDR, CC, and KDP at 14:51 BTC are given in Figure 11b–e. It is clear that the supercell storm is mature, with a significant feature of having BWER and TBSS. The top of the reflectivity (≥60 dBZ) reached 12 km HT, and the top of the reflectivity (≥65 dBZ) reached 8 km HT. The HT of the −20°C layer was about 6.4 km, and the HT of the strong reflectivity above 65 dBZ exceeded the −20°C layer with a thickness of about 7 km. It suggests the presence of large hail particles. The vertical profile of ZDR shows that there were two ZDR columns; one was located on the west side, and the other was located on the east side of the BWER. The bottom of these two ZDR columns both started from the 0°C layer at 3.8 km, and the top reached to 6 and 7 km. The top of the ZDR column on the west side was between the −20 and −10°C layers with a thickness of about 2.2 km, while the ZDR column on the east side exceeded the HT of the −20°C layer with a thickness of about 3.2 km. Thus, the ZDR column on the east side was obviously thicker than that on the west side. The thickness of ZDR column was more than 2 km on both sides, indicating that the storm’s updraft was strong and favorable for hail formation and growth [36]. The vertical profile of CC gives a result that the values were all below 0.9 in BWER, and indicates that there were mixed-phase particles or large hail particles in the updraft. The vertical profile of KDP makes it clear that there were two KDP columns on the east and west sides of the BWER. The thicknesses of the two KDP columns were almost the same, with the bottom starting from the 0°C layer at 3.8 km and the top to 7 km. These KDP columns were stretched over the altitude of the −20°C layer and the thicknesses of the columns were about 3.2 km. It indicated that the phases of particles in the updrafts were more complicated, and there were some small liquid particles, wet ice particles, and large hails together in the updrafts [28]. The thickness of the strong reflectivity (≥65 dBZ) reaches 7 km, and the thickness of the ZDR and KDP columns reaches 2–3 km and can be used as a reference basis for forecasting extra-large hails in the autumn short-range forecasts.
6. Conclusion and Discussion
- 1.
Affected by the upper-level cold vortex, a severe convective weather with extra-large hail occurred from west to east in the northern coastal area of Shandong Peninsula. The season of this convection occurred in, and the intensity of the process both indicate that this process is significant extreme weather.
- 2.
The upper-level cold vortex provided the synoptic-scale dynamic forcing, while the dry cold air behind the trough of the cold vortex went south and influenced Shandong Peninsula. Unstable thermal stratification forms, and its structure was upper cold and lower warm, which were conducive to the occurrence of severe convective weather. About 2400 J · kg−1 sufficient CAPE and 30.2 m · s−1 strong vertical wind shear between 0 and 6 km altitude prompted this severe convective weather to arise in October.
- 3.
Due to the special geographical environment of Shandong Peninsula, whose northern area is along the coast, the surface sea-breeze front generated in this area. The surface sea-breeze front triggered this severe convection process, and the movement of the surface convergence line stimulated the occurrence and development of convection nearby upstream and downstream.
- 4.
The supercell storm arose in the severe convective process, and sustained about 3 h. The mean values of DBZM, C-VIL, HT, and TOP of the supercell storm were 70.7 dBZ, 68.9 kg · m−2, 3.2 km, and 11.4 km, respectively. The hazards caused by this supercell storm were dominated by hails. The TBSS and BWER of the storm were very significant.
- 5.
The analysis of the dual-polarization radar characteristics shows that the difference of the storm in the areas where extra-large hail occurred was remarkable below and above 0°C layer. The value of ZDR is lower below 0°C layer than that above 0°C layer; meanwhile, the values of CC and KDP are higher below 0°C layer than that above 0°C layer.
- 6.
In the supercell storm, the HT of reflectivity above 65 dBZ exceeded that of the −20°C layer and the thickness of strong reflectivity above 65 dBZ layer was 7 km. There were two ZDR columns with a thickness of more than 2 km inside the storm, and the thickness of the ZDR column on the east side was significantly thicker than that on the west side. These ZDR columns indicated that the updrafts in some regions of the storm were strong, which was conducive to the formation and growth of hails. There were also two KDP columns on the east and west sides of the BWER, which both extended beyond the HT of the −20°C layer and had almost the same thickness about 3.2 km. It indicates that there were some small liquid particles, wet ice particles, and large hails together in the updrafts. The thickness of the strong reflectivity above 65 dBZ reaches 7 km, and the thickness of the ZDR column and KDP column reaches 2–3 km can be used as a reference for predicting extra-large hail in autumn short-term forecasting.
This paper analyses the characteristics of multisource data in this extreme convective case and can provide a reference for short-range forecasts in similar processes. Since the actual convective processes are usually very complex, the universality of these conclusions of this case still needs to be verified by more similar cases. After those verifications, more reliable ideas will be provided for the forecasts.
Conflicts of Interest
The authors declare no conflicts of interest.
Funding
This research was funded by the Natural Science Foundation of Shandong Province (No. ZR2022QD089), the Forecaster Project of Shandong Meteorological Bureau (No. SDYBY2021-05), and China Scholarship Council (File No. 202305330013).
Acknowledgments
This research was funded by the Natural Science Foundation of Shandong Province (No. ZR2022QD089), the Forecaster Project of Shandong Meteorological Bureau (No. SDYBY2021-05), and China Scholarship Council (File No. 202305330013).
Open Research
Data Availability Statement
ERA5 data are available at https://cds.climate.copernicus.eu/. Various observation data, including dual-polarization radar data, were provided by the China Meteorological Administration (CMA). The data are not publicly available due to privacy or ethical concerns.


