Spatial and Temporal Pattern of Ecological Requirement of Natural Vegetation on the Qinghai–Tibet Plateau From 1991 to 2020
Abstract
The Qinghai–Tibet Plateau is a globally significant ecological barrier, and its ecological water requirement (EWR) is of great importance for the stability of regional ecosystems and water resource management. Based on meteorological data, this study employed the Penman–Monteith method, combined with the vegetation coefficient (Kc) and soil moisture limitation coefficient (Ks), to estimate the EWR and ecological water deficit (EWD) for the entire Qinghai–Tibet Plateau and its 11 climate zones from 1991 to 2020. The spatiotemporal variation patterns were also analyzed. The results indicate: (1) Among the seven major vegetation types, low cover grassland has the highest EWR (7.28 × 10¹⁰ m³), while other forest land has the lowest (0.04 × 10¹⁰ m³). (2) In the wet year (2014), normal water year (2016), and dry year (2012), vegetation growth across the Qinghai–Tibet Plateau generally shows a water surplus, with the wet year having a greater surplus than the dry year. (3) Except for the Qaidam region (HD1) and the northern Tibet region (HD2), the other nine climate zones show a water surplus. (4) The peak EWR for different zones and vegetation types occurs during the mid-growth period. The most severe water deficit in HD1 and HD2 regions occurs during the early growth stage, with precipitation addressing 12.59% and 26.08% of the deficit, respectively. This study provides a scientific basis for water resource management on the Qinghai–Tibet Plateau.
1. Introduction
Ecological environment is the foundation of human survival and development, and water energy plays a key role in the maintenance of ecological environment [1]. The status of water resources plays a decisive role in the construction of regional ecological protection [2], and the rational allocation and real-time scheduling of water resources are important links in basin management [3]. In the social environment dominated by industrial economy, the contradiction between supply and demand of water resources gradually intensifies along with the shortage of water resources [4–6]. Ecological water requirement (EWR) is the total amount of water required by the system to maintain the virtuous cycle of the ecosystem and to ensure its development and equilibrium [7]. Research on EWRs is conducive to the rational allocation and utilization of water resources. EWRs mainly include river EWRs, vegetation EWRs, EWRs for lake and wetland restoration, and urban EWRs [8]. As an important component of the ecosystem, vegetation has the ecological functions of water retention, soil consolidation, and moisture increase and has important ecological significance in restraining land desertification, building regional ecology, and maintaining ecosystem stability [9]. Vegetation EWR refers to the minimum amount of water consumed to ensure the natural growth and development of vegetation, or to make the vegetation ecosystem healthy and stable and provide normal ecosystem services [10]. It is an important index to judge whether the vegetation ecosystem will be degraded and whether the degraded vegetation ecosystem can be reconstructed [11]. The normal growth of vegetation needs to consume a certain amount of water resources, and the difference in vegetation types and growth conditions will affect the change in water requirement of vegetation [12]. Therefore, studying the temporal and spatial changes of EWRs of vegetation to meet the water requirements of natural growth of vegetation to ensure its normal growth can provide a strong guarantee for regional ecosystem restoration, water resource management and allocation, and coordinated development of ecology and economy [13].
According to the vegetation type, growth status, and water resources status in different study areas, there are different methods to study the EWR of vegetation [14]. The area quota method is mostly used in studies where meteorological monitoring data are relatively complete and the growth base conditions are favorable [15] because the method requires access to the potential evapotranspiration of vegetation and the amount of water consumed for watering. The phreatic water evaporation method [16] is often used to estimate the EWR of vegetation in arid regions where vegetation growth is mainly dependent on underground water. The water balance method does not consider the differences in the water demand characteristics of different ecosystem structures and functions [17], so there are limitations in its application. Although remote sensing methods can be used to estimate the EWR of vegetation over large areas [18], the results estimated for remotely sensed datasets need to be corrected with measured data, which are often difficult to obtain over large areas.
Potential evapotranspiration from vegetation using the Penman–Monteith (P–M) equation, combined with the soil moisture limiting coefficient (Ks), the vegetation growth limiting coefficient (Kc) [19], and the nonstandard conditions crop evapotranspiration rate of vegetation (ETcadj) can be calculated. However, this formula requires many meteorological parameters, which makes it difficult for this formula to calculate EWR in areas with relatively insufficient meteorological stations in China, such as arid and semi-arid areas and Qinghai–Tibet high-cold areas [20]. Hargreaves formula is also recommended by FAO to calculate the potential evapotranspiration of vegetation, and this method is more commonly used to estimate the potential evapotranspiration of vegetation in regions where basic data are relatively difficult to obtain [21]. In the process of calculating the EWR of vegetation by using Penman–Monteith method, when it is difficult to obtain all the meteorological parameters required for calculating the potential evapotranspiration of vegetation by using Penman formula, the Hargreaves formula can be used instead of the Penman formula to calculate the potential evapotranspiration of vegetation. Some scholars [22] calculated the potential evapotranspiration of vegetation in Qinghai Province based on Hargreaves’ modified formula and assessed that the formula has good applicability in the Northwest Yellow River Basin.
The Qinghai–Tibet Plateau, known as the “third pole” of the earth, is the largest and highest plateau in the world. As the “water tower of Asia”, it provides water resources for more than 20% of the world’s population [23]. The Qinghai–Tibet Plateau is an important ecological security barrier [24], and the EWR of vegetation is closely linked to the regional ecology [25]. For the time being, most studies on vegetation EWR in the southeastern part of the Qinghai–Tibet Plateau have focused on limited research areas such as ShuLe River basin [26], HeiHe River basin [27], and ShiYang River basin [28]. However, there are few studies on the EWRs of vegetation in other regions of the Qinghai–Tibet Plateau and even in the whole region. In terms of estimating the EWR of vegetation, considering the convenience of collecting meteorological data, soil hydrological data, and vegetation-related parameters, most of the current domestic mainstream studies focus on the catchment scale. However, the main purpose of the research on estimating the EWR of vegetation is to facilitate the reasonable allocation of water resources by relevant local departments. At present, China has set up corresponding water management institutions based on the division of water areas, such as the river chief system at the four levels of province, city, county, and township [29], but because water resources are important resources that need comprehensive consideration and overall planning [30], the management of social and economic water consumption in various regions is mainly subject to the vertical administrative management of counties and cities [31]. Therefore, the relevant research scale of vegetation EWR should be raised from the watershed scale to a larger scale. Obtaining information on the EWR of natural vegetation throughout the Tibetan Plateau will enable a better understanding of its hydrological processes and facilitate the restoration and reconstruction, maintenance, and protection of the plateau ecosystem [32].
Based on the above background, this study is based on the potential evapotranspiration of natural vegetation obtained from Hargreaves formula, combined with soil moisture, vegetation coverage area and vegetation characteristics, and adopted the method recommended by the Soil and Water Conservation Service (SCS) of the United States Department of Agriculture to calculate effective precipitation and analyze the EWR and water shortage of vegetation in the Qinghai–Tibet Plateau and their temporal and spatial changes. The purpose of this study is to: (1) fully reveal the temporal and spatial variation characteristics of EWR and ecological water deficit (EWD) of natural vegetation in the Qinghai–Tibet Plateau; (2) EWR of different regions in the Qinghai–Tibet Plateau was calculated, and EWRs of vegetation at different growth stages in different regions were discussed, in order to provide data support and effective suggestions for water resources management, rational allocation, ecological restoration, and development of the Qinghai–Tibet Plateau.
2. Materials and Methods
2.1. Study Area
The Qinghai–Tibet Plateau (26°00′–39°47′N, 73°19′–104°47′E) is located in the southwest of China [33], with an average elevation of over 4000 m [34] and a total area of about 2.5 million km2 [35]. It is the highest and largest plateau in China and the highest in the world [36]. It is known as the “Roof of the world” [37]. The Qinghai–Tibet Plateau extends from the southern margin of the Himalayas in the south to the northern margin of the Kunlun Mountains, the Altun Mountains and the Qilian Mountains in the north, the Pamir Plateau and the Karakoram Mountains in the west, and the Qinling Mountains and the Loess Plateau in the east [38]. Its unique geographical environment makes the environmental gradient change obvious. The average annual temperature ranges from −5.6°C to 3.8°C, the average annual precipitation ranges from 262.2 to 772.8 mm, and the average annual evapotranspiration ranges from 730 to 1700 mm, showing a decreasing trend from southeast to northwest [39]. The main ecosystem types include alpine meadow ecosystem, alpine grassland ecosystem, forest ecosystem, and sparse vegetation ecosystem [40]. The Qinghai–Tibet Plateau is home to a number of ethnic minorities, including Tibetans, Hui, and Mongolians, and is the richest area in China in terms of ethnic minority cultures [41, 42]. The Qinghai–Tibet Plateau exhibits a spatial pattern of relatively low-quality human settlements on the southwestern edge and the plateau hinterland and high quality on the eastern edge [43]. Although sparse population and natural conditions have constrained the development of the Qinghai–Tibet Plateau [44, 45], the region has experienced significant economic growth in the last two decades through the development of the energy sector [46].
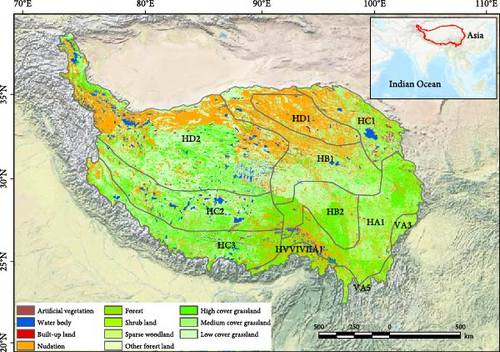
Combined with terrain characteristics and historical administrative division tradition and different underlying surface heat index [47] (Table 1), the Qinghai–Tibet Plateau can be divided into Sichuan Region (VA3) bordering northern Sichuan, Yunnan Region (VA5) bordering northern Yunnan–Guizhou Plateau, Tawang–Chayu Region (HVVIVIIA1) bordering Myanmar, Bomi-Sichuan Region (HA1) in the southeast of the Plateau, QingNan Region (HB1) and Qilian Region (HB2) in the central south of the Plateau, and the northeastern part of the Plateau with Qilian. The Qilian-Qinghai Lake Region (HC1) bordering the mountains, the Qaidam Region (HD1) in the Qaidam Basin, and the Northern Tibetan Region (HD2), Central Tibetan Region (HC2), and Southern Tibetan Region (HC3) in the west of the Qinghai–Tibet Plateau are 11 regions (Figure 1). Differences in topography, climate, and soil caused by altitude differences in the Qinghai–Tibet Plateau have diversified vegetation types in the region [48]. Affected by the unique geographical environment of the Qinghai–Tibet Plateau, more than 60% of the plateau is covered by grassland (subdivided into alpine desert steppe, alpine steppe, and alpine meadow), and other vegetation types include shrubs mainly distributed in the southern and central parts of the Qinghai–Tibet Plateau, and broad-leaved forests and coniferous forests in the south and east [49].
| Region | Climatic characteristics | Vegetation characteristics |
|---|---|---|
| VA3 | Temperate dry climate, high annual precipitation | Temperate forests, arid zones, alpine meadows |
| VA5 | Subtropical highland climate, uniform precipitation distribution | Subtropical evergreen broadleaf forests, coniferous forests, grasslands |
| HB1 | Plateau continental climate, dry and cold | Plateau meadows, semi-arid grasslands |
| HB2 | Temperate monsoon climate, abundant precipitation, dry winters | Grasslands, shrubs, forests |
| HC1 | Monsoon and Plateau climate, low annual precipitation, high evaporation | Grasslands, sparse forests, plateau meadows |
| HD1 | Arid climate, extremely low annual precipitation, intense evaporation | Deserts, gobi vegetation, shrubs |
| HD2 | Cold and dry alpine climate, significant diurnal temperature variation | Alpine grasslands, dwarf trees, sparse shrubs |
| HC2 | Plateau climate, moderate annual precipitation, warm summers | Grasslands, alpine meadows, cold-resistant rainforests |
| HC3 | Humid climate, high annual precipitation | Forests, subtropical grasslands, bamboo forests |
| HVVIVIIA1 | High-altitude humid zone, high precipitation | Subtropical evergreen broadleaf forests, coniferous forests |
| HA1 | Complex climate (monsoon-influenced), dry | Mountain evergreen broadleaf forests, forest meadows |
2.2. Data
The vector boundary data of the Tibetan Plateau used in this study are from the Global Change Scientific Research Data Publishing System (https://www.geodoi.ac.cn/WebCn/). From 1991 to 2020, the potential evapotranspiration data set of natural vegetation growth period and the monthly precipitation data set of China were obtained from the National Tibetan Plateau Scientific Data Center (https://data.tpdc.ac.cn/). Its spatial resolution is 1 km. Climate zone data were sourced from the Resources and Environment Science and Data Center (RESDC), which provides the latest version of climate classification data for China (https://www.resdc.cn/). The data on land use type were derived from the 1:100,000 remote sensing monitoring data set of multiperiod land use in China established by the Institute of Geographic Sciences and Natural Resources Research of the Chinese Academy of Sciences (CNLUCC, China land use-cover change, https://www.resdc.cn/). Soil texture data were obtained from the Harmonized World Soil Database (HWSD), maintained by the Food and Agriculture Organization (FAO; https://www.fao.org/soils-portal/en/). The above data sets were combined with the Tibetan Plateau range vector data to extract the relevant data of the Tibetan Plateau using GIS software.
2.3. Estimates of EWR
Among them, Ks is the soil moisture limitation coefficient in the state subjected to water stress; Kc is the vegetation limitation factor, which is determined by the type and growth of the natural vegetation, ETp is the evapotranspiration rate of vegetation (mm day−1) in its natural state corresponding to different vegetation types, which is the EWR quota per unit area of natural vegetation.
Tmax represents the maximum temperature (°C), Tmin represents the minimum temperature (°C), Tmean represents the average temperature (°C), Ra represents the outer space radiation, which is calculated from the solar constant, the sun–earth distance, and the equatorial dimension, etc., and C0 is the conversion coefficient, which is C0 = 0.000939 when the unit of Ra is MJ m−2 day−1; C0 = 0.0023 when the unit of Ra is in mm day−1 [51]
In this equation, EWR is the total EWR of vegetation in different areas (m³); Ap is the total area of different vegetation types (m2); ETp, n is the natural vegetation evapotranspiration rate (mm day−1) on day n, obtained from the potential evapotranspiration of vegetation and the soil moisture limiting factor and the vegetation limiting factor; N is the total number of growing days for different vegetation types (day).
In previous studies [53, 54], Kc are mostly fixed values, in order to dynamically analysis the water demand of vegetation growth at different growth stages, combined with the types of vegetation in the study area and the growth of each vegetation type, and referring to the results of existing related research [55–58] protocoled coefficient Kc (Table 2).
| Types | April | May | June | July | August | September | October |
|---|---|---|---|---|---|---|---|
| Forest land | 0.30 | 0.30 | 1.32 | 1.32 | 1.32 | 0.62 | 0.62 |
| Shrub land | 0.27 | 0.27 | 1.00 | 1.00 | 1.00 | 0.40 | 0.40 |
| Sparse woodland | 0.46 | 0.46 | 0.86 | 0.86 | 0.86 | 0.59 | 0.59 |
| Other forest land | 0.40 | 0.50 | 0.60 | 0.60 | 0.60 | 0.50 | 0.40 |
| High cover grassland | 0.20 | 0.20 | 0.20 | 1.05 | 1.05 | 0.45 | 0.45 |
| Medium cover grassland | 0.34 | 0.34 | 0.34 | 0.47 | 0.47 | 0.32 | 0.32 |
| Low cover grassland | 0.37 | 0.37 | 0.37 | 0.47 | 0.47 | 0.47 | 0.29 |
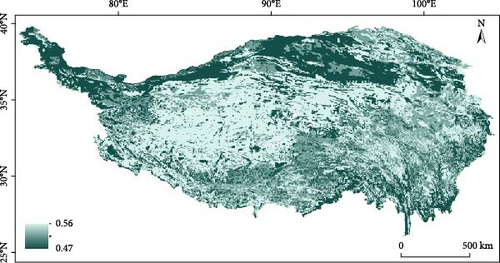
S represents the actual water content of soil (g/kg); SW represents soil wilting water content (g/kg). S∗ indicates the critical soil water content (g/kg), which is generally 70%– 80% of the field water capacity. When the water requirement of vegetation growth is exactly satisfied, the water requirement of vegetation growth is the minimum EWR. Based on Saxton et al. [61] and the method of calculating Ks by soil texture, combined with literature [62, 63], the soil water limiting coefficient Ks of the study area is obtained (Figure 2).
2.4. The EWD Model
EPn is the effective precipitation on day n (mm day−1). α is the precipitation infiltration coefficient, when the precipitation p > 50 mm, α = 0.7–0.8 [65], combined with the geological and geomorphological characteristics of the Qinghai–Tibet Plateau, the value of this study is 0.7; when 5 < p < 50 mm, α = 1; when the precipitation is 0 ≤ p ≤ 5 mm, α = 0.
2.5. Data Statistics and Analysis
Using the Mann–Kendall (MK) trend analysis, the results of the calculation of ETps (Spatial average of vegetation evapotranspiration) and EWp for 1991–2020 were analyzed over time to assess long-term trends. The slope (T) indicates the direction of the trend for ETps and EWp: The level of significance was judged at a p-value of 0.05, when p < 0.05, the change was significant and when p > 0.05, the change was not significant.
2.6. Frequency Analysis
n is the number of items in the series; m is the order in which the items are arranged, and a and b are conditional constants or variable numbers. In this study, the empirical frequencies of different hydrological years were calculated by using Spss, and 25%, 50%, and 75% were selected as the assurance rates for classifying the flat water year, abundant water year, and dry water year with reference to Qin et al. [67].
3. Results
3.1. Characteristics of Spatial and Temporal Changes (ETps, EPs, EWp)
From 1991 to 2020, ETps in the Qinghai–Tibet Plateau did not change significantly, with the overall spatial average fluctuating around 125 mm, EWR ranging from 17.21 × 10¹⁰ to 21.05 × 10¹⁰ m³, and the difference between the maximum and minimum values was 3.84 × 10¹⁰ m³ (Figure 3). During the study years, the precipitation in the Tibetan Plateau region showed an increasing trend. Due to the increase of precipitation, the water deficit in the whole Tibetan Plateau region decreased, and the total surplus water increased.
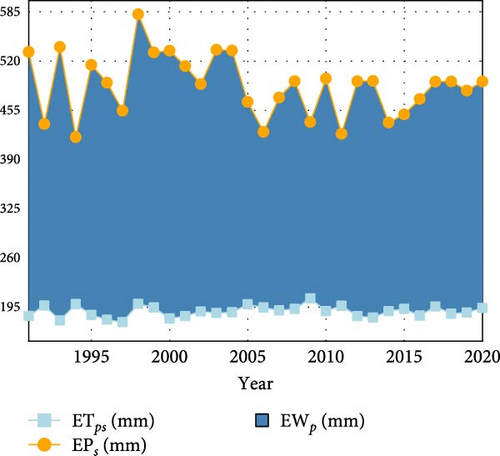
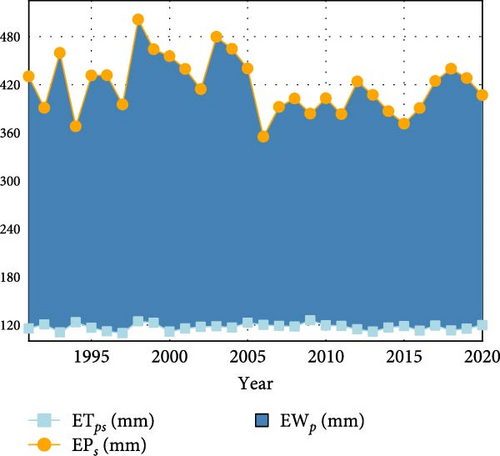
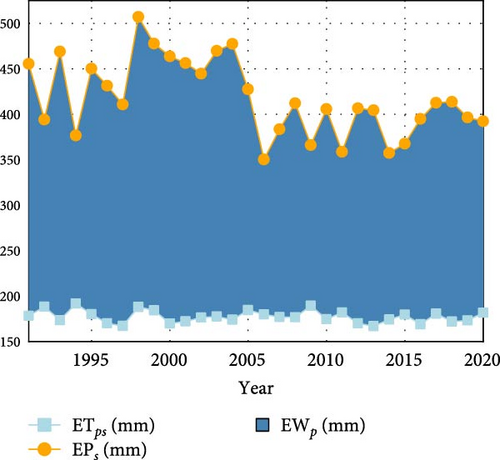
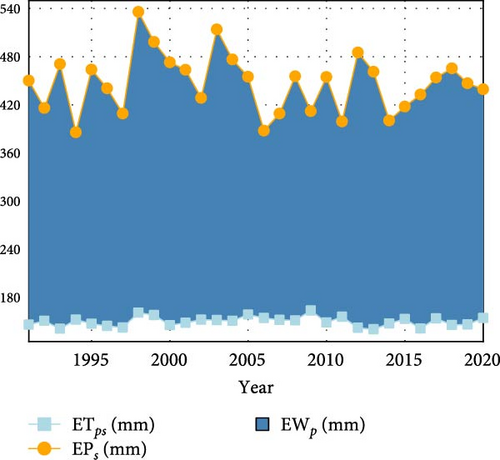
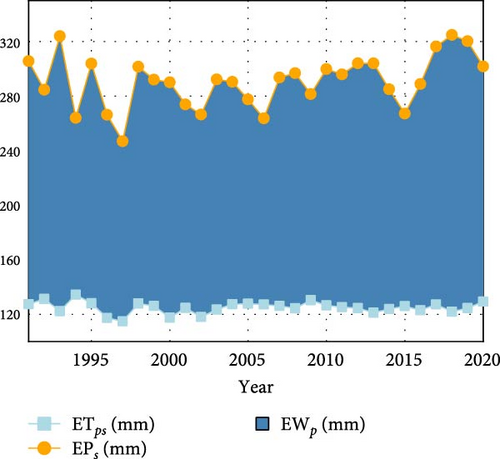
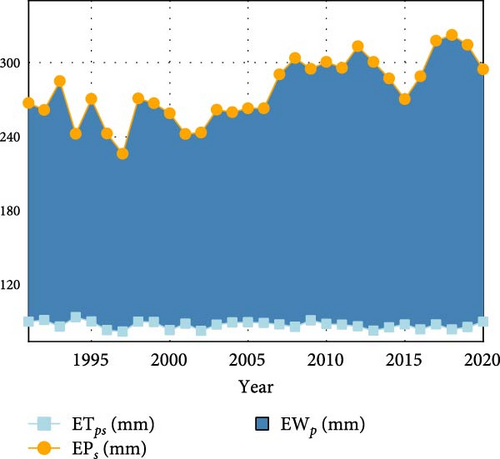
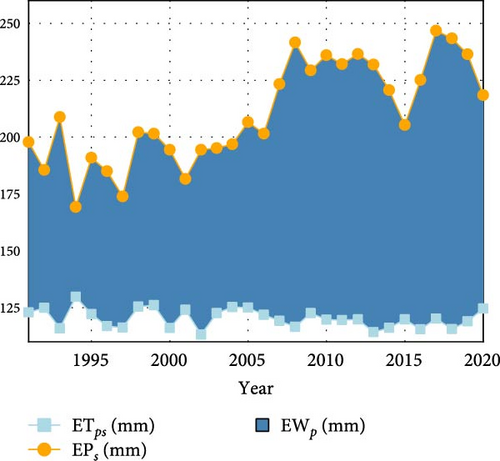

The cumulative vegetation evapotranspiration rate (ETps), cumulative effective precipitation (EPs), and vegetation ecological deficit water quota (EWp) of different vegetation types in the Qinghai–Tibet Plateau during their growth period from 1991 to 2020 were calculated and obtained, respectively, and their interannual spatial average changes were shown in Figure 3. The results showed that the effective precipitation of forest land, shrub land, sparse woodland, and other forest land was in three different stages: from 1991 to 1998, from 1999 to 2006, and from 2007 to 2020. For the three planting types of high cover grassland, medium cover grassland, and low cover grassland, the effective precipitation showed a decreasing trend before 1997, while the effective precipitation showed a fluctuating increase after 1998. In the Tibetan Plateau, the ETps of the above seven vegetation types were all lower than the cumulative effective precipitation EPs. ETps did not show a clear tendency to change with EPs changes.
The average ETps and EWp of seven vegetation types in the Qinghai–Tibet Plateau during 1991–2020 were calculated, and their change trends were calculated year by year, and the EWR and EWD of seven vegetation types were calculated, respectively (Table 3).
| Types | ETps | EWp | TETps | TEWp | pETps | pEWp | EWR | EWD | Area (km2) |
|---|---|---|---|---|---|---|---|---|---|
| Forest land | 189.26 | −298.42 | 0.23 | 1.57 | 0.43 | 0.10 | 2.31 | −3.64 | 122082.4 |
| Shrub land | 117.4 | −301.47 | 0.01 | 1.09 | 0.97 | 0.19 | 1.17 | −3.01 | 99734.59 |
| Sparse woodland | 177.46 | −240.29 | −0.18 | 2.23 | 0.34 | 0.01 | 0.64 | −0.86 | 36020.62 |
| Other forest | 150.02 | −296.76 | 0.06 | 0.51 | 0.72 | 0.50 | 0.04 | −0.07 | 2591.93 |
| High cover grassland | 124.94 | −165.79 | −0.06 | −0.71 | 0.50 | 0.12 | 3.44 | −4.56 | 275550.02 |
| Medium cover grassland | 88.27 | −189.13 | −0.12 | −2.24 | 0.06 | 6.43 × 10⁻⁵ | 4.31 | −9.23 | 488470.02 |
| Low cover grassland | 120.35 | −90.04 | −0.16 | −2.15 | 0.09 | 3.51 × 10⁻⁶ | 7.28 | −5.44 | 604655.1 |
The order of ETps in the Qinghai–Tibet Plateau region from high to low was forest land> Sparse woodland > other forest land > high cover grassland > low cover grassland > shrub land > medium cover grassland. Between 1991 and 2020, ETps for forest land, shrub land, and other forest land showed an increasing trend, but the trend was not significant (p > 0.05). The ETps of the other five vegetation types showed a decreasing trend with p-values greater than 0.05, again indicating insignificant changes. Overall, none of the trends in ETps for vegetation types on the Qinghai–Tibet Plateau reached statistical significance, suggesting that changes in evapotranspiration in the region over the last 30 years have not been significant.
All seven vegetation types mentioned above have negative EWp, indicating that the water requirement for vegetation growth in the region is met in terms of spatial average distribution, i.e., the effective precipitation obtained by the vegetation exceeds the amount of water required for its growth. According to the trend change analysis of Tewp, among the seven vegetation types, forest land, shrub land, sparse woodland, and other woodland showed an increasing trend. The change in EWp of thinned woodland was significant (p < 0.05), while the change in the other three woodland types was not significant. Although the water requirement for vegetation growth in the sparse wood land type was still in a state of fulfillment, the trend of decreasing surplus water was obvious, while the trend of the other three woodland types was not significant. High cover grassland, medium cover grassland, and low cover grassland all showed a decreasing trend. The p of the medium cover grassland and low cover grassland were much less than 0.05, indicating that the changes were significant, while the changes of the high cover grassland were not significant. The total amount of surplus water in the subsurface of grassland with three different cover levels showed an overall increasing trend, but the significance of the changes varied.
The low coverage grassland has the widest distribution, with the largest area of 60,4655 km2, and the largest EWR (7.28 × 10¹⁰ m³). Although the ETps of sparse woodland and other forest land is larger than that of grassland, the EWR of them is the smallest among the seven vegetation types, 0.64 × 10¹⁰ and 0.04 × 10¹⁰ m³ because their areas are 36,020.62 and 2591.93 km2, respectively, which are much lower than the three grassland types. The ETps of forest land was the highest among the seven vegetation types, which was 189.26 mm, but the EWR of forest land was also lower than that of the three grassland types, which was 2.31 × 10¹⁰ m³. The area of high coverage grassland and medium coverage grassland were 27,5550.02 and 48,8470.02 km2, respectively, and EWR were 3.44 × 10¹⁰ and 4.31 × 10¹⁰ m³, respectively. The difference of evapotranspiration rate of different vegetation types makes the difference of EWR of vegetation obvious, but the influence of area change on the total EWR of vegetation is more significant.
3.2. Differences in EWREWRs of Vegetation in Different Hydrological Years
The ecological water demand and water deficit of vegetation are closely related to regional precipitation, and the driving factors of vegetation ecological water demand are different in each hydrological year. In order to better explore the impact of precipitation on ecological water demand and water shortage of vegetation and provide the allocation of effective water resources in different precipitation years, the characteristics of vegetation water demand and water shortage in different typical hydrological years (dry year, normal water year, and wet year) were explored. According to the rainfall data of the Tibetan Plateau from 1991 to 2020, the maximum EPs on the Tibetan Plateau was 261.44 mm in 1998, the minimum EPs was 195.83 mm in 1994, and the average EPs in 30 years was 238.49 mm. The annual rainfall of the above years was arranged according to the increasing trend, and according to the frequency analysis method, the typical hydrological years 2014, 2016, and 2012, with guaranteed rates of 25%, 50%, and 75%, respectively, were selected as the representative dry, normal water, and wet years in the Tibetan Plateau (Table 4).
| Years | ETps | EPs | EWp | Types |
|---|---|---|---|---|
| 2014 | 115.28 | 229.49 | −114.21 | Dry year |
| 2016 | 113.57 | 238.71 | −125.15 | Normal water year |
| 2012 | 116.24 | 250.53 | −134.29 | Wet year |
According to the analysis of the selected typical hydrological years, the overall spatial vegetation growth of the Qinghai–Tibet Plateau showed water surplus in dry, normal water, and wet years, but the characteristics of vegetation water demand and water deficit were different in different hydrological years. The mean value of ETp for the three different hydrological years was 115.04 mm with a standard deviation of 1.10, and the EWp was −114.21 mm in the dry year (2014) and −134.29 mm in the abundant year (2012), and the total moisture surplus for vegetation growth was higher in the wet year than in the dry year. Precipitation is typically uneven in temporal and spatial distribution, and affected by this, vegetation growth has unique characteristics of water demand [68]. The EPs in the wet year (250.53 mm) was higher than the EPs in the dry year (229.49 mm), and the difference in ETp between wet and dry years is relatively small. This results in the total water surplus in a wet year being 17.54% higher than that in a dry year, indicating that vegetation experiences less water stress during wet years.
3.3. Characteristics of Spatial and Temporal Variability Within Climate Subregions (ETps, EPs, EWp)
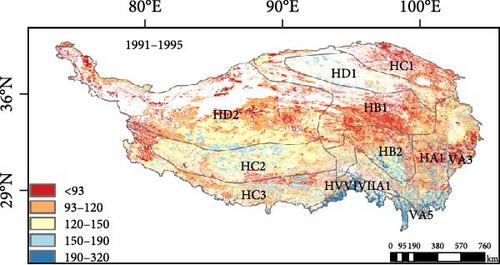
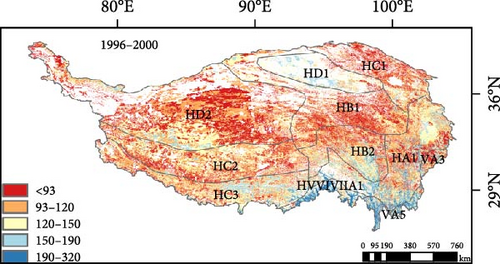
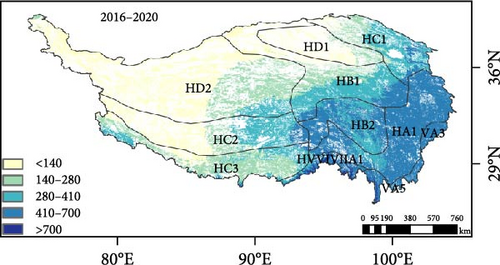
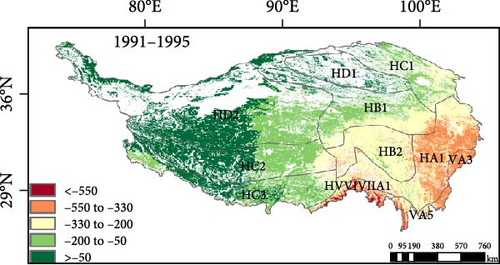
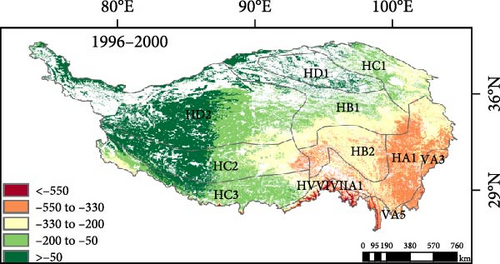
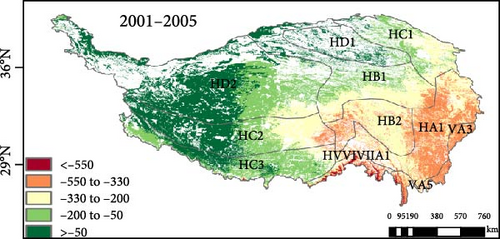
The Qinghai–Tibet Plateau is divided into 11 climate zones according to the underlying surface climate characteristics and other indicators, the average ETps, EPs, and EWp over the Qinghai–Tibet Plateau during six different periods from 1991 to 1995, 1996 to 2000, 2001 to 2005, 2006 to 2010, 2010 to 2015, and 2016 to 2020 were calculated (Figures 4–6, Table 5). The maximum values of ETps and EPs all appear in the HVVIVIIA1 region, and the effective precipitation in this region is much higher than that in other regions of the Tibetan Plateau. Therefore, the EWp water deficit in this region is the smallest in the Tibetan Plateau. The water surplus is the largest. This is related to the fact that the region is closest to the Indian Ocean, and the rainfall affected by the tropical monsoon is the highest in the entire Tibetan Plateau region. From the perspective of the whole Qinghai–Tibet Plateau, except for the HVVIVIIA1 region, the climate regions from southeast to northwest are VA5, VA3, HA1, HC1, HB2, HB1, HD1, HC3, HC2, and HD2. ETps and EPs decreased from the southeast to the northwest of the plateau, while EWp increased from the southeast to the northwest of the plateau, and EWp was positive in HD2 region in the northwest of the Plateau and HD1 region in the northeast of the Plateau, indicating that the total effective precipitation in Qaidam region on HD1 and HD2 region in Northern Tibet was lower than the evapotranspiration of vegetation. That is, the amount of water required for vegetation growth during the growth period is difficult to meet, and unlike the abundant water surplus in the southeast, the basin in the west and northeast is short of water. The four types of forest land are mainly distributed in the southern part of the Qinghai–Tibet Plateau, but the ETps of the same forest land type in different climate zones are different. Compared with the other 10 climate zones, the ETps of forest land, sparse woodland, shrub land, and other forest land in the HVVID climate zone are higher, which is related to the climate differentiation and soil type differences among different climate zones. The three grassland types with different coverage were more widely distributed than the forest types in the Qinghai–Tibet Plateau and were distributed in 11 climate zones.
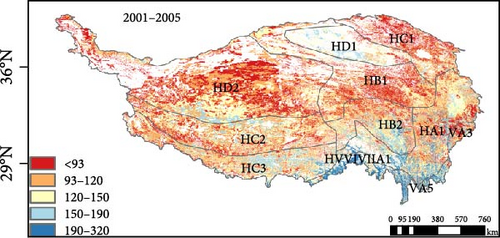
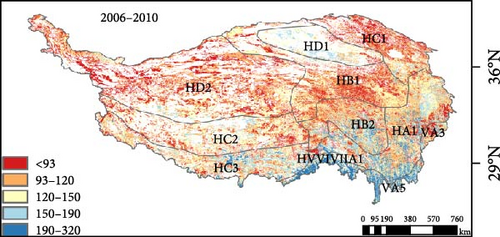
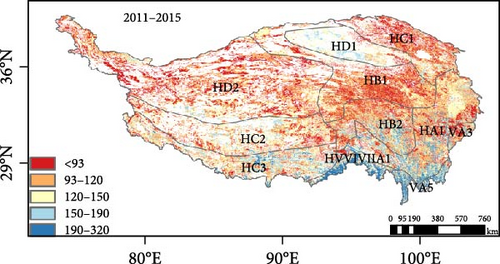
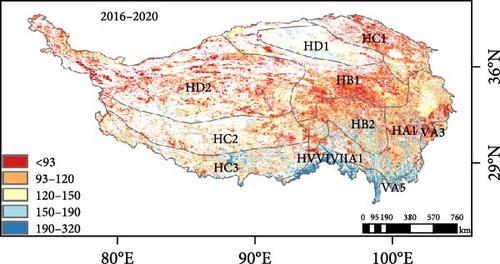
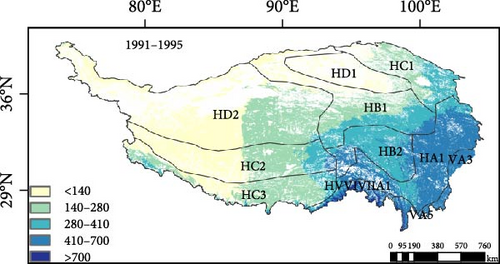
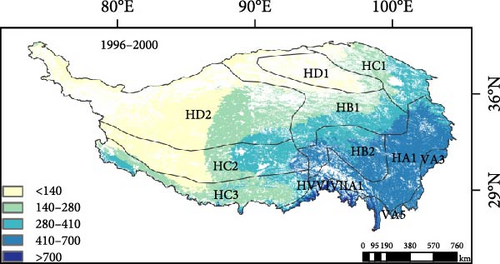
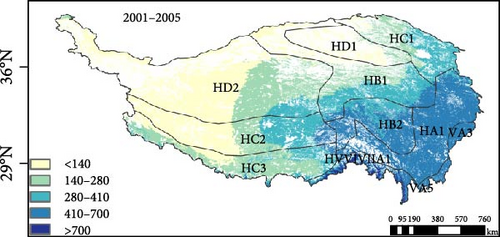

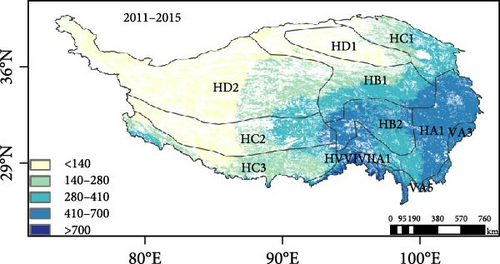
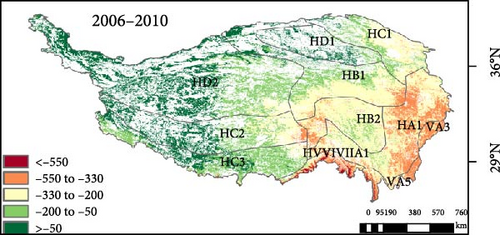

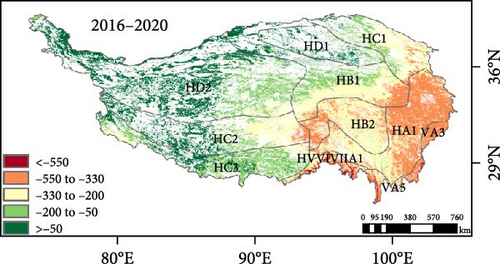
| Five-year interval | VA3 | VA5 | HVVIVIIA1 | HA1 | HB1 | HB2 | HC1 | HC2 | HC3 | HD1 | HD2 | Tibetan plateau |
|---|---|---|---|---|---|---|---|---|---|---|---|---|
| 1991–1995 | −395.18 | −351.06 | −399.43 | −325.60 | −116.39 | −275.43 | −137.75 | −35.42 | −71.34 | 71.77 | 37.87 | −181.63 |
| 1996–2000 | −379.77 | −415.37 | −439.38 | −348.36 | −134.75 | −309.36 | −150.87 | −98.15 | −114.25 | 68.31 | 14.81 | −209.74 |
| 2001–2005 | −380.50 | −400.88 | −407.52 | −342.45 | −140.67 | −307.51 | −169.25 | −89.77 | −97.88 | 59.73 | 12.71 | −205.82 |
| 2006–2010 | −362.04 | −363.39 | −387.71 | −310.16 | −154.29 | −271.85 | −190.95 | −71.29 | −83.56 | 51.25 | 6.21 | −194.34 |
| 2011–2015 | −409.87 | −313.24 | −373.77 | −326.61 | −150.85 | −299.95 | −172.54 | −77.90 | −86.50 | 57.16 | 10.67 | −194.85 |
| 2016–2020 | −427.90 | −393.05 | −373.43 | −353.45 | −154.65 | −305.98 | −200.17 | −89.80 | −98.73 | 53.02 | 11.74 | −212.03 |
| Average | −392.54 | −372.83 | −396.87 | −334.44 | −141.93 | −295.01 | −170.25 | −77.05 | −92.04 | 60.21 | 15.67 | −199.74 |
3.4. EPs and EWD of Vegetation at Each Growth Stage
The Qinghai–Tibet Plateau EPs and EWRs were calculated for different growth stages of natural vegetation in each subregion of the Qinghai–Tibet Plateau, and their multiyear mean values were counted (Table 6). The EWR of vegetation within each subregion was much higher in the mid-growth stage than in the remaining three growth stages, since the vegetation in the mid-growth stage had the highest cover and the largest growth coefficient, and that this stage lasted the longest throughout the growth cycle of the vegetation, resulting in the largest values of the total EWR. The order of EWR for each climate division from largest to smallest is HD2 (9.31 × 10¹⁰ m3) > HA1 (5.93 × 10¹⁰ m3) > HC2 (4.55 × 10¹⁰ m3) > HC3 (4.27 × 10¹⁰ m3) > HB1 (3.97 × 10¹⁰ m3) > HB2 (2.82 × 10¹⁰ m3) > HC1 (2.59 × 10¹⁰ m3) > H D1 (2.28 × 10¹⁰ m3) > HVVIV (1.31 × 10¹⁰ m3) > VA5 (0.88 × 10¹⁰ m3) > VA3 (0.40 × 10¹⁰ m3). In the other nine regions except HD1 and HD2, the water demand EWR of vegetation growth at each growth stage of natural vegetation can be satisfied by the total effective precipitation EPs, showing water surplus.
| Region | G1 (Apr) | G2 (May, Jun) | G3 (Jul, Aug, Sep) | G4 (Oct) | ||||
|---|---|---|---|---|---|---|---|---|
| EWR | EPs | EWR | EPs | EWR | EPs | EWR | EPs | |
| VA3 | 2.16 | 9.15 | 10.28 | 36.86 | 24.63 | 52.36 | 2.47 | 10.07 |
| VA5 | 4.11 | 17.68 | 21.32 | 52.61 | 55.91 | 109.05 | 6.97 | 17.45 |
| HVVIVIIA1 | 5.33 | 22.35 | 32.27 | 77.49 | 83.09 | 147.32 | 10.15 | 20.71 |
| HA1 | 30.62 | 115.81 | 133.99 | 440.82 | 388.77 | 787.97 | 40.08 | 127.46 |
| HB1 | 28.48 | 37.11 | 86.12 | 248.61 | 259.93 | 466.55 | 22.43 | 47.85 |
| HB2 | 15.37 | 46.05 | 61.19 | 216.49 | 187.43 | 402.66 | 18.53 | 56.9 |
| HC1 | 17.11 | 22.94 | 58.91 | 152.85 | 168.88 | 271.46 | 13.79 | 25.24 |
| HC2 | 29.17 | 33.39 | 87.49 | 145.67 | 308.74 | 423.79 | 29.5 | 42.8 |
| HC3 | 23.99 | 35.22 | 79.22 | 122.71 | 293.03 | 389.18 | 31.18 | 40.52 |
| HD1 | 20.27 | 2.55 | 57.49 | 37.57 | 138.7 | 60.01 | 12.26 | 2.25 |
| HD2 | 61.83 | 16.12 | 189.65 | 153.05 | 627.5 | 465.38 | 52.24 | 26.93 |
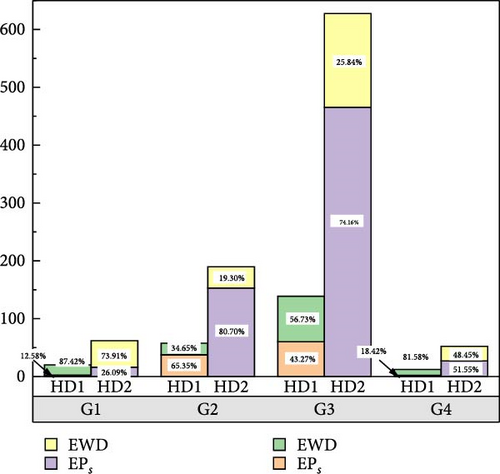
For HD1 and HD2 regions that show water deficit, the total effective precipitation EPs on HD1 is 44.76% of EWR in this region, and the total effective precipitation EPs on HD2 is 71.03% of EWR in this region. Four growth stages of natural vegetation in HD1 and HD2 regions were studied (Figure 7). The results showed that there was water deficit in all growth stages. The water deficit was the most serious in the early growth period, and the water deficit rate of HD1 and HD2 was 87.41% and 73.91%, respectively. Precipitation could only resolve 12.59% and 26.08% of EWR for HD1 and HD2, respectively. At the end of growth, the phenomenon of water deficit was also severe, and the water deficit rate of HD1 and HD2 reached 81.62% and 48.45%, respectively. This may be because the season corresponding to the initial stage of vegetation growth is early spring, in which natural vegetation just begins to grow and develop, and its total water demand increases. However, although the water demand of vegetation growth decreases compared with other stages at the end of growth, the precipitation of HD1 and HD2 is mainly concentrated in summer [69, 70]. Therefore, the water deficit rate in the early and late growth stages was significantly higher than that in other growth stages. The water deficit in the growth period (May and June) of the two regions is relatively optimistic, and the precipitation at this stage can resolve 65.35% EWR in HD1 region and 80.71% EWR in HD2 region, respectively. In the whole growth stage, precipitation can resolve 43.27% EWR in HD1 region and 74.16% EWR in HD2 region, respectively.
4. Discussion
In this article, we calculated the ETps, EPs, and EWp of seven vegetation types during the growing season (1991–2020) in the Qinghai–Tibet Plateau. Different vegetation types, different climate conditions, and different soil conditions make the ETps of the seven vegetation types different. Ma et al. [27] calculated the EWRs of the Heihe River basin on the eastern edge of the Qinghai–Tibet Plateau. The results showed that the actual evaporation (ETps) of forest land, shrub land, sparse woodland, other forest land, high cover grassland, medium cover grassland, and low cover grassland were 343.9, 332.2, 317.2, 214.2, 269.8, 220.2, and 213.1 mm, respectively. In this study, the average annual ETps of low-cover grassland was 120.36 mm, that of high cover grassland was 124.94 mm, and that of medium cover grassland was 88.27 mm. Due to the differences in climatic conditions, soil, and vegetation coverage in different regions, ETp of vegetation in different regions has certain differences. In particular, the average vegetation coverage and vegetation growth status in the Qinghai–Tibet Plateau are worse than those in the Heihe River Basin, so the ETps of different vegetation types are lower than those in the Heihe River Basin. Since the total ecological water demand of vegetation is affected by the total vegetation area, we only compared ETps in order to eliminate this interference in the comparative analysis of other research result, which has certain limitations in evaluating the calculation results of this study. Therefore, we will further consider adding other indicators to evaluate and compare the reliability of results in subsequent studies.
Zhou et al. [71] calculated that the high cover grassland area in southern Xinjiang is ~63.8 × 10⁸ m2, with a multiyear average vegetation water requirement of 27.32 × 10⁸ m3, resulting in a unit-area vegetation evapotranspiration of 428 mm. In this study, the high cover grassland area on the Qinghai–Tibet Plateau is ~2755.5 × 108 m2, with a multiyear average vegetation water requirement of 344 × 108 m3, with a multiyear average vegetation water requirement of 728 × 108 m3. Consequently, the unit-area vegetation evapotranspiration is 125 mm, respectively. High cover grassland is mainly distributed in the central and southern regions of the Qinghai–Tibet Plateau [72], where the average annual potential evapotranspiration is ~347 mm [73]. The average annual potential evapotranspiration in southern Xinjiang ranges from 1200 to 1500 mm [74]. The excessively high potential evapotranspiration in this region results in relatively higher EWR. Hu et al. [75] proposed a vegetation growth limitation coefficient for the growing season (April to October) and estimated the total EWR for various vegetation types in the Turpan–Hami region in 2020 to be 57.8 × 10⁸ m3, with an area of 39,000 km2, resulting in a unit-area vegetation evapotranspiration of 148 mm. The total EWR for various vegetation types on the Qinghai–Tibet Plateau in 2020 was 1872 × 108 m3, with a total vegetation area of ~1.54 million km2, leading to a unit-area vegetation evapotranspiration of about 125 mm. Li et al. [56] also established Kc and in conjunction with the area quota method, estimated the unit area vegetation evapotranspiration for various vegetation types in the middle and lower reaches of the Shule River from 1980 to 2018. The results were as follows: 190 mm for forest land, 170 mm for shrub land, and so on. The unit water demand for these vegetation types was generally higher than the results of this study (189.26 mm for forest land and 117.40 mm for shrub land). Since EWR are closely related to vegetation area, the unit area vegetation evapotranspiration of other studies was calculated to facilitate the comparison of relevant research findings. The comparison results indicate that in arid regions with intense solar radiation and higher potential evapotranspiration, the unit area water demand of the same vegetation type is also higher. However, when exploring the water demand characteristics across large-scale spatial ranges, directly comparing unit area water demand may obscure the heterogeneity of the underlying surface in different regions. For example, the water demand of high-coverage grassland in the Shule River Basin (160 mm) is 28.1% higher than that in this study (124.94 mm), which is related to differences in soil water retention capacity in local areas. Therefore, in this study, not only was the unit area water demand calculated for the overall spatial scope, but 11 climatic subregions were also delineated to investigate the spatial differentiation patterns of water demand within the plateau, revealing the spatial variation characteristic of water demand in the interior of the plateau.
According to the analysis of land use change in the Qinghai–Tibet Plateau from 1995 to 2020 (Table 7), the total area of forestland and shrubland increased, while the total area of grassland with each coverage decreased. In addition, in the increased area of forest land and shrub land, the coverage of grassland is 33.22% and 56.60%, respectively. This is related to grassland degradation [76] and scrub [77] in the Tibetan Plateau. In other words, the decline of ETps caused by grassland degradation reduces the total water requirement for grassland growth, while the overall change of precipitation is not significant, that is, the total water supply for vegetation growth is not significant. This situation will increase the total water surplus of grassland types with different coverage degrees, while shrub types will increase the water demand for growth, resulting in a decrease in water surplus.
| Types | Forest land | Shrub land | Sparse woodland | Other forest | High cover grassland | Medium cover grassland | Low cover grassland | Total |
|---|---|---|---|---|---|---|---|---|
| Forest land | 56,953.69 | 16,506.35 | 3409.59 | 176.83 | 16,026.61 | 16,109.49 | 6205.08 | 115,387.64 |
| Shrub land | 12,574.97 | 27,114.35 | 1753.98 | 218.58 | 16,894.73 | 23,148.71 | 14,286.32 | 95,991.63 |
| Sparse woodland | 10,972.58 | 5052.89 | 5136.46 | 35.16 | 8900.92 | 8087.55 | 6949.22 | 45,134.77 |
| Other forest | 1035.87 | 653.79 | 61.16 | 212.06 | 836.70 | 587.92 | 131.79 | 3519.30 |
| High cover grassland | 9861.99 | 11,518.15 | 1862.29 | 269.90 | 54,333.19 | 37,075.84 | 51,069.76 | 16,5991.11 |
| Medium cover grassland | 16,069.99 | 22,558.75 | 3708.66 | 324.96 | 44,931.60 | 142,730.61 | 151,915.20 | 382,239.76 |
| Low cover grassland | 6998.82 | 9546.27 | 1440.73 | 25.16 | 37,510.81 | 84,047.22 | 279,654.25 | 419,223.25 |
| Total | 114,467.89 | 92,950.55 | 17,372.85 | 1262.65 | 179,434.55 | 311,787.34 | 510,211.61 | 122,7487.45 |
At present, the Penman–Monteith method is often used to calculate the EWR of vegetation in studies [78, 79]. When the Penman–Monteith method is used to calculate the EWR of vegetation, soil limiting coefficient Ks should be considered to modify ET0. It is very difficult to obtain soil hydrological data, such as the actual water content of soil surface and the soil field water capacity data, especially large-scale spatial data, which must be obtained through large-scale field trials. Considering the spatial scale of the Tibetan Plateau in the research area of this study, the main vegetation types and their related soil hydrological data in the Tibetan Plateau in the study area were obtained from relevant existing studies and open data sets. In the existing studies on estimating the EWR of vegetation, this method of drawing up correlation coefficient or determining empirical coefficient by referring to the existing research results is widely used [80–83] although the results calculated in this way have certain deviations from the actual value. However, since the vegetation growth status affected by soil water stress can be reflected by Ks to a certain extent, the change trend of ET0 can be shown based on the calculation results of this study. Vegetation ecosystems are not only affected by soil water stress but also by vegetation itself. In order to further consider the differences in growth stages and seasons of different vegetation, the vegetation growth season (April–October) was preliminarily delineated in this study, and the growth coefficient Kc of different vegetation types (forest land, shrub land, sparse woodland, etc.) in each month was determined, EWR was calculated based on the difference of vegetation coefficient in different growth months, and EWD was obtained in combination with effective precipitation. Although this method can better clarify the change process of water requirement of vegetation growth at different growth stages, there are still differences between different planting covers of the same vegetation type, or the same species have different growth conditions in different regions. The above factors make the result of using Kc to calculate EWR relatively rough, and if more measured data can be supplemented for correction, it will be more scientific.
In this article, some work has been done to estimate the EWR and water deficit of vegetation in the Qinghai–Tibet Plateau from 1991 to 2020. However, due to the wide area and complex environment of the Qinghai–Tibet Plateau, there are few measured data and data required for field investigation, and many basic data are based on previous research results, which will inevitably lead to certain errors. Although 11 partitions have been made based on the climate difference, and other nonvegetation types such as bare land, water body, urban land, etc. have been removed by using land use classification data, the results of the EWR of vegetation in the Qinghai–Tibet Plateau region estimated in this paper are still rough. In particular, the estimation results of this paper are not detailed enough to guide the effective management of local water resources and the reasonable allocation of EWR of vegetation. In the process of calculating the EWR of vegetation, the error of the calculation result is mainly caused by the land use classification data. The classification accuracy of the land use data used in this paper is the 1000 m resolution remote sensing monitoring data of the national land use classification. Although the classification accuracy is not low, the classification category of the remote sensing monitoring data set is not precise enough due to the large area of the Qinghai–Tibet Plateau and the changeable terrain, such as the specific subdivision of forest land to which tree species and other factors. When estimating field water capacity based on soil texture, soil texture within a certain range is regarded as the same type due to the impact of data accuracy, but in fact, soil texture types are varied. Although the scope of human activities in the Qinghai–Tibet Plateau is smaller than that in other domestic regions, and the degree of environmental disturbance is less, human factors (such as the allocation and use of water resources by industry and agriculture) still cause water consumption, and vegetation itself has a certain capacity to store water and can produce storage volume. These factors will bring some uncertain errors to the estimation of vegetation EWR and water shortage but will not fundamentally affect the trend changes and characteristics changes on the large scale of time space. In the future, more accurate analysis of the water shortage of vegetation can be considered by obtaining more relevant data.
In this study, the vegetation EWR of the Tibetan Plateau for a total of 30 years from 1991 to 2020 is estimated. In fact, the data of previous years are established facts that are difficult to change, and the calculation of the vegetation EWR of past years is more of a reference value, compared with the prediction of the future vegetation EWR of the Tibetan Plateau is more in line with the requirements of relevant departments. Due to the complex ecological environment of The Qinghai–Tibet Plateau, which is located in the alpine zone, the necessary information on the spatial and temporal changes of vegetation growth and soil hydrological processes is relatively absent, so it is still very difficult to estimate the EWR and water shortage of vegetation in the Qinghai–Tibet Plateau more accurately. To solve this problem, it is urgent to strengthen the communication and cooperation between the local government and relevant scientific research institutions.
In general, the natural vegetation water deficit of HD1 in the northwest and HD2 in the southeast of the Qinghai–Tibet Plateau is very serious, which is mainly due to the cold and dry climate of the Qinghai–Tibet Plateau. HD1 region is in the northwest of the Qinghai–Tibet Plateau, and its altitude is higher than other regions. The climate is colder and less precipitation, and it is deep inland and far from the ocean, resulting in less precipitation. At the same time, the vegetation evapotranspiration rate caused by strong solar radiation is higher, which makes the utilization rate of limited precipitation in this region lower. The HD2 region is the Qaidam Basin, deep in the interior of the continent, and is weakly affected by the warm and humid monsoon climate, while the surrounding mountains block water vapor from the Indian Ocean, so that the region has little precipitation. Grassland with different coverage is the main vegetation type in Qaidam District and Northern Tibet. Since the EWD of vegetation in these two areas is mostly concentrated in the early growth stage, irrigation can be implemented in the early growth stage of vegetation to ensure the normal growth of grassland. In the other nine regions in the northeast, south and southeast of the Qinghai–Tibet Plateau, although the overall performance of water surplus is different, the amount of water surplus is different in different vegetation growth stages. Moreover, it is noted that the total area of grassland (high cover, medium cover, and low cover) and the ETps of grassland show a downward trend. The restoration and protection of grassland is very important. Although the precipitation can basically meet the normal growth of vegetation, rainwater can still be stored in the rainy season when the water surplus is sufficient, and irrigation can be carried out in the dry season in combination with other engineering methods such as water cellars and Wells. On the one hand, the precipitation lost due to the weak water retention of the soil on the Qinghai–Tibet Plateau can be reused. On the other hand, rainwater resources can be rationed and managed in different precipitation seasons. However, in HD1 and HD2 regions, irrigation measures should be implemented in the growth period of vegetation, especially in the early and late growth period, when the water deficit is the most severe, due to the water deficit in all stages of vegetation growth.
5. Conclusions
- 1.
The EWRs of forest land, shrub land, sparse woodland, other forest land, high-cover grassland, medium-cover grassland, and low-cover grassland in the Qinghai–Tibet Plateau are 2.31 × 10¹⁰, 1.17 × 10¹⁰, 0.64 × 10¹⁰, 0.04 × 10¹⁰, 3.44 × 10¹⁰ m³ and 4.31 × 10¹⁰, 7.28 × 10¹⁰ m³ respectively. On the Qinghai–Tibet Plateau, the EWp (ecological water productivity) of different vegetation types is negative, but the trends vary. The four forest land types show an upward trend, with the sparse woodland exhibiting a significant increase (p < 0.05), while the forest land, shrub land, and other forest land show an insignificant upward trend. The three grassland types with different coverage levels all show a downward trend, with medium cover grassland and low cover grassland demonstrating a significant decrease, while the high cover grassland shows no significant change.
- 2.
In the dry year (2014), normal water year (2016), and wet year (2012), the ETp on the Qinghai–Tibet Plateau was 115.28, 113.57, and 116.24 mm, respectively. Influenced by the vegetation water demand characteristics, the EWp was −114.21 mm in the dry year and −134.29 mm in the wet year. The wet year had a greater surplus of water for vegetation growth compared to the dry year.
- 3.
The Qinghai–Tibet Plateau was divided into 11 climate zones, namely HVVIV, VA5, VA3, HA1, HC1, HB2, HB1, HD1, HC3, HC2, and HD2. EWR and EWD of natural vegetation in each climate zone were significantly different. The maximum values of ETps and EPs appeared in HVVIV, which were 186.04 and 582.92 mm, respectively. Among the 11 climate zones, only the EWD of HD1 and HD2 is positive, indicating that the water requirement for vegetation growth cannot be met by effective precipitation, and the EWD of other climate zones is negative. EWp in the Tibetan Plateau showed a downward trend, and EWp in the HVVIV region showed an upward trend, while EWp in the other 10 climate regions showed a downward trend. For the climate zone of water surplus, the surplus water reserves increase. For the climate regions with water deficit, the phenomenon of water deficit has improved.
- 4.
The maximum EWR in the natural vegetation growing season was HD2 (9.31 × 10¹⁰ m³), and the minimum EWR was VA3 (0.40 × 10¹⁰ m³). In terms of water consumption per unit area, all vegetation types consumed the most water in the middle period of vegetation growth. In the four growth stages of the vegetation in this region, the water deficit of all vegetation types is the most severe in the early growth stage, followed by the end of the growth stage, and the water deficit is the lightest in the growth stage.
- 5.
From 1991 to 2020, the shrub area of the Qinghai–Tibet Plateau increased by 3041.08 km2, and the total area of grassland coverage decreased by 33,979.38 km2. For the ecological water demand for various vegetation types, the vegetation area is an important parameter that affects the EWR. The change in the vegetation area will directly affect the changes in the water requirement for the vegetation ecology. Affected by suburbanization and grassland degradation on the Qinghai–Tibet Plateau, the shrub forest EWR increased and reduced EWR in grasslands of all coverages.
Conflicts of Interest
The authors declare no conflicts of interest.
Funding
This work was supported by the National Natural Science Foundation of China (42171467) and the Natural Science Foundation of Qinghai Province (2022-ZJ-711).
Open Research
Data Availability Statement
The vector boundary data of the Tibetan Plateau used in this study are from the Global Change Scientific Research Data Publishing System (https://www.geodoi.ac.cn/WebCn/). The potential evapotranspiration data set of natural vegetation growth period and the monthly precipitation data set of China were obtained from the National Tibetan Plateau Scientific Data Center (https://data.tpdc.ac.cn/). Climate zone data were obtained from the Resources and Environment Science and Data Center (https://www.resdc.cn/). The data of land use type were derived from the 1:100,000 remote sensing monitoring data set of multi-period land use in China established by the Institute of Geographic Sciences and Natural Resources Research of the Chinese Academy of Sciences (CNLUCC, China land use-cover change, https://www.resdc.cn/). Soil texture data were obtained from the Harmonized World Soil Database (HWSD, https://www.fao.org/soils-portal/en/).


