Shift From Warming Slowdown to Rewarming of Winter Sea Surface Temperature in the South China Sea Before and After 2013
Abstract
The winter sea surface temperature (SST) in the South China Sea (SCS) before and after 2013 experienced a shift from warming slowdown to rewarming, and the interdecadal variability in the northern SCS was more pronounced than that in the southern SCS. The heat budget results indicate that the warming slowdown of SST in the northern SCS was primarily attributed to negative oceanic advection during 1997–2012. During 2013–2019, the reduction of evaporation played a dominant role in the rewarming of SST in the northern SCS, while the increase of short-wave radiation and positive oceanic advection played secondary roles. Further analysis suggests that the shift from warming slowdown to rewarming in the northern SCS may be related to the changes in the location and intensity of the North Pacific subtropical high. The southward shift of the eastern Pacific subtropical high (EPSH) during 1997–2012 resulted in anomalous easterly winds in the equatorial eastern Pacific Ocean and caused the weakening of Kuroshio intrusion into the SCS, which was the main mechanism leading to the warming slowdown of winter SST in the northern SCS. During 2013–2019, the enhancement of the western Pacific subtropical high (WPSH) caused the weakening of the East Asian winter monsoon (EAWM) and the reduction of cloud cover, resulting in the enhancement of the net surface heat flux into the ocean, which was the primary mechanism leading to the rewarming of winter SST in the northern SCS. Meanwhile, the northward shift of the EPSH led to the increase of Kuroshio intrusion into the SCS due to the anomalous westerly winds in the equatorial eastern Pacific Ocean, which also contributed to the rewarming of winter SST in the northern SCS.
1. Introduction
The South China Sea (SCS) is located between the tropical Indian Ocean and Pacific Ocean, which is the largest marginal sea in the northwestern Pacific Ocean. The climate system of the SCS varies complexly, which is jointly influenced by local air–sea interaction and large-scale remote forcing [1–5]. As one of the important indicator factors of the climate system, the sea surface temperature (SST) in the SCS is affected by the East Asian monsoon, El Niño–Southern Oscillation (ENSO), Pacific decadal oscillation (PDO), global warming, and other factors, showing significant seasonal, interannual, interdecadal, and longer timescale variations [6–11].
In the SCS, the southwesterly and northeasterly winds prevail in summer and winter, respectively [12, 13]. Under the influence of the northeasterly monsoon, there is a basin-scale cyclonic circulation in winter. Due to the reduction of latent heat flux and negative oceanic advection, a long and narrow cold-water zone from Hainan Island to the Malay Peninsula occurred at the western boundary of the SCS, known as the “cold tongue” [4, 14–16]. The winter “cold tongue” has large impact on the climate of the SCS and the surrounding lands. Previous studies have shown that there are significant interannual variations of winter SST in the SCS under the influence of ENSO [2, 4, 17–19]. In El Niño years, the winter northeasterly winds and cyclonic circulation in the SCS are weakened by positive SST anomalies in the eastern equatorial Pacific Ocean, and the cold tongue region warms [4, 19]. Following an El Niño event, the SCS SST anomalies show a significant bimodal structure, in which the anomalous warming in winter is mainly due to the anomalies of short-wave radiation and latent heat flux [18]. Seow, Morioka, and Tozuka [20] proposed that there are significant temporal and spatial asymmetries in the interannual variability of winter SST in the SCS, and the net surface heat flux and oceanic advection play different roles in the southern and northern SCS.
Interdecadal and longer timescale variations of the SCS winter SST are also investigated [7, 11, 21–25]. The SCS winter SST has a significant warming trend during 1900–2006 [7], in which the oceanic advection is promoted and the net surface heat flux is suppressed in the northern SCS, while the opposite is true in the southern part. The warming trend of SST in the central SCS was pronounced between 1950 and 2008, with the key influencing factors being the weakening of southward oceanic advection and the reduction of net surface heat flux [23]. However, Jiang et al. [25] found that the SCS winter SST showed an anomalous warming slowdown after 1999 following an accelerated warming during 1970–1998. Based on a regional high-resolution air–sea coupled climate model, Jiang et al. [25] suggested that the warming slowdown is mainly forced by the strengthening of the northeasterly monsoon associated with the negative SST anomalies in the equatorial eastern Pacific Ocean [26–28], and the changes in the SCS throughflow via the Luzon Strait [29] play secondary roles. Thompson,Tkalich, and Malanotte-Rizzoli [24] suggested that the PDO has a significant influence on the interdecadal variability of the SCS throughflow, and thus on the “warm–cold” regime shift of the SCS SST.
PDO dominants the interdecadal SST oscillation in the North Pacific Ocean [30, 31]. PDO has a crucial impact on the climate of neighboring lands through the circulation system, consisting of the Kuroshio, the Kuroshio Extension, the North Pacific Current, the California Current, and the North Equatorial Current [32]. When passing through Luzon Strait, a branch of the Kuroshio intrudes into the SCS [33, 34]. The variability of the Kuroshio intrusion are mainly affected by the wind in the Pacific Ocean, and local wind field variations play a minor role [35–38]. Qu et al. [39] assessed that local Ekman transport contributes to less than 10% of the Kuroshio intrusion flow in the SCS. Based on the numerical model, Yu et al. [40] analyzed that there is a significant interdecadal variability in the Luzon Strait transport (LST; 0–745 m), which is consistent with the anomalous wind stress at the Pacific Ocean. Wu [41] discussed the potential influence of PDO on the interannual variability of surface currents in the northwestern Pacific Ocean. Driven by the North Pacific Atmospheric Oscillation (NPO), the North Pacific Gyre Oscillation (NPGO) has a remarkable impact on climate in the North Pacific Ocean and adjacent seas [42, 43]. However, few studies have discussed the impact of NPGO on Kuroshio intrusion into the SCS on interdecadal time scales.
In summary, previous studies have shown that a warming slowdown of the SCS winter SST was observed at the beginning of the 21st century. In this study, we find that the warming slowdown lasted only until 2013, after which the warming trend resumed again. What caused this anomalous “warming slowdown to rewarming” shift of the SCS winter SST and how can it be affected by the variations in the North Pacific Ocean? To address the above scientific issues, the paper is structured as follows: Section 2 introduces the data and methods used in the study, and Section 3 presents the “warming slowdown to rewarming” shift in the SCS and the variations of thermodynamic processes before and after 2013. Section 4 investigates the potential influence of the meridional migration of the North Pacific subtropical high on the shift of the SCS winter SST and Section 5 gives a summary and discussion.
2. Data and Methods
2.1. Data
In order to investigate the interdecadal variation of the SCS winter SST during the period of 1979–2022, we employ a variety of monthly oceanic and atmospheric datasets. Three SST datasets were used in this study. The first dataset is the UK Meteorological Office Hadley Centre SST climatology (HadISST) data on a 1° × 1° grid from 1979 to 2022 [44], and the second dataset is the optimum interpolation SST (OISST) data on a 0.25° × 0.25° grid from 1981 to 2022 [45]. The monthly global 2° × 2° extended reconstructed SST (ERSST) from 1979 to 2022 is also used [46].
The monthly mean oceanic variables (zonal and meridional currents and ocean temperature) used in this study are Ocean Reanalysis System 5 (ORAS5) implemented by the European Centre for Medium-Range Weather Forecasts (ECMWFs), and the resolution is 0.05° × 0.05° [47]. Furthermore, the net surface heat flux (0.25° × 0.25° gridded), total cloud cover (0.25° × 0.25° gridded), SSH (1° × 1°), sea level pressure (SLP, 0.25° × 0.25° gridded), surface wind (0.25° × 0.25° gridded), and specific humidity(0.25° × 0.25° gridded) from 1979 to 2022 were obtained from ECMWF Reanalysis v5 (ERA5) to explore the mechanism of large-scale climate signals on the SCS winter SST [48].
The LST into the SCS was obtained by integrating the east-west velocity (u) in the 120° E section of the Luzon Strait from the sea surface to a depth of 5900 m [24]. The East Asian winter monsoon (EAWM) index is obtained by averaging the mean meridional wind speed on 1000 hPa over the region 115−130°E, 10−30°N [49, 50]. The PDO and NPGO index were obtained from the NOAA. PDO and NPGO index can be downloaded in https://psl.noaa.gov/gcos_wgsp/Timeseries/Data/pdo.long.data and http://www.oces.us/npgo/npgo.php, respectively.
2.2. Methods
In this study, a Lanczos filter [51] was used to filter SCS winter SST. Its truncation period is 7 years, with low frequency signals above 7 years and high frequency signals below 7 years. We estimate the SST trend based on a nonparametric statistical trend calculation method (Theil–Sen slope estimation algorithm) proposed by Yao et al. [52], where the maximum and minimum magnitude thresholds of the trend change above the 95% confidence level are selected as the SST folds. Unlike the traditional least-squares method of calculating linear trends, the Theil–Sen slope estimation algorithm does not need to make any assumptions and takes the median of the slopes calculated from all possible line segments of the original data as the final slope estimate. This can effectively reduces the influence of extremes, singular values, and noise and ensures that the results of the calculations are objective and robust. This method has been successfully adopted in global oceans and offshore China [52, 53].
3. Results
3.1. The Conspicuous “Warming Slowdown to Rewarming” Shift in the SCS
Based on three different global SST reanalysis datasets, Figure 1a shows that the winter SST in the SCS over the past 44 years exhibits significant interdecadal variability. After experiencing a significant warming trend from the late 1970s to the late 1990s, the warming trend of the winter SST in the SCS slowed down for about 17 years, and then a strong warming trend reappeared after the early 2010s. We employed the method proposed by Yao et al. [52] to find the turning point of the SST trend. Figures 1b,c show the SST trends during a given year to 2022, and it can be seen that 1997 and 2013 is the turning point of the period of “warming slowdown” and “rewarming,” respectively. Therefore, we select 1997–2012 as a warming slowdown period and 2013–2022 as a rewarming period to systematically investigate the characteristics of the interdecadal shift of winter SST in the SCS.

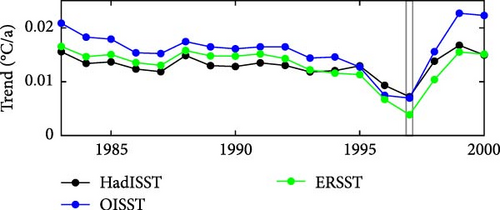
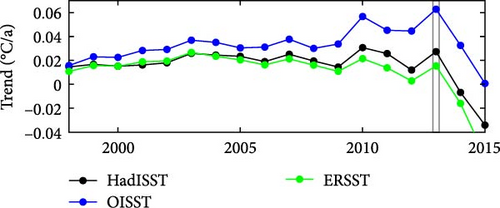
We show the trend distributions in the SCS using three different datasets (Supporting Information: Figure S1). In general, three types of data show similar results for the spatial pattern of SST trends except for the southeastern part of the SCS (107−120°E, 4−12°N). It can be seen that the regime shift of the winter SST in the SCS does exist based on three datasets. For example, based on HadISST, the winter SST warming rate in the SCS reached 0.0311°C/a during 1979–1997 (p = 0.1), and slowed down to −0.0162°C/a during 1997–2012 (p = 0.31), and then accelerated again during 2013–2019, reaching 0.0271°C/a (p = 0.46). Based on the same method, we calculated the warming rate of winter SST in the SCS for three periods using OISST and ERSST, and the results were generally consistent with HadISST (Table 1).
| Dataset | 1981–1997 | 1997–2012 | 2013–2019 |
|---|---|---|---|
| HadISST | 0.0311 (p = 0.1) | −0.0162 (p = 0.31) | 0.0271 (p = 0.46) |
| OISST | 0.0442 (p = 0.03) | −0.0301 (p = 0.14) | 0.0626 (p = 0.04) |
| ERSST | 0.0260 (p = 0.15) | −0.0204 (p = 0.21) | 0.0150 (p = 0.45) |
- Abbreviations: ERSST, extended reconstructed SST; HadISST, UK Meteorological Office Hadley Centre SST climatology; OISST, optimum interpolation SST; SCS, South China Sea; SST, sea surface temperature.
Figure 2 displays the spatial distribution of winter SST trends in the SCS during the warming slowdown (1997–2012) and rewarming period (2013–2019), respectively. In general, the SCS winter SST showed a weak cooling trend during 1997–2012 (Figure 2a). In the northern SCS (110°−120°E, 12°−24°N), the cooling trend was significant, especially in the northern continental shelf and slope and the western boundary current areas, where the minimum cooling rate reached up to −0.06°C/a. In the southern SCS (100°−120°E, 0°−12°N), especially on the Gulf of Thailand and off the northwestern Kalimantan Island, the SST slightly warmed.
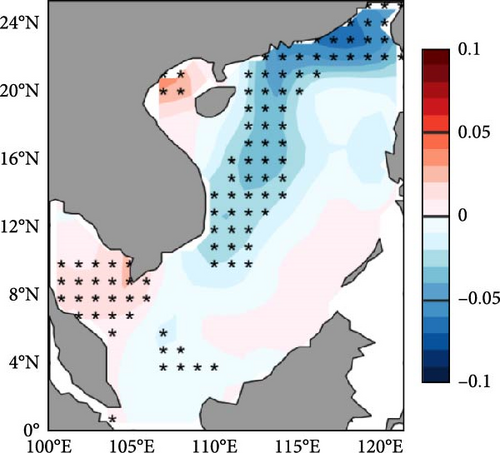
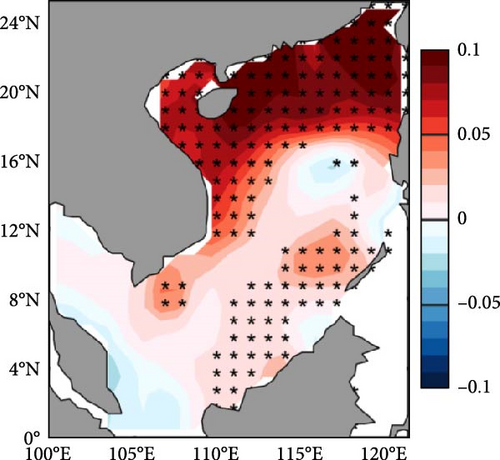
However, the SCS experienced a rapid warming during 2013–2019 (Figure 2b). The warming trend was particularly significant in the regions north of 16°N, with a maximum warming rate up to 0.1°C/a. A relatively weak warming trend was observed in the regions south of 16°N, mainly locating off the southeastern Vietnam and in the eastern boundary of the SCS. It is worth noting that the key areas of significant cooling or warming trend in both periods were in the northern SCS, but the size of them differed significantly. Specifically, the warming slowdown of SST during 1997–2012 was concentrated on the region north of 20°N in the SCS, while significant SST warming during 2013–2019 expanded to 16°N. The differences in the regions of significant SST changes between the two periods will be analyzed later based on the changes in the location and intensity of the subtropical high in the western North Pacific Ocean.
To further analyze the north–south discrepancy in the SST changes in the SCS, Figure 3 presents the time series of the overall, low-pass-filtered and high-pass-filtered SST in the northern and southern SCS, respectively. It can be seen from Figure 3a that the winter SST in the northern SCS experienced a significant “warming slowdown to rewarming” shift around 2013, while the interdecadal changes in the southern SCS were not significant. Based on the global reanalysis dataset HadISST, the changing rate of SST in the northern (southern) part of the SCS was −0.0356°C/a (−0.0133°C/a), p = 0.06 (p = 0.39) during 1997–2012, and 0.0915°C/a (0.0070°C/a), p = 0.04 (p = 0.08) during 2013–2022, respectively. Then the SSTs in the northern and southern SCS are low-pass and high-pass filtered for 7 years. It is found that the low-pass filtered SSTs in the northern SCS exhibited a more obvious “warming slowdown to rewarming” shift (NL, blue line in Figure 3b) before and after 2013, while were relatively smooth in the southern part (SL, blue line in Figure 3b). In addition, the interannual variation of SST in the southern SCS was significantly larger than that in the northern SCS. It may be related to the fact that the southern SCS is located in the tropics, which is more susceptible to the influence of the ENSO signal [3, 4, 18].
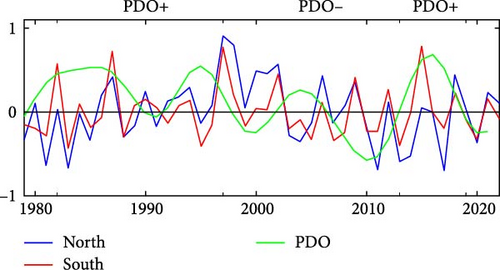

In summary, the winter SST in the SCS experienced a significant “warming slowdown to rewarming” shift before and after 2013, which was mainly contributed by the interdecadal variations over the region north of 20°N in the SCS. However, the interdecadal shift in the range of 16°N−20°N was relatively weak, and even no such interdecadal shift in the range of 12°N.
3.2. Thermodynamic Processes During the Periods of Warming Slowdown and Rewarming
In order to assess the roles of different thermodynamic processes in the winter SST “warming slowdown to rewarming” shift in the SCS, we analyzed various trends of different terms in the upper mixed layer heat budget equation (Equation (2)) over two periods. It can be seen that during the period of 1997–2012, within the key area north of 20°N where the warming rate was slowing down, the trend of the net surface heat flux was positive and not significant at 90% confidence level (Figure 4a), whereas the trend of the horizontal heat advection term showed a significant negative anomaly (Figure 4c). Therefore, the main process impacting on the slowdown of the SCS winter SST warming rate during 1997–2012 was oceanic advection, and the net surface heat flux played a negligible role. During the period of 2013–2019, the trend of the net surface heat flux exhibited a significant positive anomaly north of 16°N (Figure 4b), except near the main axis of the Kuroshio intrusion. Meanwhile, the trend of the horizontal heat advection term showed a weak positive anomaly (Figure 4d). Thus, the main process impacting on the SCS winter SST rewarming during the period of 2013–2019 was the net surface heat flux, and the secondary process was the oceanic advection.
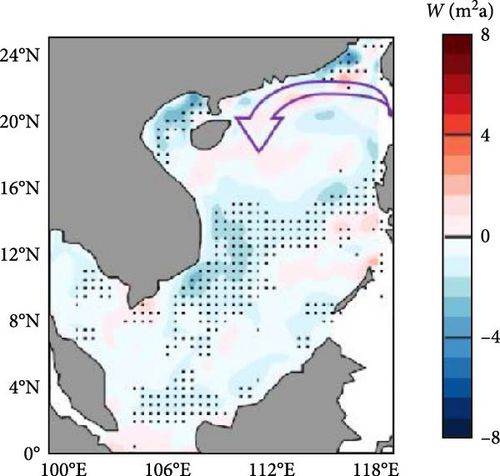
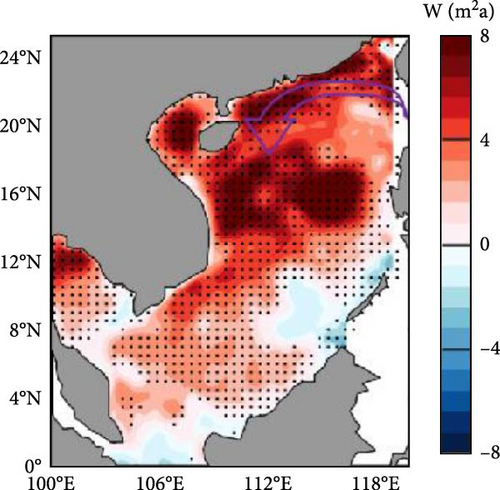
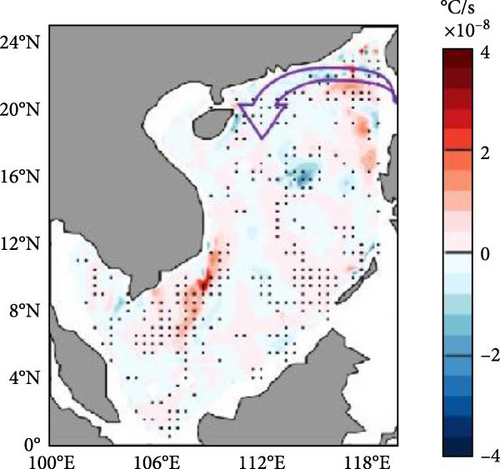
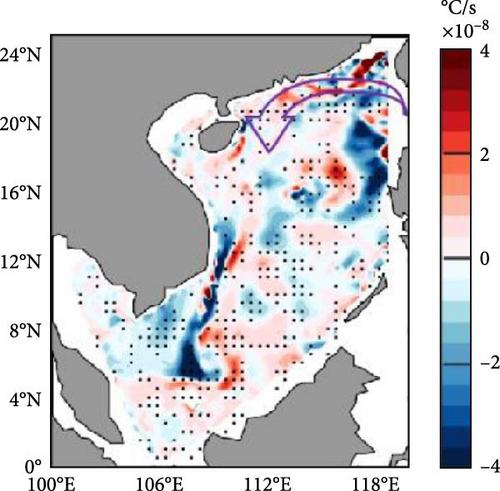
Figure 5 showed the spatial distribution of the trends of short-wave radiation, long-wave radiation, latent heat flux, and sensible heat flux in the SCS in winter during the warming slowdown (1997–2012) and rewarming (2013–2019) periods. Overall, the latent heat flux played a dominant role in the change of the net surface heat flux during the two periods, with short-wave radiation playing a secondary role, and long-wave radiation and sensible heat flux were negligible. As described in Section 2.2, the net surface heat flux and its four portions are positive downward, with positive values representing ocean heat uptake and negative values representing ocean heat loss.
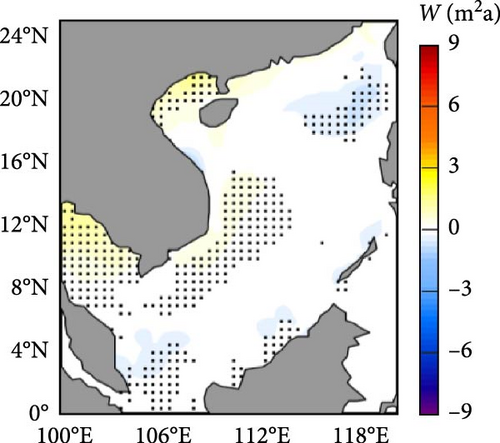
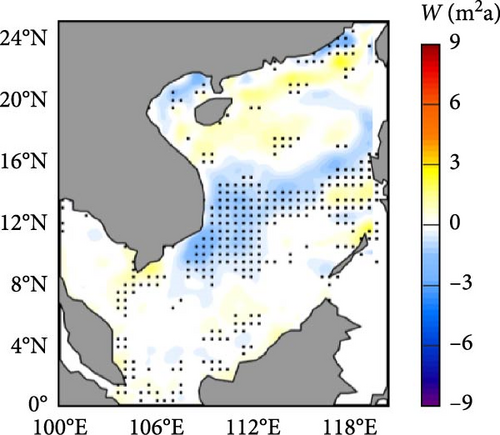
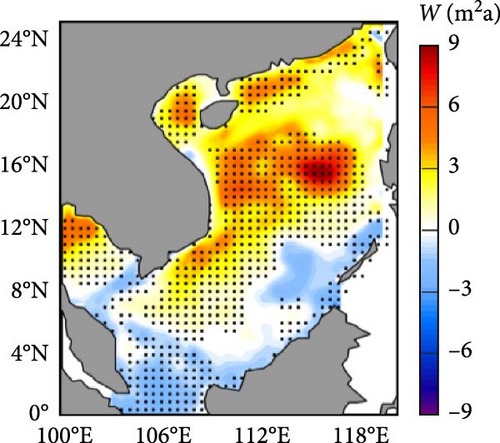
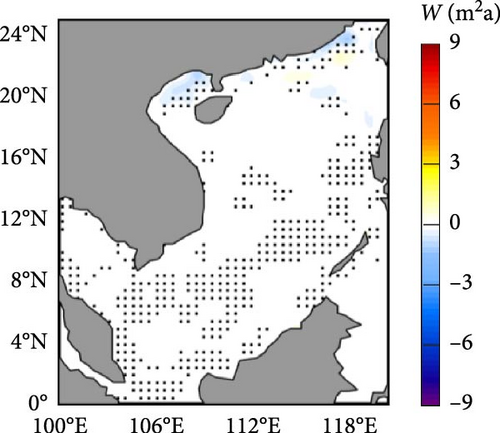
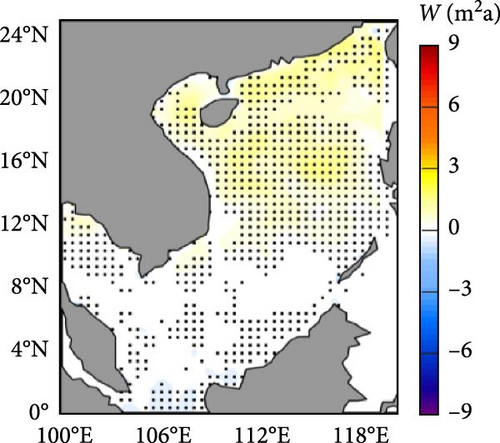
During 1997–2012, the SST presented a significant cooling trend in the northern and central parts of the western boundary of the SCS. Within the region off the eastern Vietnam (8°−15°N, 109°−112°E), short-wave radiation, long-wave radiation, and sensible heat flux changed weakly, and the enhanced evaporation caused a reduction of the net surface heat flux (Figure 5e). In the northern SCS continental shelf and slope areas (20°N−24°N), the trend of latent heat flux was not significant at 90% confidence level, and the changes of short-wave radiation, long-wave radiation, and sensible heat flux were weak. Thus, the net surface heat flux failed to cause a cooling trend of the SST there. This is consistent with the results from the previous section that the dominant process responsible for winter SST cooling in the region north of 20°N was the oceanic advection rather than the net surface heat flux (Figure 4).
During 2013–2019, the winter SST experienced an accelerated warming trend in the region north of 16°N in the SCS, which was mainly caused by the enhancement of the net surface heat flux. The evaporation was significantly weakened during this period (Figure 5f), while the short-wave radiation slightly enhanced and long-wave radiation and sensible heat flux changed at a low level. Therefore, the dominant influencing factor for the significant enhancement of the net surface heat flux in the region north of 16°N in the SCS was latent heat flux, and the secondary factor was short-wave radiation. In the region off the southeastern Vietnam (7°N−14°N), the SST was significantly warmed (Figure 2b). At the same time, the change of short-wave radiation was not significant at 90% confidence level, and the enhancement of the net surface heat flux was caused by the weakening of evaporation. In the southeastern SCS, the SST showed a warming trend, and the changes in the net surface heat flux played a key role, which was mainly caused by the increase of short-wave radiation.
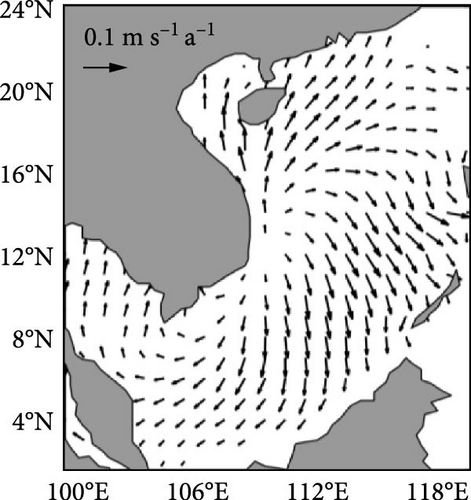
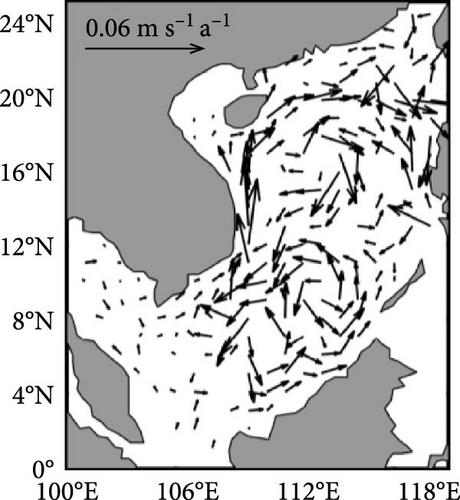
During 1997–2012, a cooling trend of the winter SST was observed along the western boundary of the SCS, especially in the northern continental shelf and slope areas (20°N−24°N), off the northeastern Vietnam (14°N−20°N), and off the eastern Vietnam (11°N−14°N; Figure 2a). The heat budget analysis showed that the modulation processes were different in the three regions. In the northern SCS continental shelf and slope area, the trend of the net surface heat flux was not significant (Figure 4a). The coastal flow of Zhejiang and Fujian was weakly enhanced (v′ < 0), resulting in negative oceanic advection (− < 0), which was the main modulation process for the cooling of SST there. Off the northeastern Vietnam, the trend of the net surface heat flux was not significant, and the western boundary current of the SCS was weakened (v′ > 0), and the anomalous oceanic advection term is positive (−). Both the net surface heat flux term and the anomalous horizontal heat advection term failed to result in the cooling. The climatological averaged western boundary current of the SCS is southward ( < 0) and (Figure 2a). Therefore, the mean circulation-induced negative horizontal heat advection (−) caused the cooling of SST off the northeastern Vietnam. Off the southeastern Vietnam, the western boundary current was weakened (v′ > 0), and the anomalous horizontal heat advection term could not cause SST cooling (−). Due to the small change in T’, the horizontal heat advection term due to the mean circulation played a minor role. Meanwhile, the evaporation was enhanced (Figure 5e)and the net surface heat flux was weakened, leading to significant cooling off the southeastern Vietnam.
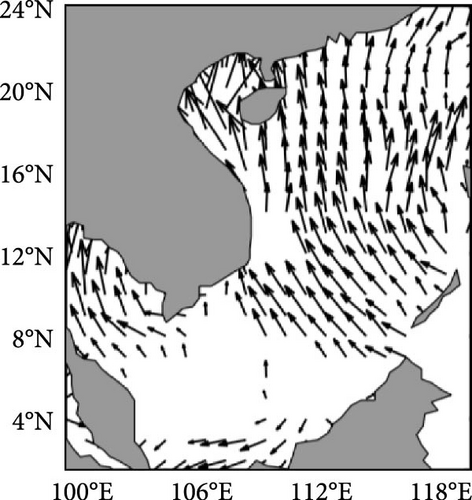
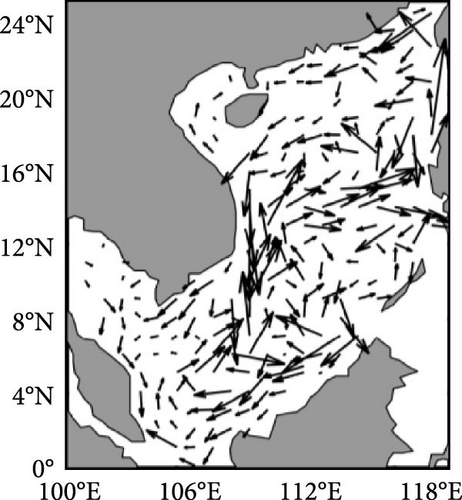
During 2013–2019, the SCS winter SST exhibited a significant warming trend as a whole (Figure 2b). In the northern SCS, the weakening evaporation (Figure 5f) and the enhancement of short-wave radiation (Figure 5b), causing the enhancement of the net surface heat flux (Figure 4b), led to a significant warming of the SST. It was worth noting that the trend of the net surface heat flux was not significant at 90% confidence level in the region near the main axis of the Kuroshio intrusion, when the Kuroshio intrusion was enhanced (u′ < 0; Figure 6d), and the horizontal heat advection caused by the anomalous circulation (−) resulted in the warming of the SST there.
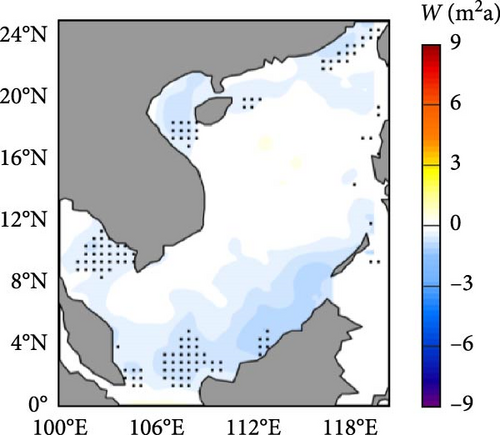
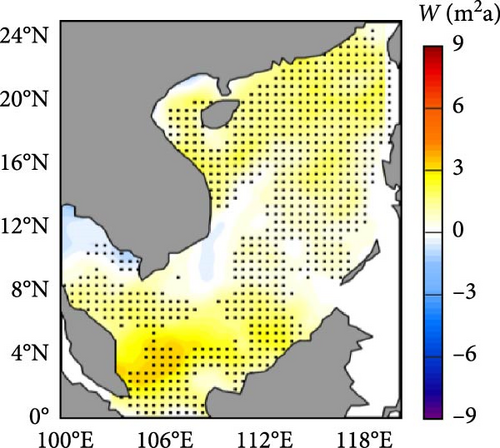
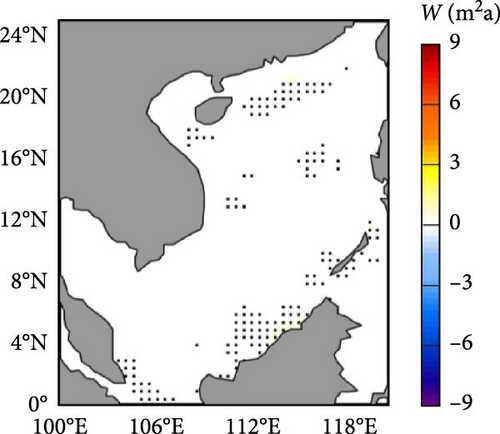
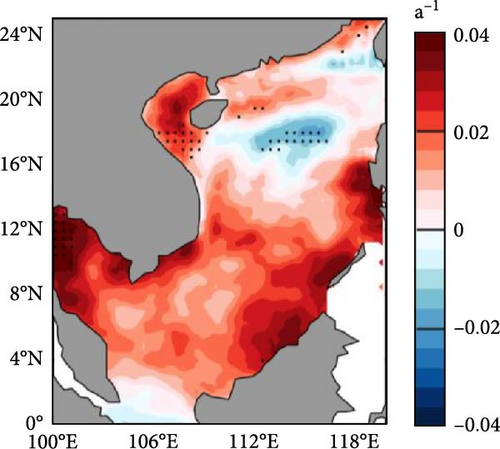
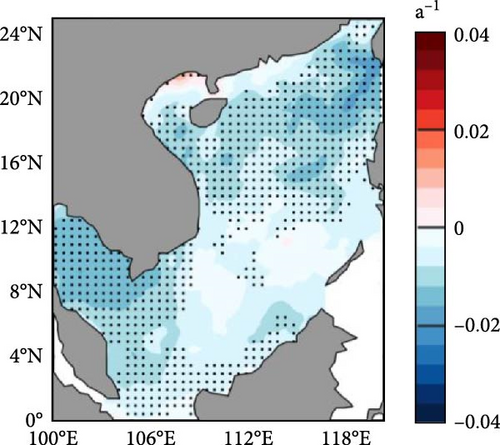
The influencing factors that cause changes in radiative and latent heat fluxes were further analyzed. As can be seen from Figure 7, the changes in short-wave and long-wave radiation were significantly affected by total cloud cover. On the whole, short-wave radiation decreased and long-wave radiation increased in the region with increasing cloudiness, and vice versa. For example, the cloud cover in the northern SCS changed from an increasing trend to a decreasing trend before and after 2013. At the same time, the short-wave radiation changed from a decreasing trend to an increasing trend, and the long-wave radiation changed from an increasing trend to a decreasing trend.
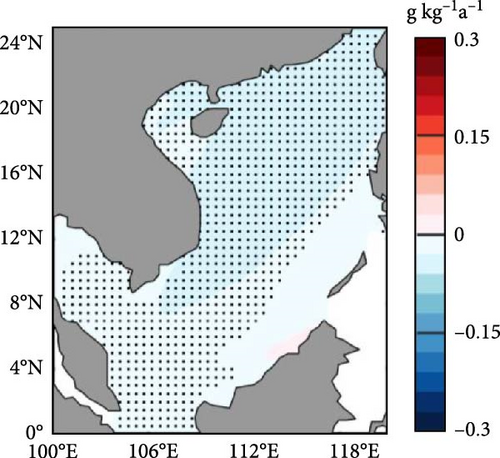
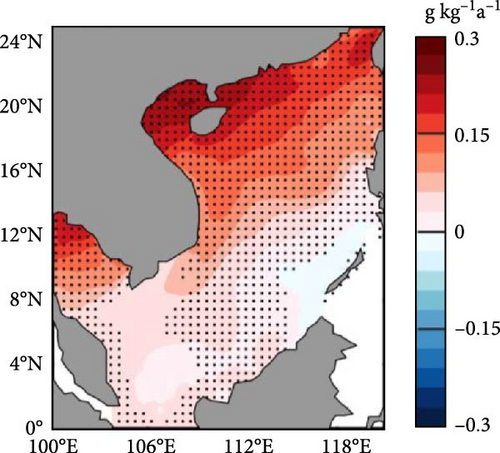
Overall, the change of latent heat flux was mainly affected by wind speed, and the change of specific humidity played a secondary role. For example, during 1997–2012, off the southeastern Vietnam, the cloudiness trend was not significant at 90% confidence level (Figure 7a) and the change of radiative fluxes were insignificant. However, both the wind speed (Figure 6a)and evaporation (Figure 5e) were enhanced, resulting in a weakening of the net surface heat flux. During 2013–2019, the weakening of evaporation was attributed to the decreasing wind speed (Figure 6b), while the specific humidity suppressed the change of evaporation in the northern SCS.
4. Driving Mechanism of the “Warming Slowdown to Rewarming” Shift
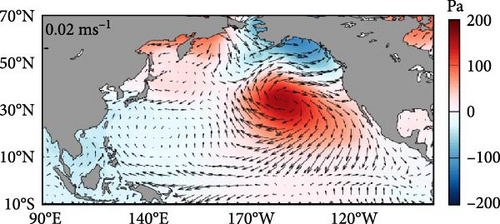
As discussed in Section 3.2, the local wind field and Kuroshio intrusion into the SCS had a significant impact on the interdecadal change of winter SST in the northern SCS. In order to further investigate the potential mechanisms that caused the shift from warming slowdown to rewarming in the northern SCS SST before and after 2013, we calculated the trends of LST and EAWM (Figure 8), and SLP and wind field anomalies in the North Pacific (Figure 9) during the two periods, respectively. Different from Figure 6 that explain the variability of localized advective heat transport and latent heat flux which can influence the variation of SCS SST, we plot Figure 9 to explain the interdecadal variability of the Kuroshio intrusion into the SCS in terms of remote teleconnection.
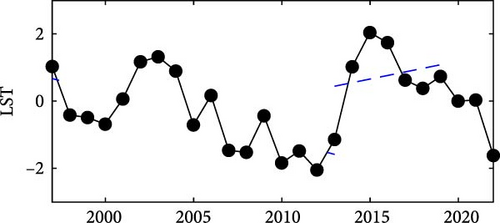

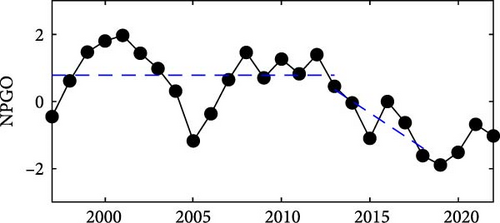
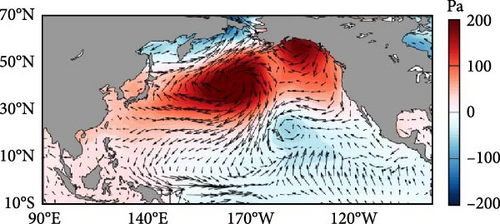
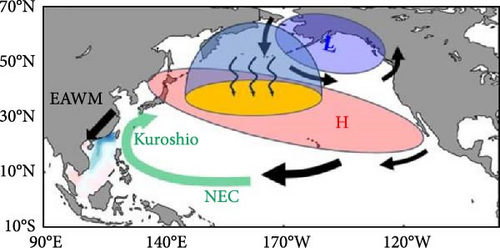
During 1997–2012, the eastern Pacific subtropical high (EPSH) and the associated negative wind stress curl moved southward, resulting in anomalous easterly winds in the tropical North Pacific Ocean. As a response, the North Equatorial Current bifurcation point shifted southward [40], and the strength of Kuroshio was enhanced on the east of the Luzon Strait. Then the Kuroshio intrusion into the SCS was weakened (Figure 8a), which caused the warming slowdown of winter SST in the northern SCS. At this time, the western Pacific subtropical high (WPSH) and the associated negative wind stress curl moved northward, which could not impact the tropical oceans. Thus the trend of the net surface heat flux in the northern SCS during 1997–2012 was not significant at 90% confidence level. We suggest that the southward shift of the EPSH leads to the abnormal easterly winds in the tropical North Pacific, resulting in the weakening of the Kuroshio intrusion into the SCS, which are the main mechanisms responsible for the warming slowdown of winter SST in the northern SCS during the period of 1997–2012.
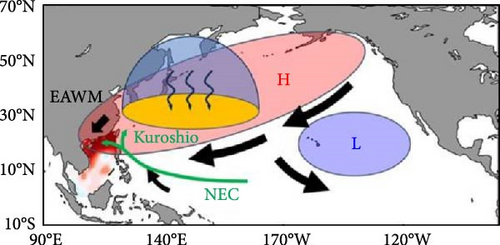
During 2013–2019, the WPSH and the associated negative wind stress curl shifted southward (Figures 9b and 10), resulting in anomalous easterly or southeasterly winds in the region from south of Japan to west of Taiwan Island. As a response, the EAWM significantly weakened (Figure 8b) which reduced the evaporation in the northern SCS. In addition, the enhancement of the WPSH caused a decrease in cloudiness in the northern SCS (Figure 7b), resulting in the enhancement of short-wave radiation (Figure 5b). This is consistent with the findings of Jiang et al. [25], where the winter SST in the SCS was positively correlated with the anticyclonic atmospheric circulation in the northwest Pacific Ocean.
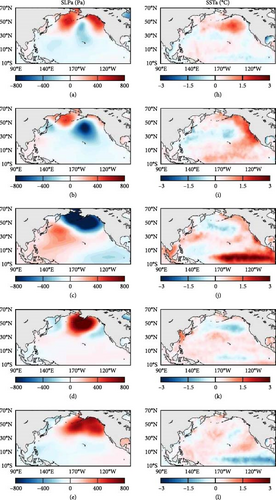
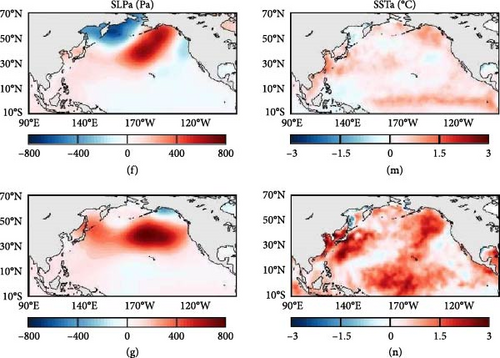
At this time, the EPSH and its associated negative wind stress curl moved northward, resulting in anomalous westerly winds in the tropical North Pacific Ocean. The North Equatorial Current bifurcation point moved northward, and the Kuroshio on the east of the Luzon Strait was weakened. Then the Kuroshio intrusion into the SCS was enhanced (Figure 8a), which also contributed to the warming trend of winter SST in the northern SCS. Therefore, the enhanced net surface heat flux in the northern SCS caused by the southward movement of the WPSH and the enhanced Kuroshio intrusion into the SCS caused by the northward movement of the EPSH are the main mechanisms leading to the rewarming of the northern SCS winter SST during the period of 2013–2019.
5. Discussion
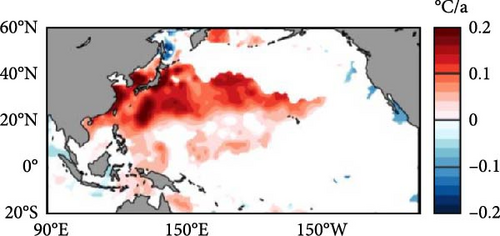
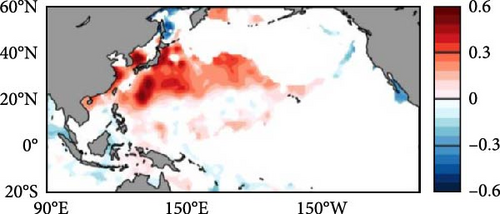
As can be seen from Figure 9, during the period of 1997–2012, the NPGO was in positive phase (Figure 11a). The northeastern Pacific Ocean was characterized by negative and positive SLP anomalies in the region north and south of 40°N, respectively. On the contrary, the NPGO was in negative phase during 2013–2019. During 1997–2012, the SSH in both north and south of 40°N in the northeastern Pacific Ocean showed positive trends and comparable magnitudes. The change of NPGO intensity was relatively mild (Figure 8c), when the Kuroshio intrusion into the SCS was weakened. Based on the regression of the 1997–2012 NPGO index on the SST in the tropical North Pacific, it is found that the tropical areas off the southeastern Philippines (130°−150°E, 0°−10°N) and the subtropical areas of the western Pacific Ocean (150°E−160°W, 25°−35°N) warmed, while was not significant at 90% confidence level in the northern SCS (Figure 12c). It seems that the NPGO can only affect the equatorial and subtropical areas in the western Pacific Ocean, but can not directly affect the Kuroshio intrusion into the SCS in the tropical areas. Based on the results of previous studies, this may be related to the fact that the PDO was in a negative phase during this period (Figure 3a), and the anomalous northeasterly wind disappeared in the subtropical North Pacific Ocean [56].
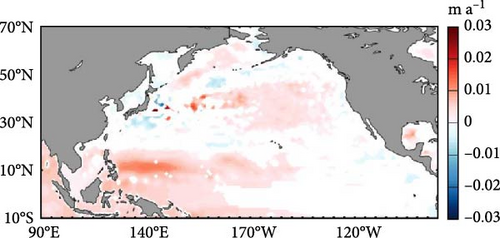
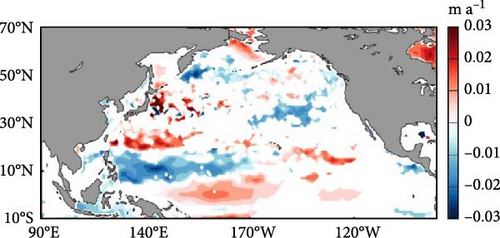
During the period of 1997–2012, an anticyclonic atmospheric circulation occurred in the tropical and subtropical regions of the Northeast Pacific (0°−40°N) and in the mid-latitude region of the Northwest Pacific (30°−60°N; Figure 9a). Anomalous easterly winds were prevalent to the west of the International Date Line near 30°N. The wind field in the subtropical northwestern Pacific was unusually weak during this period. At this time, the signal of NPGO in the eastern Pacific Ocean may be transmitted to the subtropical region (25°N−40°N) in the western Pacific Ocean through the anomalous easterly winds near 30°N. However, it had a weak impact on the tropical areas, including the northern SCS, and may affect the tropical oceans only through the variation of the North Equatorial Current.
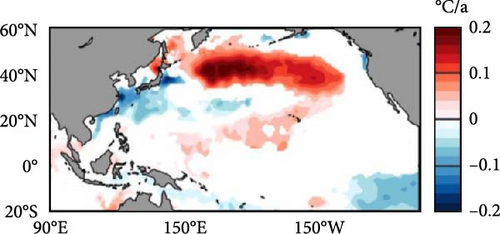
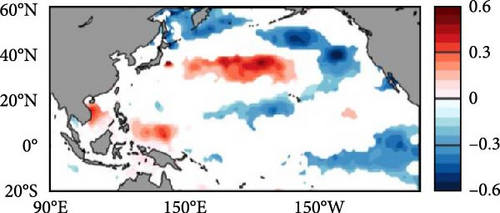
It can be seen from Figure 12a,b that the regime shift of winter SST around 2013 in the northern SCS is not an isolated phenomenon and closely related to the northwestern Pacific Ocean. The regression of the tropical North Pacific SST on the NPGO index multiplied by −1 during 2013–2019 (when the NPGO index showed a decreasing trend) reveals that the entire West Pacific tropical and subtropical sea area (120°E−150°W, 0°−40°N) warmed, including the northern SCS (Figure 12 d). It seems that the NPGO can directly influence the intensity of the Kuroshio intrusion into the SCS during 2013–2019. This may be related to the fact that the PDO is in positive phase during this period (Figure 3a), and anomalous northeasterly winds exists in the subtropical North Pacific Ocean. From Figure 9b, it can be seen that during 2013–2019, cyclonic atmospheric circulation exists in the tropical and subtropical Northeast Pacific (0°−30°N) and anticyclonic atmospheric circulation exists in the tropical and subtropical Northwest Pacific (10°−50°N), with anomalous easterly or northeasterly winds prevailing in the 10°N−30°N range west of 170°W. At this time, the variation of NPGO in the eastern Pacific Ocean may be transmitted to the whole western Pacific tropical and subtropical regions through the abovementioned anomalous easterly or northeasterly winds (Figure 11b).
In summary, along with the north–south migration of the subtropical high on the east and west sides of the North Pacific Ocean, the phase of NPGO changes from positive to negative, which is likely to induce the winter SST “warming slowdown to rewarming” shift in the northern SCS. It is worth noting that the influence of the shift of NPGO phase on the decadal shift of the winter SST in the northern SCS is limited to conjecture and is outside the scope of this article constrained by page limitations. Nevertheless, the potential influence may point out a possible way on dynamics of the decadal shift of the SCS SST with the both the west and east sides of the North Pacific Ocean. The physical processes and mechanisms will be explored in detail based on numerical simulations in the future. Finally, Figure 13 gives a schematic diagram of the shift of the northern SCS SST from warming slowdown to rewarming before and after 2013.
6. Summary
Based on multiple reanalysis datasets, this paper investigates the spatial and temporal characteristics of the shift from warming slowdown to rewarming of the SCS winter SST before and after 2013. Then we systematically explore the thermodynamic processes, influencing factors and potential mechanisms responsible for the shift. Compared with the southern SCS, the interdecadal variations of winter SST in the northern SCS were more significant. During 1997−2012, the slowdown of the winter SST warming rate in the northern SCS was mainly caused by negative oceanic advection, which was related to the enhancement of the coastal flow of Zhejiang and Fujian and the weakening of the Kuroshio intrusion. The EPSH shifted southward, leading to anomalous easterly winds occurring in the tropical North Pacific Ocean, and the Kuroshio intrusion into the SCS was weakened. During the period of 2013−2019, the rewarming of the winter SST in the northern SCS was mainly caused by the enhancement of the net surface heat flux, with oceanic advection playing a secondary role. The WPSH moved southward, which could weaken the EAWM and enhance the cloudiness, leading to the increase of the downward latent heat flux and the short-wave radiation. The EPSH moved northward, and anomalous westerly winds were observed in the tropical North Pacific Ocean, which enhanced the Kuroshio intrusion into the SCS.
Conflicts of Interest
The authors declare no conflicts of interest.
Funding
This article is supported by National Key Research and Development Program of China (Grant 2021YFF0704005), Hainan Provincial Natural Science Foundation (Grants 421QN265, 422QN327, 2021JJLH0022, and 422RC718), 2022 Major Science and Technology Programme Project of Yazhou Bay Innovation Institute, Hainan Tropical Ocean University (Grant 2022CXYZD003), and Hainan Tropical Oceanography University talent introduction research project (Grants RHDRC202120, RHDRC202322).
Acknowledgments
This article is supported by Hainan Provincial Natural Science Foundation (Grants 421QN265, 422QN327, 2021JJLH0022, and 422RC718), 2022 Major Science and Technology Programme Project of Yazhou Bay Innovation Research Institute, Hainan Tropical Ocean University (Grant 2022CXYZD003), and Hainan Tropical Oceanography University talent introduction research project (Grant RHDRC202120). The authors acknowledge the ECMWF and Asia–Pacific Data-Research Center (APDRC) for providing the reanalysis data.
Supporting Information
Additional supporting information can be found online in the Supporting Information section.
Open Research
Data Availability Statement
The data that support the findings of this study are available from the corresponding author upon reasonable request.


