Coulomb Effect in the Hybrid Double Quantum Dot–Metal Nanoparticle Systems
Abstract
The scattering rates under Coulomb interaction in the double quantum dot (DQD)–metal nanoparticle (MNP) structure, which were not specified earlier, are modeled. These rates are significant in knowing how the processes in such systems occur and which specific structure is adequate for the required application. The capture and relaxation rates are derived first, and the MNP potential is formulated for the first time. These rates are then introduced into the density matrix formalism of the system. One must refer to the reduced in-capture rates for electrons compared to holes. The relaxation rates are lower than the capture rates, indicating that the structure is not a loser. The DQD behavior is specified. The importance of the MNP potential in increasing the capture rates is detected. The scattering rates are reduced with increasing MNP radius. The electron capture times appear in a range of 10–30 ns, referring to more confinement of the carriers in the QDs under the MNP effect. The results are compared to those of the literature.
1. Introduction
Metal nanoparticles (MNPs) have long been studied, starting with the Faraday experiments done in 1857. The explanation of this effect returns to the theory of light scattering based on the classic electromagnetic field theory (Mie theory). Classical electrodynamics provides a basic understanding of the optics of metallic nanoparticles [1–3].
The carrier energy relaxation can occur in two scattering partners: carrie–phonon and carrier–carrier. As the quantum dots (QDs) have atomic-like energy states with mediated δ− function density of states, the carrier–phonon is limited by the matching between phono energy and QD states. Such a phenomenon is the phonon-bottleneck effect, which is shown experimentally to be reduced. Thus, the carrier–carrier interaction is dominant, especially when the carrier density is high [4].
It is shown that the QD-MNP hybrid system is coupled via Coulomb interaction, forming a hybrid exciton [5]. A dipole–dipole interaction exists because this long-range interaction couples them, causing excitation transfer. In the MNPs, the density of carriers is high, similar to its bulk case, and the plasmonic spectrum becomes broad when associated with discrete QD states, causing new exotic ones in the hybrid system and exhibiting their new optical properties [6]. The emission spectrum of QD is modified in the proximity of MNP due to the three physical factors: modifying QD density of states, absorption amplification in the presence of MNP plasmonic resonance, and the short exciton lifetime. The last factor occurs under radiation rate enhancement and energy transfer to MNP. While the dipole approximation is valid in the long-distance regime (weak coupling), it fails in the short-distance regime (strong coupling), and the exact treatment must consider Coulomb interaction [7].
The carriers in different bands (electrons and holes) have an interband attraction, and the Coulomb potential of such interaction is attractive. The Coulomb potential is repulsive for the intraband interaction where the carriers are in the same band. Ordinarily, Coulomb processes occur between two or more carriers, and then one deals with the many-body effects. Many-body techniques of quantum mechanics are required to manipulate such processes. The rapid equilibrium of carriers into the Fermi–Dirac distributions is an essential result of the Coulomb scattering. Under typical laser conditions, carrier–carrier scattering also contributes to optical dephasing. The plasma screening is another many-body effect: the carrier density-dependent reduction of the potential of the Coulomb process via the background charge carriers [8].
An essential carrier–carrier scattering mechanism is the Coulomb-type interactions between the charged particles. Since the total energy must be conserved in each scattering event, the scattering of one carrier to a lower state must be accompanied by the scattering partner to a higher energy with an equal energy difference. Also, a filling of vacant states that lie below the average energy of the electron gas is accompanied by a promotion of other electrons to higher states, such that the total energy is conserved. Such processes are known as Auger scattering. Since the total energy of the charged carriers is saved, Auger scattering will change the charge carrier temperature [4, 9].
Seeking for more merits introduces double QDs (DQDs). This develops QD characteristics through the manipulation flexibility of carriers between DQD states. Such structures are attained while developing growth technology, making attaching with MNPs possible. DQD-MNP is developed in its electronic and optical properties, such as high energy absorbed and ultrasensitive spectroscopic [10, 11].
The interaction of the different states is crucial for the carrier dynamics in QD devices. As the structure contains an MNP, the field must be dealt with quantum mechanically. Due to dense carriers in the MNP, two assumptions are required: First, it is adequate to consider a continuous state, and a classical consideration of the field is sufficient. Second, the Coulomb scattering processes between the MNP and the QD structure are taken. The second assumption varies the “effective” applied field on the QD structure. Most QD-MNP researchers take Coulomb scattering processes as an averaging process affecting QDs [7]. Such formulation, of course, does not solve the real problem. This work models Coulomb scattering processes in the hybrid DQD-MNP system. This work specifies two general charged carrier scattering processes to define the processes in the DQD system: capture of an electron from a QD state to a state into another QD and intradot electron relaxation in the same QD, both with their respective inverse processes.
This work simulates the Coulomb effect on the carrier scattering rates of the DQD-MNP systems, which has not been explored yet and is critical in specifying the exact parameters of such a system. Then, it is possible to use the model further in any application this system operates. For example, it can be used to study frequency locking in injected QD lasers [12], dynamics and chaos in QD lasers [13], small and large signal response, and four-wave in QD amplifiers [14–16].
A note must be added that this work differs from the work in Nasser and Al-Khursan [10]. In Nasser and Al-Khursan [10], the same authors discuss the Coulomb effect in the wetting layer (WL)-DQD-MNP structure. One must refer to the fact that works deal with QD-MNP in the literature and not consider the WL effect. The reason for such consideration returns to the type of application done. Ideally, the applied fields (pump, probe, incoherent field, or tunneling) are between QD states and the MNP but out of WL states. This is the reason for neglecting the WL effect. Here, the WL is not considered, as most works dealing with QD-MNP structure do not consider WL in their formulation [6, 7]. Then, formulation of the Coulomb effect in the QD-MNP is essential to such structures, which is done here. Thus, the work here does not consider the WL taken in Nasser and Al-Khursan [10]. This results in a formulation that is substantially different from that in Nasser and Al-Khursan [10]. Compared to the work dealing with WL-DQD-MNP [10], there is a difference between the results of DQD-MNP studied in this work and that of WL-DQD-MNP. This work identifies nine carrier processes in the DQD-MNP hybrid system. A reduction in the electron capture rates compared to holes, while the relaxation rates are lower than the capture rates, indicates that the structure is not a loser. The electron capture rates are increased, while the hole relaxation is reduced under the MNP potential.
2. DQD-MNP Structure Under Study
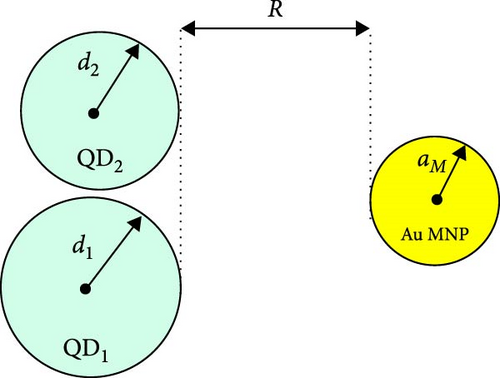
The hybrid system of DQD-MNP studied here comprises two InAs QDs. The shape of the QDs is a quantum disk. They have the radii d1 and d2 and heights hd1 and hd2, respectively. Their sizes are hd1 = 2nm and d1 = 13 nm for QD1 and hd2 = 3nm and d2 = 11nm for QD2. The DQD is adjacent to an Au spherical MNP with a radius aM, and the DQD-MNP separating distance is R (Figure 1). Unless stated otherwise, their values are aM = 8nm, R = 7nm. Since the work is at strong coupling, it must be R < aM < d1 and d2. Note that the dielectric constant εs is for the QD, while εM is for the MNP.
3. Theoretical Model
3.1. Wave Function
3.2. Coulomb Matrix Element of DQD-MNP System
3.3. The DQD-MNP Applied Fields
3.4. The DQD-MNP System Processes Considering the Coulomb Effect
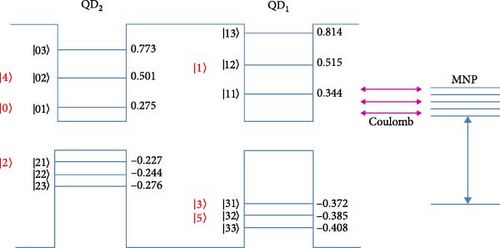
Nielsen et al. [21] list the rates that carriers scatter within the QD-WL system. The scattering rate for carriers in the DQD-MNP hybrid system (Figure 2) is written as follows:
Here, the carriers are scattered from v2 and v4 into QD states v1 and v3, respectively, taking the effect of the MNP via M, here. Related to their states vi, the Fermi carrier distribution functions are with b and b′ which refer to the carrier, either electron (e) or hole (h), while refers to the Pauli blocking (due to the carrier filling). Many possible scattering processes can occur in the DQD-MNP hybrid system under study. In the above relation, the scattering is determined by the direct and exchange partners of the screened Coulomb matrix elements. They are written in the square brackets in their first and second terms. The factor of 2 results from the spin appears in the direct process of the matrix, which is removed in the electron–hole contribution in the exchange process.
This relation is used to write down the scattering processes that can occur in the DQD-MNP system. The following scattering processes are written according to the QD population variation of the state v1 (which is either v1 = cij for the conduction band CB or v1 = vij for the valence band VB QD states, respectively). Both rates of capture and relaxation are modeled. As the system under study is a DQD-MNP, the following definitions are used: the capture rate is defined between the QD1 and QD2 states, while the relaxation is between the same QD states. The assisted processes are formulated directly from Equation (32), depending on the specified direct process. This results in nine combinations of such scattering processes as abstracted in Table 1 (Figure 3). The capture and relaxation scattering possesses are numbered depending on their introduction in Table 1. As an example, p1 defines the process no. 1 in Table 1.
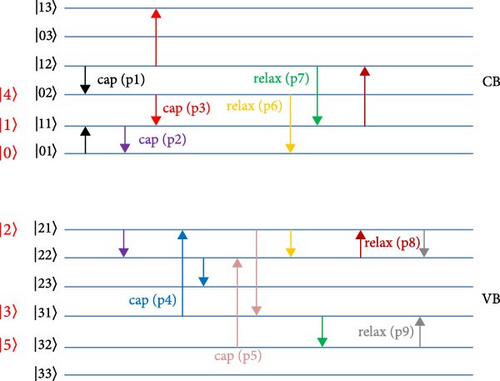
In numbering states in Figures 2 and 3, in Equations (33) and (42)–(49), and then in the density matrix system listed in the Appendices A and B, some considerations are used for clarity. The CB states of QD2 (QD1) are defined by |01〉, |02〉, |03〉 (|11〉, |12〉, |13〉) as in the third column in Table 1. One (or two) state(s) for each band is (are) considered in the density matrix, each with a different occupation. For QD1, only the occupation of the state |1〉(≡|11〉) is considered in the density matrix equations, and the occupation of the state |12〉 is regarded as the occupation of the state |1〉 (as appears in red in Figures 2 and 3). This is an acceptable assumption as the state |1〉 represents the DQD excited state, and its occupation is less than the ground DQD state (state |0〉). The occupation of the state |13〉 is neglected as this state is far from the ground and is emptied fast. Accordingly, the QD2 (QD1) states are renamed in the density matrix equations as |0〉, |4〉 (|1〉) and appear in red in Figures 2 and 3. Similar considerations are taken for the VB DQD states.
The numbering in the matrix element of Coulomb and other parameters in Equation (33) refers to the four-carrier interaction in the DQD and the MNP potential effect. Thus, the subscript M means the MNP contribution, c02 for the |02〉 QD2 electron state in the CB, and v31 refers to the |31〉 QD1 hole state in the VB, while and are the functions of the Fermi distribution of these states (|02〉 and |31〉).
3.5. The DQD-MNP System Scattering Rates Under the Coulomb Effect
4. Results and Discussion
Our laboratory MATLAB software, MAOUD-37, simulates this work. It is also used to study different optical properties of DQDs [19]. The QD and MNP sizes apply the strong coupling condition (Section 2). First, the energy states of the DQD are calculated (Figure 2). To simulate MNP-QD structures, other works take both QD states and momenta from experimental data for systems composed of different materials, which does not specify the structure parameters under study. Here, the energy states of the DQD and the momenta of transitions between DQD states are calculated. Thus, this work has material properties. It uses the material parameters (calculated energy states, transition momenta, and then Rabi frequencies), not approximated values for different materials as in the literature.
Using the model of quantum disk [17], the QD energy states are calculated. Such a model is compared with experiment [19]. The momenta are used to calculate the Rabi frequency resulting from DQD transitions. The Rabi frequency normalized, , is calculated from Equation (32). In the DQD system, all other possible transitions are either interband or intraband; their momenta are estimated to specify the values of βij which is used in the density matrix system (Appendix B).
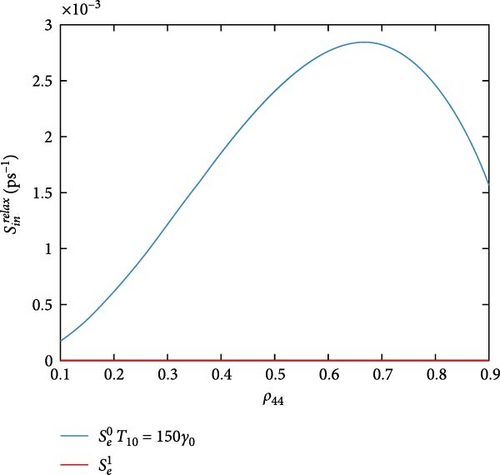
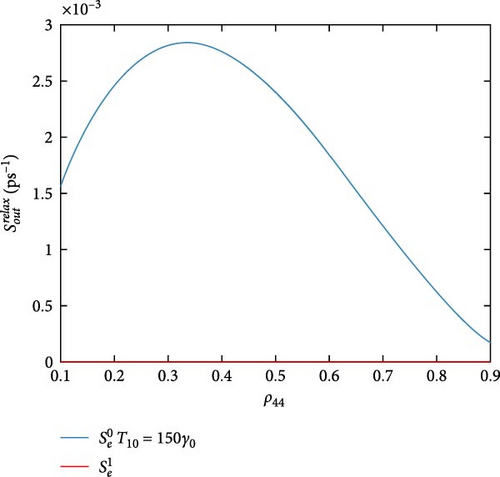
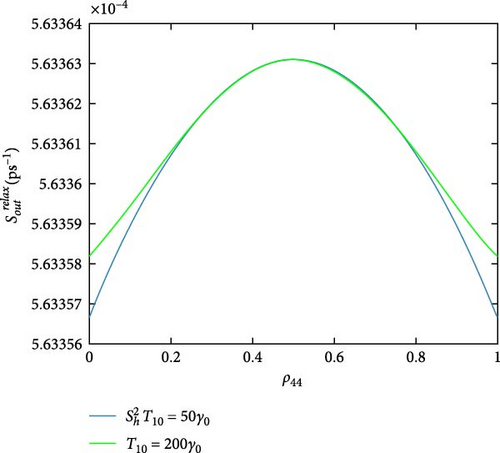
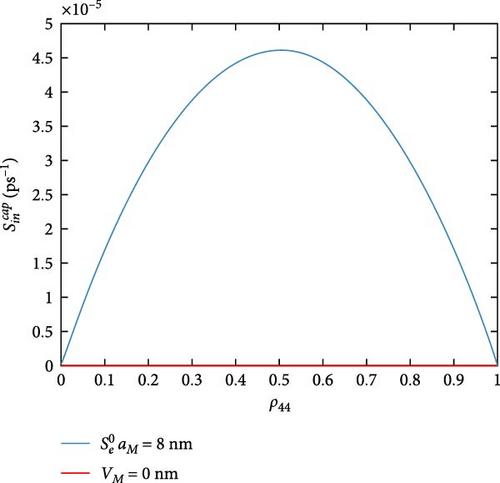
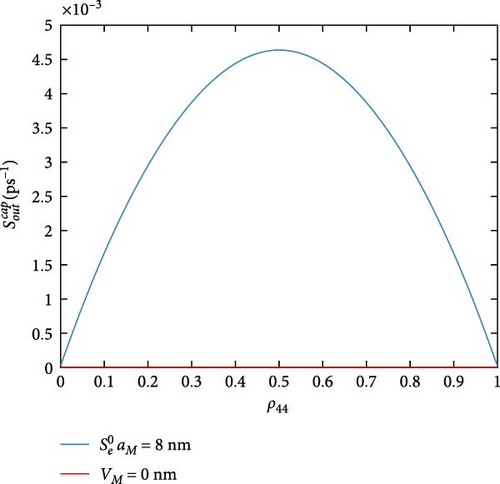
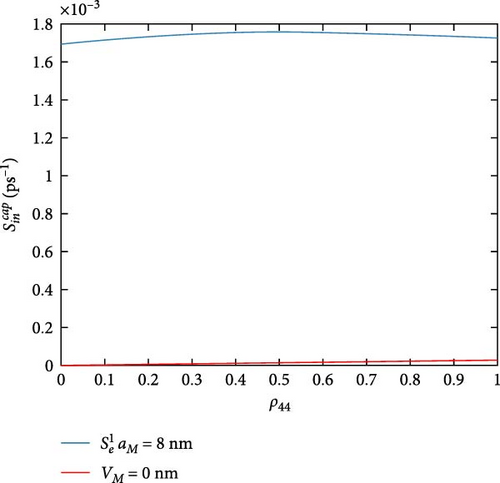
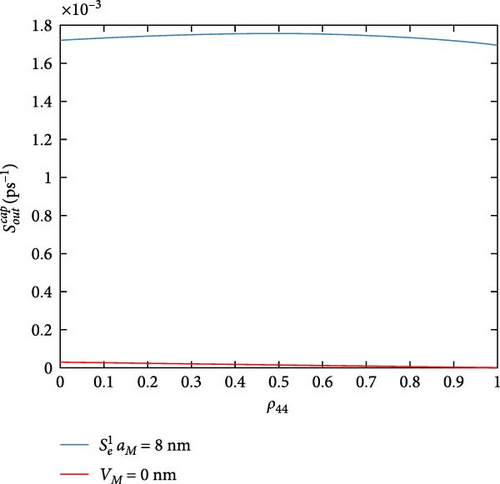
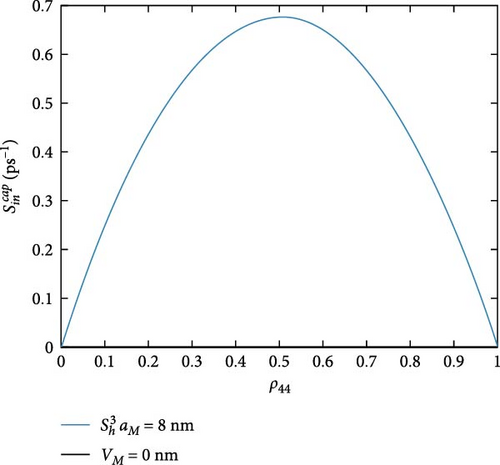
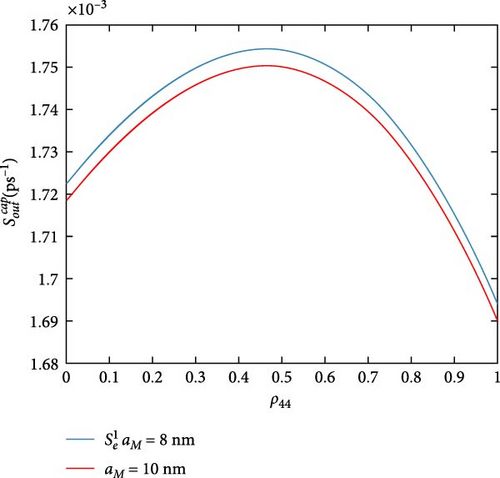
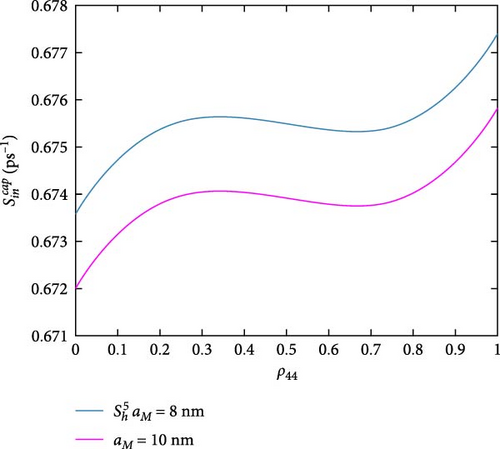
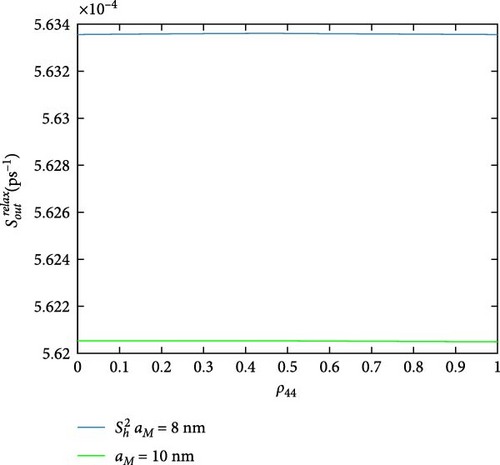
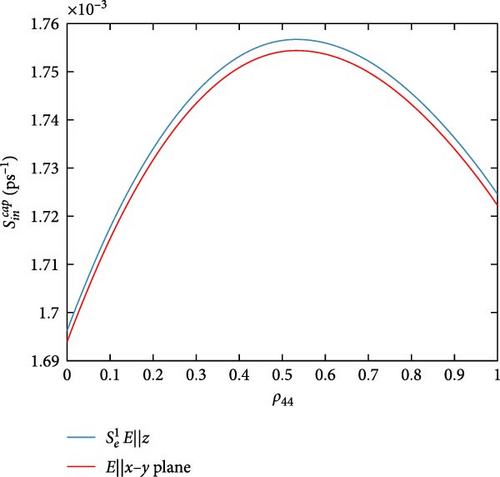
The scattering rates, calculated from Equations (33) and Equations (42)–(49), are then introduced in the density matrix system in Appendix B. It is solved by the Runge–Kutta method via MATLAB inside the MAOUD-37 software, where the carrier occupation probabilities ρii and their interaction probabilities ρij are then calculated. The used parameters are seen in Table 2. The calculated energy states of DQD and their momenta are in Table 2 to ease obtaining results. To define the pump and probe powers of the fields (where the results are obtained under them), the relation (in W/cm2) is used, with i = 0, 1 for probe and pump fields, respectively. Note that the figures (Figures 4–12) are plotted against carrier occupation probability ρ44 in the DQD excited state |4〉 (Figure 2).


| Parameter | Symbol | Value (unit) | Refs. |
|---|---|---|---|
| The Lorentzian line width | Γ( = γ0) | 1/(2.5ns) | [27, 28] |
| Dephasing time | τt | 500 ps | [29] |
| InAs QD dielectric constant | εs | 15.15 ε0 | [26] |
| The bulk metal damping constant | γbulk | 0.1 (eV) | [24] |
| Electron velocity at Fermi energy | vf | 1.4 × 10⁶ | [24] |
| Plasma frequency of the metal | wp | 2.5 (eV) | [24] |
| Calculated QD momenta | |||
| Momentum | Value (nm.e) | Momentum | Value (nm.e) |
| μ10 | 5.494 | μ25 | 0.0413 |
| μ20 | 0.0003 | μ35 | 0.0602 |
| μ30 | 0.0006 | μ14 | 0.1155 |
| μ32 | 12.015 | μ04 | 0.0841 |
| μ31 | 0.0007 | μ21 | 0.0003 |
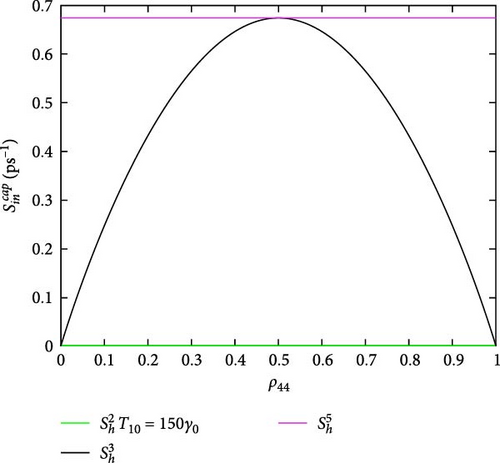
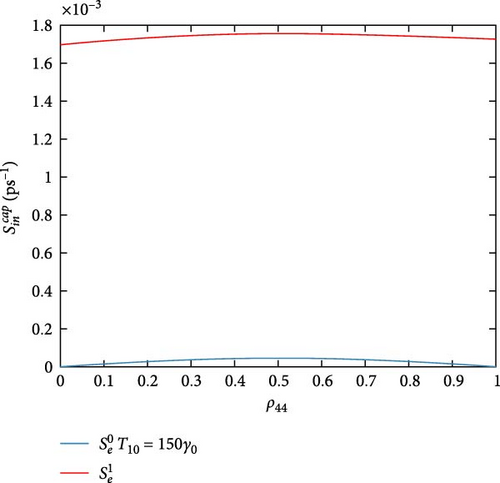
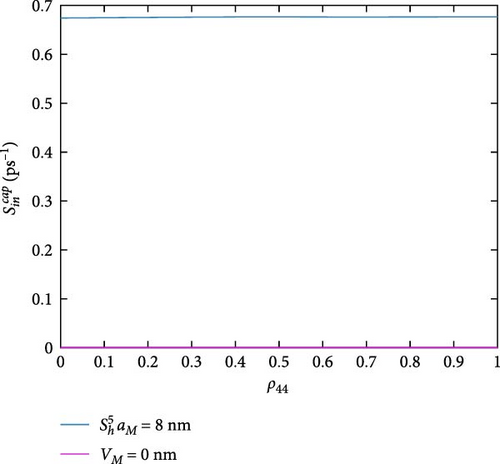
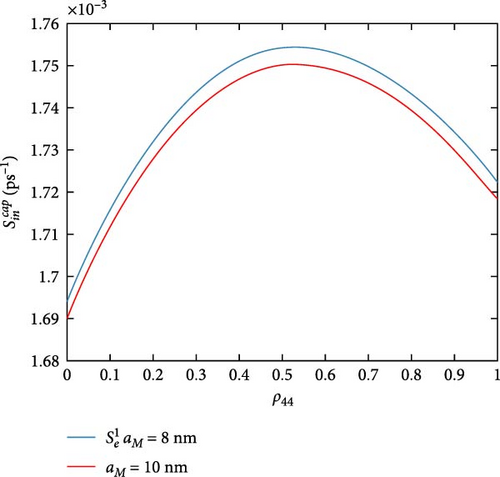
Figure 4 shows the DQD-MNP structure in-capture scattering rates. The highest capture rates are for which are the rates of the hole state. The rate is the higher one and is approximately constant with increasing the occupation of state |4〉. Compared to other DQD energy states (|0〉, |1〉, |2〉, and |3〉), the state with |5〉 is separated by a vast energy spacing from the band edge (Figure 2), and its occupation probability is low (a deep level). Due to this low occupation, the in-capture rate of state |5〉 is high even at the highest state |4〉 occupation probability (i.e., ρ44 = 1). For rate, it peaks at ρ44 = 0.5, higher ρ44 reduced this rate, and then it becomes zero at the highest occupation probability of ρ44 due to the Pauli blocking (1 − ρ44). Figure 4b evidenced that the rate is less than by two orders. Its shape is approximately similar to and is assigned to its lesser occupation as it represents the DQD excited state [27]. The shape of is similar to that of , but it is less than by three orders. A point that must referred to is the reduced in-capture rates for electrons compared to holes. Of course, this is via the heaviest holes compared to electrons, and the electrons have a faster capture time. The hole in-capture rate is neglected due to the Pauli blocking as it is near the band edge (it has a high occupation). Wegert et al. [30] found that the in-capture rate of the electron is lower than the hole rate, and Majer, Lüdge, and Schöll [31] show that in both holes and electrons, the in-capture rates of excited states are higher than that of their ground state, and a 1ps−1 for the hole in-capture rate in the excited state is obtained. These observations are with our results here. The results in [32] also match our findings here.
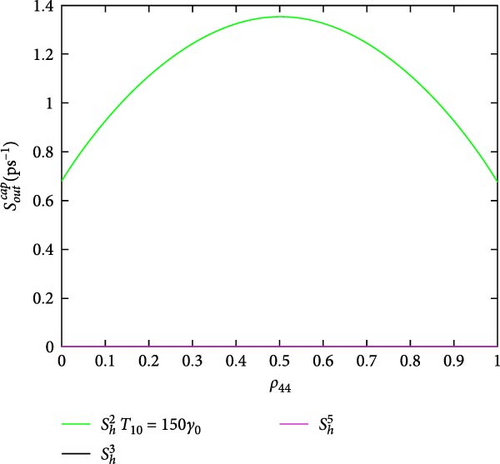
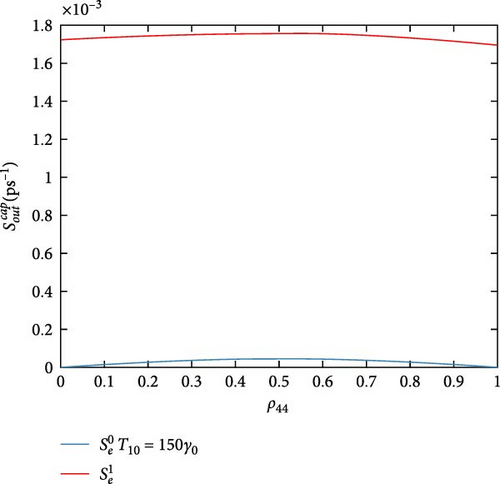
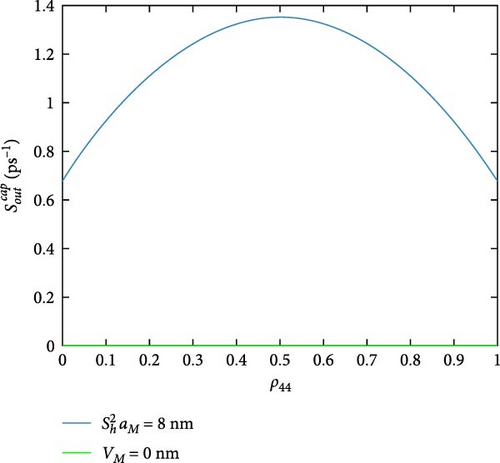
Figure 5 shows the DQD-MNP hybrid system out-capture scattering rates for holes (Figure 5a) and electrons (Figure 5b). Due to its high occupation, the highest out-capture rate is the (Figure 5a), which is a vice versa to its in-capture rate in Figure 4. It is reduced with higher ρ44, but at a complete occupation of ρ44, its rate is still high as long as it represents the hole ground state and has not been emptied. The out-capture rate (Figure 5b) has a similar shape as the in-capture rate in Figure 4. The out-capture rate here is reduced with increasing the occupation ρ44. As the out-capture goes to fill the DQD state |0〉 (process no. 2) (Table 1), when ρ44 occupation is increased, the occupation of the state |0〉 is increased dependently. This reduces the out-capture by the Pauli blocking. out-capture rate (Figure 5b) depicts its behavior in the in-capture rate. The peaked behavior of the in-and-out-capture rates in both Figures 4 and 5 confirms the DQD behavior of the two QDs, where the in-rate in one QD affects the out-rate in another. Such behavior does not support the isolated behavior of each QD. Such DQD behavior is also seen in Hadi and Al-Khursan [27]. The and out-capture rates are entirely different from the and in-capture rates. Due to their low occupation, as in Figure 4, their out rates are weak. The out-capture results in Majer et al. [31] support Figure 5 results.
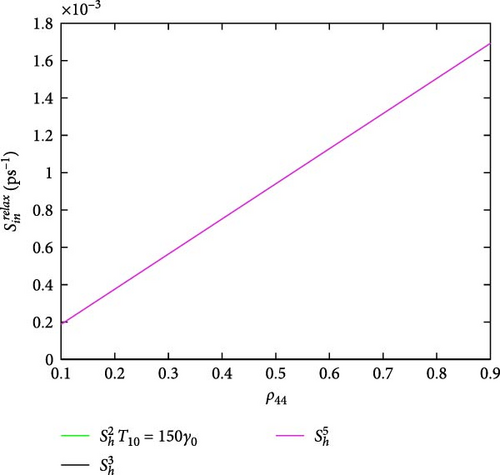
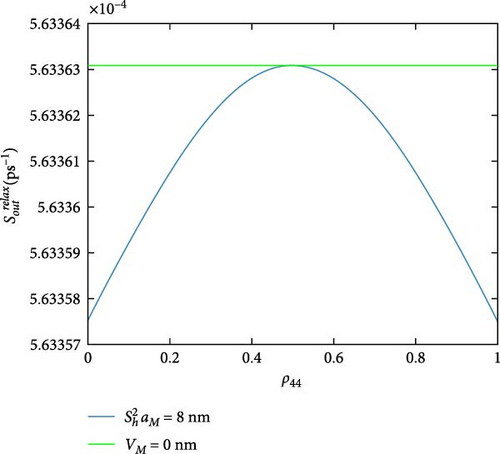
Figure 6 exhibits the hybrid DQD-MNP system in-relaxation rates. The relaxation rates are lower than the in-and-out-capture rates, indicating that the structure is not a loser system. The highest relaxation rates are shown for and then . The high value of in-relaxation rate (compared to other hole relaxations) is shown in Figure 6a, as it is a deep energy state in the VB. The curved behavior of the in-relaxation rate (Figure 6b), at its high value, is due to its nearest to the state |4〉. The in-relaxations have neglected rates.
Figure 7 shows the hybrid DQD-MNP system out-relaxation rates. The out-relaxation rate (Figure 7a) linearly increases with the ρ44 occupation. Increasing this rate is due to the low occupation of this state, which is higher than the state |5〉. The out-relaxation goes to state |5〉 and increase with the increase of ρ44 since the state |3〉 is not filled at a higher ρ44 occupation (the carriers are scattered between most DQD states). The out-relaxation rate (Figure 7a) is constant. The out-relaxation rate (Figure 7b) is the highest one, similar to the in-relaxation in Figure 6b, but the behavior of the out-relaxation is a left-handed mirror to the in-relaxation, which is reasoned to the Pauli blocking effect.
4.1. Effect of Tunneling
Figure 8 shows the variation of scattering rates under tunneling. Only the in-capture (Figure 8a) and the out-relaxation (Figure 8b) rates change under tunneling, while scattering rates that do not appear here are invariant. Their change occurs at low and high ρ44 occupation probability nor at moderate capture. The change in out-relaxation is not of significant value, but the change in in-capture is somewhat of considerable value. The in-capture rate change with tunneling is advised by its low occupation probability as it is a deep hole (excited state) level, and then with higher ρ44, it is reduced due to Pauli blocking. As the system is not a loser, the relaxations are small compared to capture rates (Figures 6 and 7). Then, of course, the changes in relaxation are also small.
4.2. MNP Parameters
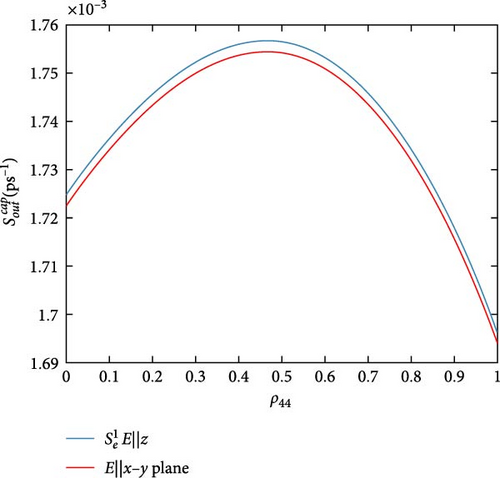
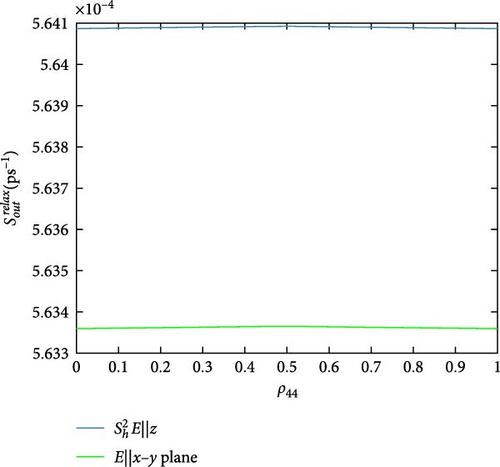
All previous MNP-QD models do not consider MNP potential as a direct effect; only its impact on polarization is implicitly taken. Figure 9 shows the influence of the MNP potential on the scattering rates, which compares our model with all other previous MNP-QD models. While it does not affect some rates, some marginally vary. in-and-out capture rates (Figure 9a,b) are reduced by neglecting MNP potential; this is also seen with in-and-out capture rates (Figure 9c,d). Three rates are more varied; they are in-capture rates and out-capture rate as in Figure 9e–g. Only the out-relaxation rate (Figure 9h) minimally increases at neglected MNP potential. Such behavior shows the MNP’s significant effect in increasing the capture rates, referring to more carrier confinement in the DQD under the MNP effect. Figure 10 exhibits the MNP radius effect on the scattering rates. The in-and-out-capture rates (Figure 10a,b), in-capture, and out-relaxation rates (Figure 10c,d) are reduced with increasing the MNP radius. Although there is no work on scattering rates in MNP-QD structures, one can deduce from the results in Yan et al. [33] that the system properties are developed at shorter distances at strong coupling. Figure 11 views the rates under the applied probe field at different polarizations. The in-and-out-capture rates (Figure 11a,b) and out-relaxation (Figure 11c) rates are reduced at plane-parallel applied field polarization. From Zhang et al. [34], one can also state the development of properties with the z-polarized field. In the DQD structure alone [20], electron and hole rates are less than DQD-MNP’s, coinciding with the results here.
4.3. Scattering Times
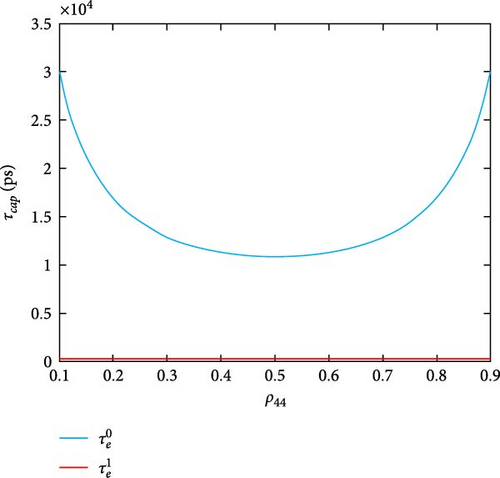
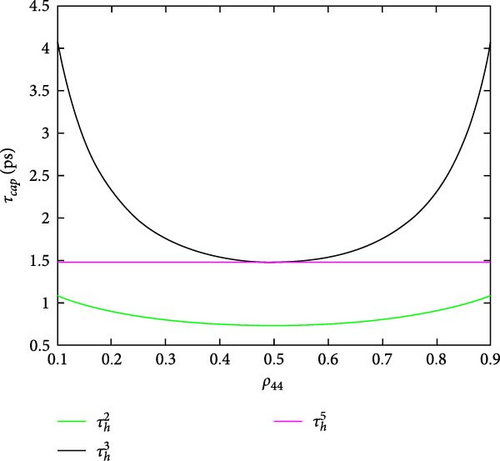
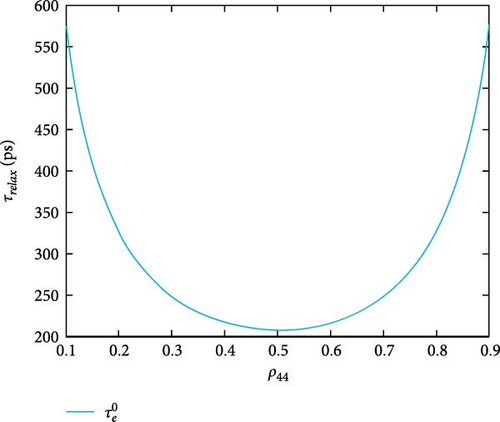
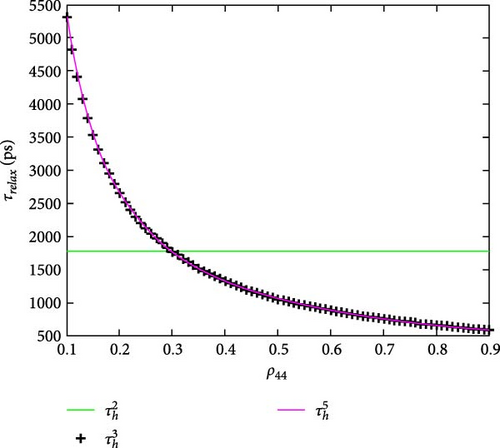
The carrier relaxation and capture (scattering) times (τb) are calculated from the scattering rates, where with b ≡ e, h for electrons and holes to extract the speed of the processes and appear in Figure 12. Figure 12a shows electron capture times, which appear in a range of 10 − 30ns for the DQD ground state while it is longer for their excited states. For the QD-WL system in Nielsen et al. [21], the capture times of electrons are not much than 1 ns; that is, the electron capture times of the hybrid MNP-DQD are longer than the QD-WL system. The longer capture rates here are compared to a broader barrier-width QD-WL system [35]. This result means the MNP-DQD system has a strong screening effect equivalent to a strong wave function confinement in the wide barrier QD-WL structure. Figure 12b shows the capture times of holes in the range of 0.7–4 ps with hole-excited states longer than their ground. The hole capture here is shorter than that in Nielsen et al. [21]. Figure 12c shows the electron relaxation time does not increase more than 0.5 ns, while the is too long as the system is not a loser. Figure 12d shows the hole relaxations are in the range 0.5–4.5 ns, which are longer than in Nielsen et al. [21].
5. Synthesis of the Hybrid DQD-MNP System
Tarasov et al. [36] experimentally evidenced the InAs/GaAs DQD system, invoking that they grow artificial molecules on a thick GaAs substrate, each compromising two QDs of different sizes. An AlGaAs barrier is introduced for more charge confinement to keep carriers in the QD region from diffusing into the GaAs spacer [36]. Attaching QDs to MNP via the bimolecular centers is provided by Richardson et al. [37]. Using molecular beam epitaxy, the MNP alignment to QDs is driven by Zhang et al. [38] through strain-driven nucleation. They grow InAs QD in a GaAs spacer. Then, they vertically align ErAs MNPs with these QDs. The structure is annealed at a high temperature to evaporate the indium from the uncapped QD layer under the overpressure of arsenide. This process nucleates ErAs, vertically aligned with the QDs, by precipitation of Er atoms. Thus, the possibility of producing the hybrid DQD-MNP structure studied in this work is provided.
6. Conclusions
The scattering rates in the hybrid system of DQD-MNP under the Coulomb effect are studied where the MNP potential is undertaken. Nine scattering partners are specified. The density matrix equations of the system are introduced depending on these rates. The hole capture rates are higher than those of electrons. The vast energy spacing from the band edge with low carrier occupation probability has a high in-capture rate. At the occupation ρ44 = 0.5, there is the highest out-capture rate, . The DQD behavior of the two QDs supports the peaked behavior of the capture rates. The rates of relaxations are lower than the capture rates, indicating that the structure is not a loser system. The results show the importance of the MNP in increasing the capture rates, referring to more carrier confinement in the QDs using the MNP structure. The longer capture rates here are comparable to a broader barrier-width QD-WL system. This result includes that the MNP-DQD system has a strong screening effect equivalent to a strong wave function confinement in the wide barrier QD-WL structure.
Consent
All the authors consent to participate. All the authors consent to publication.
Disclosure
The work has not been sent to any other site.
Conflicts of Interest
The authors declare no conflicts of interest.
Author Contributions
The authors contributed equally.
Funding
No funding was received for this manuscript.
Appendix A: The Rates of Capture and Relaxation
These rates are used to define the carrier occupation probabilities ρ11 and ρ44 in the density matrix relations in Appendix B.
They are used to define the carrier occupation probabilities ρ00 and ρ11 in the density matrix equations defined in Appendix B.
These rates are used to define the electron occupation probability ρ11 in the density matrix equations defined in Appendix B.
These rates are used to define the carrier occupation probabilities ρ22 and ρ33 in the density matrix equations defined in Appendix B.
These rates are used to define the hole occupation probability ρ55 in the density matrix equations in Appendix B.
These rates are used to define the carrier occupation probabilities ρ00 and ρ44 in the density matrix relations in Appendix B.
These rates are used to define the QD electron occupation probability ρ11 in the density matrix relations in Appendix B.
These rates are used to define the QD hole occupation probability ρ22 in the density matrix relations in Appendix B.
These rates are used to define the carrier occupation probabilities ρ33 and ρ55 in the density matrix relations in Appendix B.
Appendix B: The Density Matrix of DQD-MNP Hybrid System Under Coulomb Scattering
Note that ρii is the occupation probability of carriers of the DQD state |i〉 and ρij is the interaction density operator between states |i〉 and |j〉 of the DQD, , with is the Einstein coefficient, τt is the dephasing time of the dipole, ωij is the frequency of transition between QD |i〉 and |j〉 states, and μij is the transition momentum between |i〉 and |j〉 QD states. An explanation of the momentum calculations can be found in Al-Toki et al. [19].
Open Research
Data Availability Statement
Data sharing is not applicable to this article as no new data were created or analyzed in this study.


