Modeling, Analyzing, and Simulating the Dynamics of Racism Using a Stochastic Dynamical System
Abstract
Racism is a complex issue rooted in the historical Atlantic slave trade, which has led to inequalities and social instability. This study developed a stochastic mathematical model to analyze the dynamics, prevention, and control of racism. The entire population was categorized into susceptible, protected (those who deny racism), racist (those who propagate racism), jailed, and removal groups. The average number of racists caused by a single racist person was computed using stochastic perturbation and Ito’s principle, yielding a numerical value of . This suggests that the endemic equilibrium point of the model is globally stable and provides insights for minimizing the propagation of racism. The study presented numerical simulations graphically using MATLAB software to examine the influence of key parameters. It was suggested that increasing the rate of being caught and imprisoned due to racism (δ), the protected rate (θ), and the removal rate (γ), as well as reducing the racist contact rate (α), can help minimize the basic reproductive number, leading to reduced propagation of racism. The importance of addressing influencing factors and taking appropriate measures to control racism effectively was emphasized, highlighting the role of denying racism in reducing its spread and promoting social equality.
1. Introduction
Depending on how scholars interpret racism, it has different meanings in social and political discussions and evolved through historical developments, with persistent disagreement about its roots and development. Some argue that its origin can be traced back to the Atlantic slave trade, shaping the historical development of race and racism within the context of colonialism, and influencing modern social and political structures [1]. This has contributed to the resurgence of racism in the 21st century across different multiracial countries. Some attribute it to the 18th century Enlightenment period and the formation of biological racial categorizations; others link it to politically motivate scientific and social perspectives and deeply ingrained societal prejudice; while others argue that it is rooted in scientific and social perspectives, psychological factors, and economic considerations [2–4].
The current view on racism suggests that it is influenced by economic factors, seen as a cost-minimizing choice by economic agents, perpetuating discrimination, and benefiting certain societal groups [5]. Racism results from a multifaceted interplay of historical, social, and economic factors [4, 6]. It persists in various forms, adapting to societal changes and continuing to influence social dynamics, exacerbating existing problems in a globalized world. Despite these debates, racism endures in various forms, adapting to societal changes and influencing social dynamics. It reinforces hierarchies and prejudices, creating divisions between different racial groups. These ongoing complexities and negative impacts exacerbate existing problems in a globalized world. It involves behaviors rooted in the belief that some people are inherently inferior [7–9]. Racism is seen as a set of learned attitudes that develop through interactions, education, mass media, religion, and other communication channels that is the outward expression of prejudiced beliefs, feelings, behaviors, and practices that create and worsen inequalities for people from certain ethnic or racial groups [10, 11]. It is still a significant problem in our world today and causes many issues for people of different races [12, 13]. It violates human rights and affects many aspects of society, including social, political, and economic crises [14, 15], that can lead to social instability, influence election results, and cause financial losses [11, 16]. It is important to recognize this as a major problem that needs solutions [17–19].
A mathematical model can be a valuable tool in understanding and addressing the spread of racism and its impact on society. The study conducted in [11] emphasized the importance of predicting the status of racism and corruption, intervening constructively using a deterministic mathematical model, and analyzing the coexistence of racism and corruption with their effects on communities. The study in [13] delved into the spread of racism and its intervention methods using a deterministic mathematical model that highlights the significant impact of racist speech on social media and emphasizes the need for effective interventions. In diverse societies, effective communication is crucial for maintaining peace, sharing information, and reconciling differences. The study by Mamo [17] aimed to develop a mathematical model to understand and combat the spread of online racism. It emphasized the Internet’s positive role in communication and skill acquisition but also addressed how it is exploited by the extreme right to propagate racism, causing societal discord. The study used a mathematical model to analyze the spread of racism on social networks and found a strong correlation between the average number of individuals influenced by a single person and the proliferation of racism.
In the study by Teklu [20], it was discovered that violence and racism coexist as common issues worldwide. A new mathematical model was created to understand their coexistence, considering eight distinct classes of the human population and potential strategies to control their coinfection. The analysis revealed that the spread of violence and racism is manageable if the average number of secondary racist individuals is less than one, but it becomes uncontrollable if this number exceeds one. The study by Mamo [16] shows that racism spreads quickly through Web 2.0 technologies, impacting people’s lives, political views, and socioeconomic situations.
The research also explores the role of community resilience in combating racism. Depending on the dynamical expansion of racism an SERDC mathematical model was developed and analyzed. According to the model, enhancing community resilience can help reduce and eliminate racism by strengthening social connections and solidarity. To enhance the introduction and methods sections of the manuscript, recent studies have been integrated. Teklu and Abebaw’s [21] study examines advancements in computational social science and methodologies for modeling social issues like racism. Teklu et al. [22] analyzed social interaction dynamics that influence community behavior, refining racism models. Teklu [20] discussed how social networks affect the spread of attitudes, useful for assessing racism patterns. Additionally, Teklu [23] presented new techniques for modeling complex social systems for improved accuracy. Agyemang [24] highlighted the role of socioeconomic factors in social dynamics, advocating for their inclusion in the racism model for enhanced realism.
Developing an effective mathematical model is crucial for understanding the complexity and dynamic relationships of racism in today’s globalized world. Despite previous attempts, no stochastic mathematical model of racism has been developed to describe its complexity, analyze emerging factors, and predict uncertain conditions. Existing models focused on deterministic mathematical models, which overlook uncertain conditions resulting from racism. This study proposed a stochastic mathematical modeling approach to gain insight into the spread of racism and its prevention and control mechanisms. The rest part of this paper is structured as follows: Section 2 outlines the model’s description, assumptions, and formulation. Section 3 conducts a qualitative analysis of the model; Section 4 simulates the model; and Section 5 provides a discussion on the summary and conclusion of the study.
2. Description, Assumptions, and Formulation of the Model
- •
The number of susceptible individuals increases due to immigrants and nonracist newborns.
- •
Racist individuals die due to racism, temporarily recover from racism, or are jailed due to their racist behavior.
- •
Individuals in the recovered class may be vulnerable to racist behavior several years later.
- •
A person who is jailed can recover from racist behavior due to imprisonment or can receive the death penalty.
- •
We also assumed that a protected group of people rejected racism for their entire lifetime.
- •
All of the parameters given in Table 1 and compartments will be considered non-negative.
| Parameters | Description |
|---|---|
| π | Rate at which racist be remove from racism develop temporary recovery |
| β | Death rate resulting from racism in arrests or due to life-long sentences |
| α | Contact rate of susceptible with racist |
| δ | Rate at which racist individuals are caught and imprisoned |
| ω | Recruitment rate |
| μ | Natural death rate |
| φ | Death rate due to racism |
| γ | Removal rate of jailed individual |
| θ | Protected rate of susceptible individuals |
| σ | Intensity rate |
| ρ | The rate at which removal returns to the vulnerability of racism |
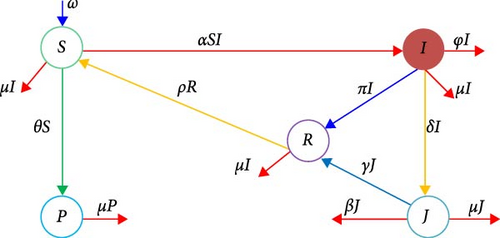
Moreover, the mass-action incidence rate was selected for this model due to its ability to illustrate the social effects of racism effectively which emphasizes the direct interactions that lead to new racist incidents and reflects the wider community impact, mirroring the swift spread of racist ideas through social networks. This approach simplifies the mathematical framework, enhancing generalization and allowing for simulations of large-scale interventions. Based on these assumptions, the following diagram was developed.
From Figure 1, the following ordinary differential equation is formulated:
3. Model Analysis
In a study by Selic and Gerard [26], it is highlighted that developing a mathematical model plays a crucial role in the field of science. Analyzing these models is essential for predicting the most significant features of integrated systems. The basic aspects of the model, including boundedness and positivity of the solution, equilibrium point and stability, threshold value, and sensitivity analysis, are outlined in the study.
3.1. Positivity and Boundedness of the Solutions
The study conducted by Parra et al. [27] explains that in the model, the state variable always yields a positive solution as it represents a population size. If all solutions to Equation (1) remain non-negative for all t > 0 with positive initial conditions, the model is considered mathematically meaningful.
Theorem 1. The solutions to the system of Equation (1) for all t > 0 are all non-negative, with positive initial conditions.
All solutions of the state variables given in Equations (11)–(19) are expressed as exponential functions. The range of an exponential function is a positive real number. Therefore, for non-negative initial conditions and parameter’s value given in Table 1, all solutions are positive, implying that S(t) > 0, P(t) > 0, I(t) > 0, J(t) > 0, and R(t) > 0. The feasibility of the model, as described in the study by Ogundare and Akingbade [28], explains the extent to which the solution of the system of equations makes biological sense. Consequently, the solution of the system of Equation (1) is non-negative, indicating that the developed model is mathematically meaningful.
Theorem 2. All model solutions to the system of Equation (1) with initial conditions of S(0) > 0, P(0) ≥ 0, I(0) ≥ 0, J(0) ≥ 0, and R(0) ≥ 0 approach and stay in the compact set as t increases. Then, the positive invariant set of models, a feasible solution, is given at .
The next step is applying the integrating factor method u(t) which is given by:
u(t) = e∫μ dt = eμt.
After a long period, the value on the right side of Equation (27) approaches zero. This means that as t → ∞, the value of e−μt(∫(−βeμtJ(t) − φeμtI(t))dt + C) also approaches zero. As a result, as t → ∞ in Equation (27), the total population size N(t) approaches . The non-negative solution of the model is proved in Theorem (1) which implies that for all t ≥ 0. Furthermore, all state variables representing the population size remain non-negative within the feasible region Ω, which explains the region in which solutions to the system of equations are mathematically meaningful. Therefore, the developed mathematical model is bounded in the region .
3.2. Equilibrium Point
The equilibrium point is a point where the state variables of the system stay constant [29]. In a mathematical model of racism, an equilibrium point represents a stable state where variables remain constant over time. Understanding equilibrium points related to racism is vital for effective interventions. There are two types of equilibrium points: the racism-free equilibrium point (RFEP) represents a community free of racist attitudes, while the racism-persistent equilibrium point (RPEP) indicates a stable presence of racism.
3.2.1. RFEP
So, the RFEP for the developed model is given as .
3.2.2. RPEP
3.3. Threshold Value of the Model
Here, for the developed model the solution of the characteristic equation is the threshold value, that means . Therefore, . Without considering stochastic factors (i.e., in a deterministic model), the threshold value remains the same as This indicates that Based on this equation, we can see that the threshold value for the deterministic model is higher than that of the stochastic approach. This emphasizes the importance of using a stochastic approach rather than a deterministic one to effectively control the spread of racism.
3.3.1. Stability Analysis Equilibrium Point
In this section, we explored the local and global stability of RFEP and RPEP based on the idea mentioned in the study by Böttcher et al. [30]. When the RFEP is locally stable, minor disturbances such as isolated incidents of racism will diminish over time, allowing the system to revert to a racism-free state. The sociological implications of local stability suggest that the system’s response to small changes is both predictable and manageable. For instance, when society approaches the RFEP and demonstrates local stability, it can effectively address minor incidents of racism to maintain a racism-free environment. On the other hand, global stability indicates that if the RPEP is globally stable, the system will sustain its current level of racism regardless of initial conditions. This suggests that attempts to eradicate racism may ultimately prove ineffective in the long run. The sociological implications of global stability highlight that the system’s long-term behavior is resilient to significant changes. For example, if the RFEP is globally stable, society will inevitably become free of racism, regardless of the initial prevalence of racist attitudes. Thus, global stability indicates that if the RPEP remains globally stable, the system will maintain its current level of racism, underscoring the challenges involved in efforts to eliminate it over time.
Theorem 3. For any initial values of S(0), P(0), I(0), J(0), and R(0) tends to zero almost surely exponentially stable that obeys , if
Since all parameters are assumed positive then (μ + π + φ + δ) > 0. As a result, equation is less than zero if . Therefore, RFEP of the model is locally asymptotically stable, if .
3.3.2. Global Stability of RPEP
Theorem 4. The equilibrium point of the model Equation (1) is globally asymptotically stable if due to racism prevalence.
For k ∈ Nsuch that k ≥ k0 let Akτk ≤ T. Then, P(Ak) ≥ ɛ. If t ∈ Ak; then at least one of the following will hold true:
.
Hence, we have τ = ∞. Therefore, for any initial value , the system of equation has a unique global solution on t ≥ 0, which will persist within the specified range with a probability of 1.
Theorem 5. If , then the racism prevalence equilibrium points of the system (Equation 1)) is locally asymptotically stable.
The study by Tilahun et al. [25] discussed the conditions for a quadratic equation to have negative roots, indicating asymptotic stability of the equilibrium. When both coefficient terms are positive and , the roots will have negative real parts, ensuring convergence to the equilibrium point. This implies that solution of Equation (58) trajectories will converge to the RPEP when initial values are close to the equilibrium under the condition
3.4. Sensitivity Analysis
- •
For ,
- •
For ,
- •
For ,
,
- •
For ,
,
- •
For ,
- •
For ,
.
The sensitivity analysis of the racism dynamics model highlights the impact of various key parameters, illustrated in Figure 2 and referenced in Table 3. To gauge the reliability of the prediction model and its usefulness, we need to study how the racism dynamics model responds to certain basic factors like θ, π, ω, α, δ, and σ3. Particularly the contact rate (α) between susceptible individuals and those adopting racist views. An increase in α significantly boosts the spread of racism, as indicated by a high sensitivity index value of 3.5294. To effectively combat racism, strategies should aim to reduce α through educational programs and community efforts that promote inclusive. Simulations show that lowering α can substantially decrease the prevalence of racism. Additionally, decreasing other parameters such as the protected rate θ and removal rates (π, δ) also helps reduce racist attitudes. Overall, minimizing interactions between susceptible individuals and those with racist views is crucial in mitigating the spread of harmful ideologies.
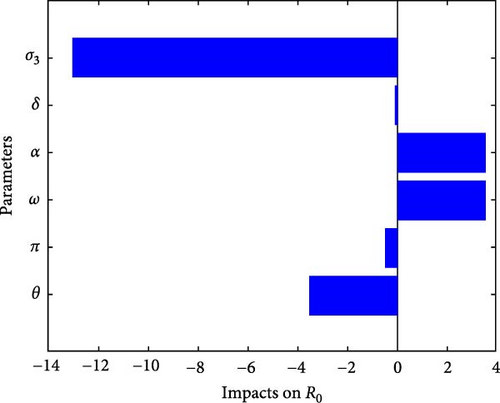
| Parameter | Sensitivity indices |
|---|---|
| θ | −3.5294 |
| π | −0.5185 |
| ω | 3.5294 |
| α | 3.5294 |
| δ | −0.1003 |
| σ3 | −13.0118 |
4. Numerical Simulation and Discussion
Based on the developed mathematical model of racism, the effect of basic parameters that cause the expansion of racism and those that help control this activity is analyzed using a numerical simulation performed using MATLAB computer software. To perform this numerical simulation, we have used the parameter values listed in Table 2.
4.1. Trends of the Model
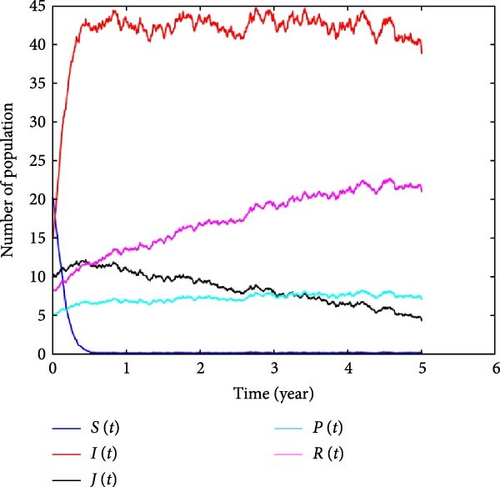
In Figure 3, the dynamics of racism are illustrated using parameter values from Table 2. Numerical simulations for the model systems (Equation 1) were conducted using MATLAB computer software, incorporating stochastic trends to gain a better understanding of racism dynamics. The slower simulation results are due to unpredictable environmental factors that influence racism, affecting individuals in communities. Including these factors in our mathematical model of racism allows for a more accurate representation of its behavior and emphasizes the importance of incorporating random factors in our model to predict the dynamics of this activity. This shows that the stochastic mathematical model for the dynamics of racism more accurately represents its actual behavior, accounting for random noise and environmental factors that impact communities. This highlights the need to address racism, promote social cohesion, and recognize its influence on politics and governance.
4.2. Effect of Racism Contact Rate on the Number of Racist Individuals
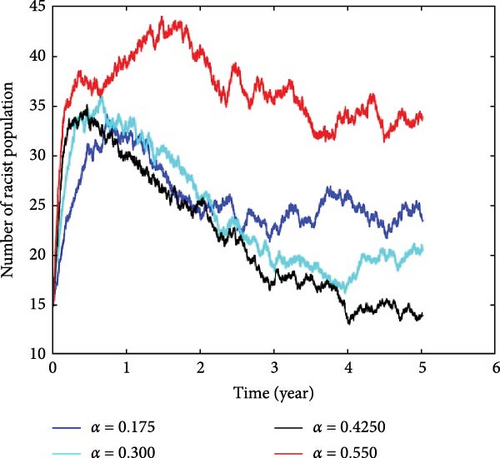
This section provides an overview of a numerical simulation that investigates the impact of the racism contact rate (α) on the prevalence of racist individuals in a community. The simulation is based on a system of Equation (1) derived from the behavioral patterns of racism, and meticulous numerical simulations were conducted to examine the impact of α. The results of this analysis, clearly illustrated in Figure 4, demonstrate variations in α from 0.3 to 0.550, while assuming other parameters are constant. It is noteworthy that increased contact rates between racist and susceptible individuals led to a notable increase in the number of racist individuals. The insightful sensitivity analysis provided further validity to these findings, shedding light on the profound implications of this basic parameter. Furthermore, this analysis highlights the average number of individuals affected by racism due to a single racist individual at different values of α. It was observed that when α = 0.175, the value of was 0.482, when α = 0.3, then was 1.1254, and when α = 0.4250, then the value of was 1.7685. Finally, when α = 0.550, the value of was 2.4116. Research by Černigoj [32] emphasized that increased exposure to racism may potentially reinforce racist attitudes among susceptible individuals, which can impact communities with high levels of racial prejudice. However, fostering positive interactions between individuals from diverse cultural or ethnic backgrounds has significant potential in reducing racist attitudes and discrimination.
4.3. Impact of the Rate of Apprehending and Incarcerating Racist Individuals Due to Their Attitudes and Behaviors
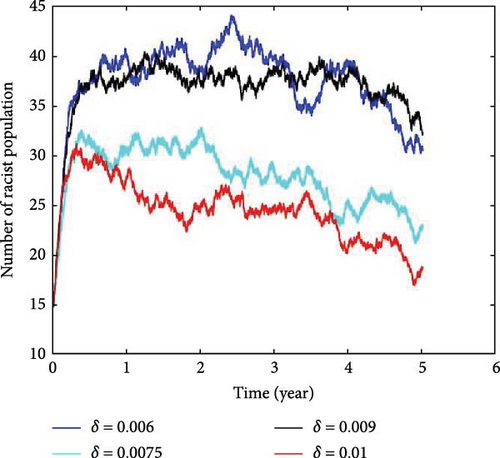
The following analysis explores the connection between the rate of apprehension for racist behavior and the number of racist incidents. The findings reveal that the relationship between the apprehension rate and the number of racist individuals is intricate. Figure 5 illustrates the results of this analysis, obtained by adjusting the value of δ from 0.006 to 0.010. The graph indicates that the rate of apprehension can influence the dynamics of the racist population. Implementing measures against racist behavior can have positive effects on individuals and the community by potentially reducing such incidents. To gain further insight, we calculated the average number of secondary racist individuals caused by a single racist person. When δ = 0.006, the value of , and when δ = 0.0075, . When δ = 0.009, the value of , and when δ = 0.010, . These values indicate a strictly decreasing trend, influenced by stochastic perturbations that can lead to variations in this relationship. However, the apprehension of individuals might result in conflicts and influence others to perceive racism as a political issue. Research in [33] suggests that holding individuals accountable for racism can reinforce societal norms against it, build community trust, and raise awareness about the consequences of racist behavior. This suggests that increasing the apprehension rate of racist individuals is crucial for controlling and reducing racism in society. The findings illustrated in Figure 5 demonstrate that as the prevalence of racism increases, so does the number of people incarcerated. This approach is implemented by a country’s administration to reduce racism by fostering trust in the legal system and addressing racial concerns. Additionally, researchers such as [34–37] propose that incarcerating racist individuals can offer opportunities for rehabilitation and education, ultimately decreasing the likelihood of future racist behavior. Continuous efforts to reduce racism can encourage the development of inclusive and fair social norms and cultural transformation.
4.4. Effect of Rate of Protected Against Racism on Racist
Figure 6 shows how denying racism affects interactions with individuals who hold racist beliefs by varying the value for θ from θ = 0.0088 to θ = 0.02125. To identify the impact of this change, we calculated the average number of racist behaviors caused by one racist individual. When θ = 0.0088, the value of is 1.2001; when θ = 0.01, equals 1.1254; and when θ takes on another θvalue, is 1.0546.
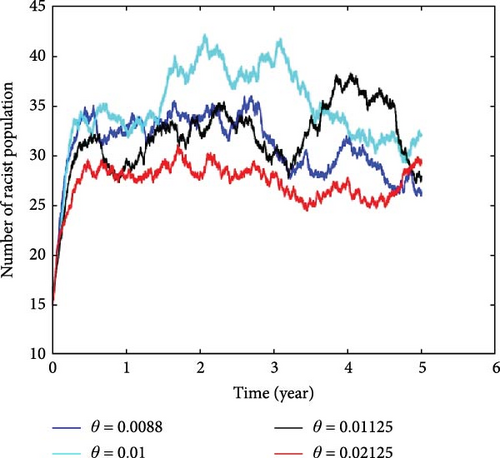
Finally, when θ reaches a certain value, falls to 0.6593. These values consistently decrease, indicating that as denial rates increase, the number of racists in community’s decreases and may eventually be eradicated. This underscores the significant impact of denying racism on efforts to reduce racial disparities and promote social equality. It is important to note that people who have experienced racism are more likely to feel isolated, depressed, and may suffer from mental health issues. Denying racism is crucial in reducing conflicts and societal divisions, promoting social equality and self-preservation, and lowering tensions between organizations and individuals who acknowledge racism and those who do not. This relationship was explored through numerical simulation by varying the value of θ, as depicted in Figure 6.
4.5. Effect Removal Rate From Racist and Jailed
Sometimes, individuals who have displayed racist behavior are able to change and stop promoting racism before facing legal consequences. The rate at which this change occurs is represented by the symbol π. To illustrate how changes in this rate can help control the spread of racism, refer to Figure 7. To understand the impact on the average number of racists in the population, we conducted the following tests: When π = 0.0236, the value of , when π = 0.01, then and when π = 0.01125, then the value of , and when π = 0.9637, then the value of . When racists are put in prison for their racist actions, it reduces the impact of racism. We used mathematical model to study this.
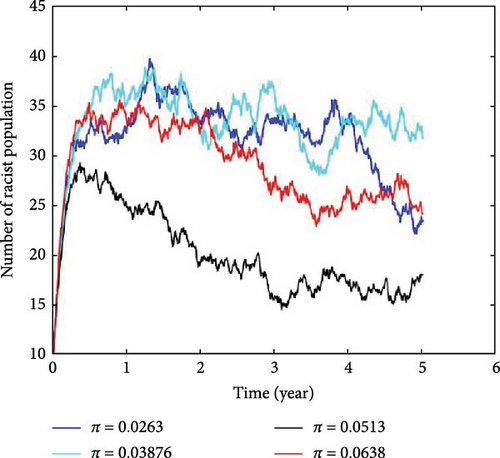
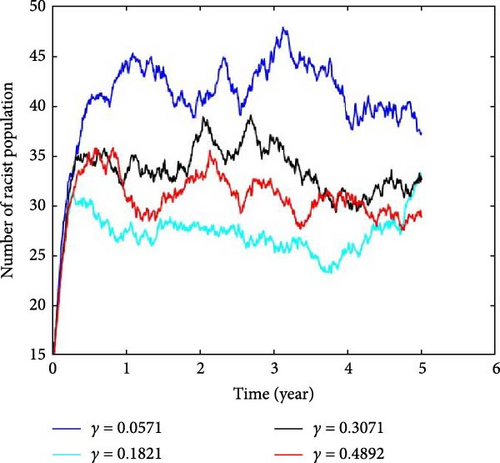
Figure 8 shows that penalizing racists leads to a significant decrease in the number of racists. This could be due to penalties related to racial disparities in incarceration. The analysis in the figure suggests that penalizing racists deters others from doing the same. While efforts are being made to address racial disparities in the criminal justice system, the effects of incarceration on individuals and communities remain significant. Those who recover from the impact of racism and incarceration undergo a powerful transformation, leading to personal growth and a deeper understanding of racism’s effects. This transformation can inspire a commitment to advocating for change and promoting awareness and education about the harms of racism within communities. By establishing strong support networks and advocating for policy changes, individuals contribute to broader societal efforts to reduce racism and promote equality. Based on the system of Equation (3), specifically varying the removal rate γ, as seen in Figure 8 from 0.0571 to 0.4892, plays a significant role in reducing racism.
5. Discussion and Conclusion
This study explores the dynamics, prevention, and control of racism using a stochastic mathematical model. The entire population is divided into susceptible (S(t)), protected (P(t)), racist (I(t)), jailed (J(t)), and removal (R(t)) categories. The study computes the average number of racists caused by a single racist person, considering stochastic factors as and without considering stochastic factors as . To assess the reliability of the prediction model and its usefulness, the study examines how the racism dynamics model responds to basic factors such as θ, π, ω, α, δ, and σ3 through sensitivity analysis of key parameters. The model indicates that factors such as the population’s ongoing recruitment rate (ω) and contact rate (α) notably impact the prevalence of racism, while factors like the protected rate (θ), removal rate of racists without punishment (π), removal rate of racists with punishment by imprisonment (δ), and intensity rate (σ3) have a significant effect on reducing racism. The study used MATLAB software for numerical simulation to investigate the impact of racism dynamics in communities numerically. The inclusion of stochastic trends in the simulation emphasizes the influence of unpredictable environmental factors on the prevalence of racism. The analysis highlights the need to address racism, promote social cohesion, and recognize its impact on politics and governance. Increased contact rates between racist and susceptible individuals lead to a notable increase in the number of racist individuals. The study also emphasizes the potential of positive interactions between individuals from diverse cultural or ethnic backgrounds in reducing racist attitudes and discrimination. The role of denying racism on interactions with individuals holding racist beliefs is explored through numerical simulation. As the denial rates increase, the number of racists in communities consistently decreases, potentially leading to eradication. Denying racism is crucial in reducing conflicts, promoting social equality, and lowering tensions. It is important to note that individuals who have experienced racism are more likely to feel isolated, depressed, and may suffer from mental health issues. The rate at which individuals display racist behavior can change before facing legal consequences and changes in this rate can help control the spread of racism and impact the average number of racists in the population. The developed model for analyzing racism emphasizes understanding its intricate dynamics through the use of quantitative methods, specifically stochastic dynamical systems, to identify trends and evaluate intervention effectiveness. By integrating sociology, mathematics, and computer science, this study enhances its overall comprehensiveness and rigor. This innovative approach seeks to advance research practices and contribute to social justice and equality by providing a thorough analysis of racism. In particular, this study employs stochastic dynamical systems to model the evolution of racism and utilizes mass-action incidence rates to illustrate community interactions. By concentrating on quantitative analysis, it identifies patterns and forecasts trends while assessing various intervention strategies. The interdisciplinary nature of the research offers a holistic perspective on racism, guiding policymakers in the formulation of effective strategies. Future research could delve into optimal control strategies and fractional order derivative models, thereby providing a more nuanced understanding of racism and aiding the development of robust intervention approaches to address this pressing societal issue. Researchers may explore models that incorporate factors such as economic status, education, and geography to capture the issue’s complexity. Investigating intervention strategies, including educational initiatives and policy reforms, could significantly contribute to reducing the prevalence of racism. Longitudinal studies are likely to unveil the long-term dynamics of racism and the effectiveness of various interventions. Additionally, cross-cultural comparisons may reveal unique patterns, while the use of real-world data can enhance research findings. Furthermore, leveraging advancements in artificial intelligence and machine learning could aid in predicting future trends and informing proactive interventions, ultimately enriching our understanding and improving strategies to combat racism.
Conflicts of Interest
The authors declare no conflicts of interest.
Author Contributions
All authors have equal contributions to this paper, and also they have read and approved the manuscript.
Funding
No funding was received for this research
Open Research
Data Availability Statement
The data supporting these study’s findings were sourced from various peer-reviewed articles. Relevant references are included within the article, complete with citations, ensuring transparency, and allowing readers to verify the information.


