Interaction of α-Cembrenediol with Human Serum Albumin Based on Spectroscopic and Computational Analyses
Abstract
α-Cembrenediol exhibits a wide range of biological activities, including antibacterial, antitumor, and neuroprotective effects. However, knowledge of the absorption, transport, and release of α-cembrenediol in drug metabolism within the body is currently limited. Therefore, we aimed to gain a comprehensive understanding of the in vivo transport, distribution, and elimination mechanisms of α-cembrenediol and investigate the interaction between α-cembrenediol and HSA. To this end, we utilized various methods including UV absorption spectroscopy, steady-state fluorescence analysis, circular dichroism measurements, molecular docking studies, and molecular dynamics simulations. The results of the UV and fluorescence spectra clearly demonstrated that HSA interacts with α-cembrenediol. Specifically, the fluorescence spectra results showed that at a temperature of 310 K, the fluorescence quenching constant (KSV) and binding constant (Kb) between HSA and α-cembrenediol were determined to be 1.28 × 10³ Lmol−1 and 218.27 Lmol−1, respectively. As the temperature was decreased from 310 K to 293 K, both KSV and Kb values increased, indicating the presence of a static quenching mechanism throughout the interaction process. Moreover, the results indicated the presence of a singular, specific binding site for α-cembrenediol on HSA, as evidenced by an approximate count of one binding site at all three temperatures. Additionally, this binding process occurred spontaneously (ΔG < 0), with van der Waals interactions and hydrogen bonding as the primary driving forces (ΔH = −9.40 kJmol−1 and ΔS = −14.50 Jmol−1·K−1). The binding of α-cembrenediol to Sudlow site I of HSA was confirmed through molecular docking, a combination of fluorescence probe substitution, and molecular dynamics simulation experiments. Moreover, the results demonstrated that α-cembrenediol binding led to alterations in the structural conformation of HSA, as confirmed by three-dimensional fluorescence, synchronous fluorescence, and circular dichroism spectra. This study offers crucial insights into the interaction between α-cembrenediol and HSA, contributing to an improved understanding of the compound’s pharmacokinetic properties.
1. Introduction
α-Cembrenediol (α-2,7,11-cembratriene-4,6-diol) is a natural compound classified as a cembrane diterpene. It is commonly found in plants such as tobacco, pine, and Euphorbia, as well as marine organisms, with the highest concentration observed in tobacco [1, 2]. Research has demonstrated that α-cembrenediol possesses diverse biological activities, including having antitumor, antibacterial, and neuroprotective effects. α-Cembrenediol was initially identified as an antitumor agent in 1985 and was shown to inhibit the growth of skin tumors in mice [3]. In vitro experiments have revealed that α-cembrenediol acts as a novel c-Met inhibitor, leading to a substantial decrease in the activation of VEGFR2 in different breast cancer cell lines and a consequent decrease in tumor size in MDA-MB-231 mice models [4, 5]. Additionally, α-cembrenediol can induce apoptosis and suppresses cell proliferation in HepG2 cells through multiple pathways, including the IL-1-NF-κB-IAP, PI3K-Akt, and p53-PUMA cascades [6, 7]. Regarding its antibacterial activity, α-cembrenediol demonstrates broad-spectrum antimicrobial properties and can inhibit the growth of fungi such as Candida albicans, as well as bacteria like Bacillus subtilis and Staphylococcus aureus [8–10]. Moreover, α-cembrenediol interacts with nicotinic acetylcholine receptors, exerting neuroprotective effects against organophosphate poisoning, cerebral ischemia, and Parkinson’s disease [9, 11]. Importantly, toxicological studies have confirmed the favorable safety profile of α-cembrenediol [12]. Consequently, α-cembrenediol possesses significant potential for applications in various fields, including in food, health products, and biomedicine.
However, our understanding of the absorption, transport, and release of α-cembrenediol in drug metabolism within the body is currently limited. Serum albumin (SA), an essential transport protein in the blood, can bind to drug molecules and transport them to target receptor sites to exert their pharmacological effects [13, 14]. In addition, SA binds to various endogenous and exogenous compounds, playing a significant role in their storage and transport [15]. Therefore, investigating the interaction between SA and α-cembrenediol can enhance our comprehension of the transport and distribution mechanisms of α-cembrenediol within the body, which is crucial for elucidating its physiological mechanisms of action.
Human serum albumin (HSA) is a highly utilized model protein for in vitro investigations of drug-protein interactions [16–18]. Ultraviolet, fluorescence, and circular dichroism spectroscopy were employed to replicate physiological conditions in this study [19–21]. Furthermore, computational simulation techniques such as molecular dynamics and docking were utilized to investigate the binding mechanism of α-cembrenediol with HSA [22–24]. Our objective was to examine crucial binding parameters, such as binding constants and thermodynamic parameters, while also observing pre- and postbinding conformational changes in HSA. The results of this study can help to establish a theoretical basis for comprehending the binding and transport of α-cembrenediol in the bloodstream, thereby facilitating its development and applications in the food, health products, and pharmaceutical fields.
2. Materials and Methods
2.1. Sample Preparation
A 3 μmol/L HSA solution was prepared using PBS buffer (1% methanol, pH 7.4). α-Cembrenediol was dissolved in methanol and diluted with PBS buffer to generate a 3.0 mmol/L α-cembrenediol solution (5% methanol). Sodium warfarin and ibuprofen solutions (concentrations of 3.0 mmol/L) were also prepared using PBS buffer.
2.2. UV Spectroscopy
Due to the limited solubility of α-cembrenediol, its in vivo concentration remains relatively low. Therefore, in in vitro simulations, the concentration ratio of α-cembrenediol to HSA is also maintained at a relatively low level (less than 10-fold) [25]. A 1 mL aliquot of the HSA solution was added to a cuvette at 310 K and ultraviolet absorption spectroscopy was performed with a wavelength scanning range of 200–500 nm. Subsequently, 1 μL of α-cembrenediol solution was added in increments, resulting in drug concentrations of 0, 3, 6, 9, 12, 15, 18, 21, 24, 27, and 30 μmol/L. After each incremental addition, detection was conducted again after a reaction equilibrium period of 5 min, using the corresponding concentration of α-cembrenediol as the reference solution.
2.3. Fluorescence Spectroscopy
A quartz cuvette was filled with approximately 3 mL of HSA solution, and its fluorescence spectrum was detected using a fluorescence spectrophotometer [26]. After detection, 3 μL increments of α-cembrenediol solution were added to the cuvette, resulting in drug concentrations of 0, 3, 6, 9, 12, 15, 18, 21, 24, 27, and 30 μmol/L. After incremental addition, the reaction was allowed to reach equilibrium for 5 minutes, followed by the detection of the fluorescence spectrum of the reaction system. The emission spectra were excited at λex of 278 nm and 295 nm, respectively, and scanned over a wavelength range of 300–400 nm. The excitation voltage was set at 400 V, with both the emission and excitation slits set at 5 nm. Detection was carried out at three distinct temperatures: 310 K (normal body temperature), 303 K, and 293 K, respectively.
2.4. Synchronous Fluorescence Spectroscopy and Three-Dimensional Fluorescence Spectroscopy
The sample treatment was the same as that for intrinsic fluorescence spectroscopy. Synchronous fluorescence spectroscopy was performed with a wavelength range scanned from 250 to 350 nm at 310 K, and the spectral data were detected at Δλ of 15 nm and 60 nm, representing the difference between the excitation and emission wavelengths [29]. The emission and excitation wavelength ranges for the three-dimensional fluorescence spectroscopy study were set from 200 nm to 500 nm and 250 nm to 350 nm, respectively. The detection temperature was held constant at 310 K with a scanning speed of 12,000 nm/min.
2.5. Circular Dichroism Spectroscopy
Circular dichroism spectra in the far-UV region were obtained at 310 K using a 1 mm quartz cuvette. The HSA sample concentration was 3 μmol/L, and α-cembrenediol was added to final concentrations of 0, 3, 9, and 15 μmol/L. In the experiment, a fixed scanning wavelength of 200–250 nm was utilized with a data interval of 1 nm. The emission and excitation slits were both set at 1 nm, and the scanning speed was adjusted to 50 nm/min. CDNN 2.1 deconvolution software was used to analyze the data and estimate the secondary structure of the HSA reaction system [30].
2.6. Competitive Binding Experiments
α-Cembrenediol and HSA were mixed (final concentration Cα−cembrenediol = CHSA = 3 μmol/L) and allowed to react for 5 min. Ibuprofen, a fluorescent probe, was then added to the reaction system using a microinjector. The final concentration of ibuprofen in the mixed solution gradually increased from 0 to 30 μmol/L. Following each injection, a 5-minute incubation period was allowed before detection. The detection parameters were the same as those for intrinsic fluorescence spectroscopy, where the excitation wavelength was set at 278 nm and the temperature was maintained at 293 K. The same protocol was performed when warfarin was used as the probe.
2.7. Molecular Docking Simulation
The HSA crystal structure was retrieved from the Protein Data Bank (PDB_ID: 2BXG) website, which is commonly utilized due to its high resolution. Using PyMol v1.0, water molecules, ions, and ligands were manually removed from the protein crystals. The missing residues were automatically filled in using the SWISS-MODEL online website. The three-dimensional structure of α-cembrenediol (CAS_ID: 57605-80-8) was downloaded from the PubChem website (PubChem_ID: 6438508).
AutoDockTools was used to add charges and polar hydrogen atoms and convert the protein and small molecule ligands into the AutoDock 4.2 recognizable pdbqt file format [32]. HSA was aligned using PyMol v1.0. Based on the cocrystallized ligands, Sudlow sites I (center_x = 30.60, center_y = 16.15, center_z = 11.04) and II (center_x = 6.82, center_y = 4.59, center_z = −15.00) were determined. In the molecular docking simulations, a grid spacing of 0.375 Å was used, and the dimensions of the docking box were set to 60 Å along each of the X, Y, and Z axes.
Molecular docking was performed using AutoDock Vina with its default Vina force field. Docking results with low binding energy and reasonable conformations were selected for further binding mode analysis and molecular dynamics simulations.
2.8. Molecular Dynamics Simulation
Using GROMACS 4.6.5, molecular dynamics simulations were conducted on human serum albumin (HSA) and the HSA-α-cembrenediol complex [33]. The topology structure file for HSA was generated using the “pdb2gmx” program provided by GROMACS 4.6.5 and the Amberff99SB force field. The small molecule topology file for α-cembrenediol was generated using AmberTools15’s “antechamber” and “tleap” programs, with the GAFF (general amber force field) force field. TIP3P water molecules were placed in a dodecahedron box conformation, with the periodic boundary conditions set at 1.2 nm. To maintain overall system neutrality, Cl− and Na+ ions were introduced into the water box.
Before the formal molecular dynamics simulation, an energy minimization step was performed on all systems using the steepest descent method for 10,000 steps. This step aimed to eliminate high-energy clashes and unreasonable spatial conformations in the system’s bonds. Each system underwent a 100 ps molecular dynamics simulation in both the NVT and NPT ensembles. Finally, a 50 ns molecular dynamics simulation was conducted on all systems with a time step of 2 fs. Long-range electrostatic interactions were computed using the PME method, whereas water molecules and hydrogen bonds were restrained using the SETTLE and LINCS methods, respectively. The GROMACS 4.6.5 tools, including “g_rms,” “g_rmsf,” “g_gyrate,” and “g_hbond,” were used for the analysis of RMSD (root mean square deviation), RMSF (root mean square fluctuation), Rg (radius of gyration), and hydrogen bond values.
3. Results and Discussion
3.1. UV Spectroscopy
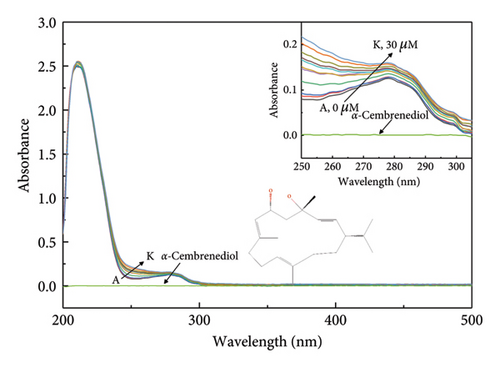
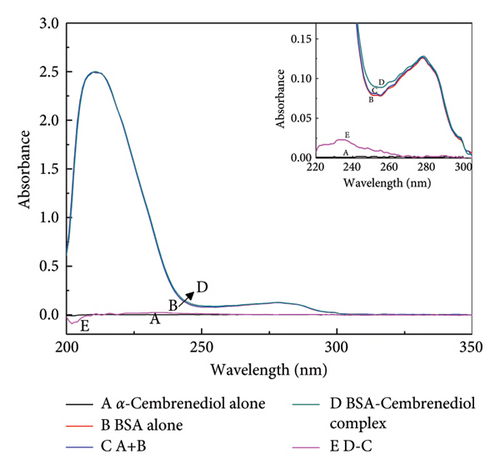
UV-visible absorption spectroscopy provides a valuable approach for investigating complex structural changes and formations. The UV spectrum presented in Figure 1 shows a prominent absorption peak at 220 nm, representing the characteristic α-helix backbone structure of HSA. Furthermore, an additional absorption peak around 280 nm was detected, which was likely to be caused by the presence of aromatic amino acids such as phenylalanine, tyrosine, and tryptophan [34]. As depicted in Figure 1(a), the absorption value of the HSA-α-cembrenediol reaction system at 280 nm systematically increased with increasing concentrations of α-cembrenediol, which was accompanied by a slight blue shift. The systematic changes suggest that the variations in the absorption values are not due to equipment errors, indicating an interaction between α-cembrenediol and HSA [35]. This interaction leads to changes in the microenvironment surrounding the aromatic residues of HSA, attributed to the complexation between them [36]. Furthermore, confirmation of the static complex formation was confirmed in Figure 1(b), where the absorption spectrum of the HSA-α-cembrenediol reaction system (d) differed from the combined spectra of free HSA (b) and α-cembrenediol (a).
3.2. Fluorescence Spectroscopy
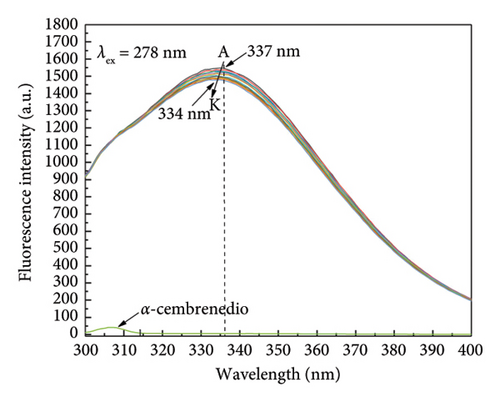
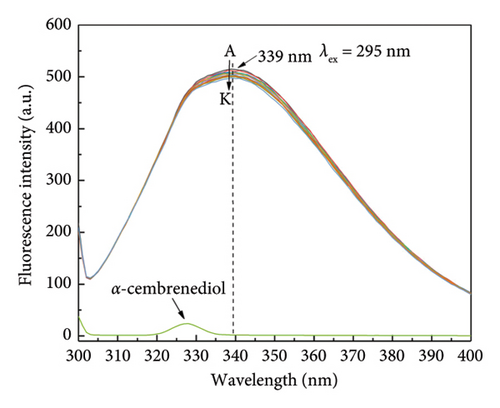
Due to its convenience, efficiency, and sensitivity, fluorescence spectroscopy is widely employed for investigating receptor-ligand interactions [37–39]. By analyzing fluorescence spectroscopy results, the binding mode and type of receptor-ligand molecules were determined. Specifically, upon excitation of HSA at λex = 278 nm, a prominent fluorescence emission peak at around 340 nm was observed. A linear decrease in the fluorescence intensity of HSA was observed as the concentration of α-cembrenediol increased, and the maximum emission peak experienced a shift to 334 nm from 337 nm. These changes indicate an interaction between α-cembrenediol and HSA, resulting in the quenching of the fluorescence signal of tryptophan residues and an increase in their hydrophobicity, as depicted in Figure 2(a). Figure 2(b) demonstrates the decrease in HSA fluorescence intensity at λex = 295 nm as the concentration of α-cembrenediol increases. Taken together, these results unequivocally demonstrate a significant interaction between α-cembrenediol and HSA.
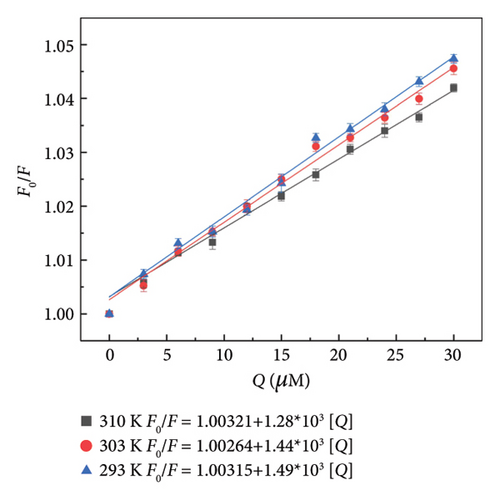
Fluorescence quenching mechanisms can be categorized as static and dynamic, depending on the underlying processes involved. Fluorescence quenching constants are critical data required to determine the dynamic and static quenching interactions between molecules. For dynamic quenching, the collision rate between molecules accelerates with increasing temperature, leading to an increase in the dynamic quenching rate and quenching constant. In contrast, the quenching constant decreases as temperature rises in the case of static quenching [40, 41]. Assuming that the fluorescence quenching of HSA by α-cembrenediol is due to dynamic quenching, the quenching constant for the complex between α-cembrenediol and HSA was studied using the Stern–Volmer equation (1) to characterize its formation. The quenching constant (Ksv) of α-cembrenediol and HSA, as shown in Figure 2(c) and Table 1, exhibited a gradual decrease with rising temperature, aligning with the characteristics of static quenching. Moreover, at 293 K, 303 K, and 310 K, the quenching rate constant (Kq) values were 1.48, 1.44, and 1.28 × 10¹¹ L·mol−1·s−1, respectively, markedly surpassing the maximum diffusion collision quenching rate constant (2.0 × 10¹⁰ L·mol−1·s−1); this observation further supports that static quenching occurs during the interactions between α-cembrenediol and HSA.
| T/K | Stern–Volmer equation | KSV (Lmol−1) | Kq (Lmol−1·S−1) | R2 |
|---|---|---|---|---|
| 293 | F0/F = 1.00315 + 1.49 × 10³[Q] | 1.49 × 10³ | 1.49 × 10¹¹ | 0.9946 |
| 303 | F0/F = 1.00264 + 1.44 × 10³[Q] | 1.44 × 10³ | 1.44 × 10¹¹ | 0.9897 |
| 310 | F0/F = 1.00321 + 1.28 × 10³[Q] | 1.28 × 10³ | 1.28 × 10¹¹ | 0.9902 |
- R2 is the correlation coefficient.
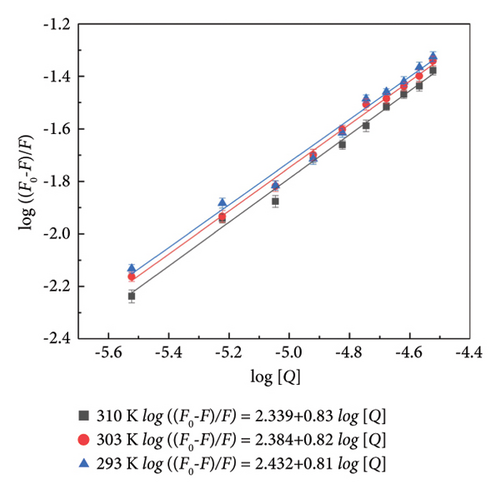
In order to quantify the number of binding sites (n) and binding constant (Kb) between HSA and α-cembrenediol, the Lineweaver–Burk double logarithmic (2) was utilized. The results from Figure 2(d) and Table 2 showed that at 310 K, the binding constant (Kb) between α-cembrenediol and HSA was 218.27 Lmol−1. The lower Kb value (lower than 103) suggests a weaker binding ability of α-cembrenediol to HSA in vivo, which could also be attributed to incomplete dissolution of the drug in the buffer solution. Therefore, conducting additional experiments such as molecular docking studies is essential for further investigating the binding between α-cembrenediol and HSA [36, 40]. As the temperature decreased to 303 K and 293 K, Kb increased to 242.11 and 270.40 Lmol−1, respectively. These findings suggest that lower temperatures enhance the binding affinity of α-cembrenediol for HSA, further confirming that static binding occurs [32]. Moreover, at these three temperatures, the values of n determined for α-cembrenediol and HSA were 0.81, 0.82, and 0.83, respectively, which were close to 1. This suggests that α-cembrenediol possesses a single independent binding site within the structure of HSA.
| T/K | Kb (Lmol−1) | n | R2 | ΔG (kJ·mol−1) | ΔH (kJ·mol−1) | ΔS (Jmol−1·K−1) |
|---|---|---|---|---|---|---|
| 293 | 270.40 | 0.83 | 0.9927 | −5.15 | −9.40 | −14.50 |
| 303 | 242.11 | 0.82 | 0.9961 | −5.01 | −9.40 | −14.50 |
| 310 | 218.27 | 0.81 | 0.9875 | −4.91 | −9.40 | −14.50 |
- R2 is the correlation coefficient.
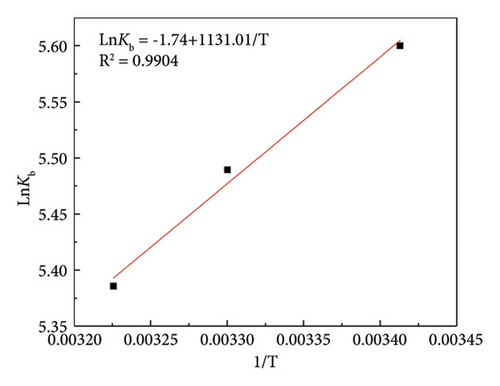
Thermodynamic parameters are commonly employed for assessing the binding mode and primary forces between ligands and proteins, such as changes in Gibbs free energy (ΔG), entropy (ΔS), and enthalpy (ΔH). The significance of hydrophobic interactions is notable in cases where ΔH > 0 and ΔS > 0, whereas electrostatic forces prevail when ΔH < 0 and ΔS > 0. In instances where ΔH < 0 and ΔS < 0, van der Waals forces or hydrogen bonds are the primary interaction forces between the ligand and the protein [33]. To determine the primary interaction forces between α-cembrenediol and HSA binding, the thermodynamic parameters of their interaction across three distinct temperatures (293 K, 303 K, and 310 K) were employed using the Van’t Hoff equation The results from Figure 2(e) and Table 2 show that ΔG was negative at all three temperature conditions, indicating that the binding of HSA and α-cembrenediol is a spontaneous process. Additionally, both ΔH and ΔS were determined to be negative, indicating that hydrogen bonds and van der Waals forces serve as the primary driving forces behind their interaction.
3.3. Synchronous Fluorescence Spectroscopy
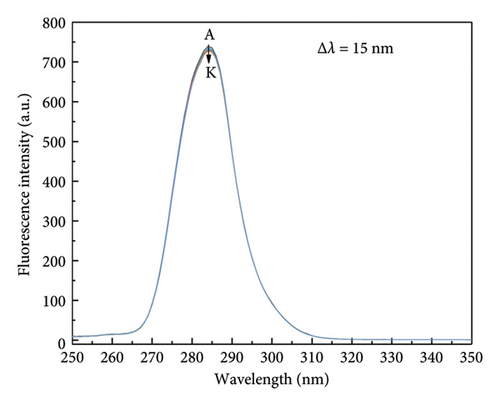
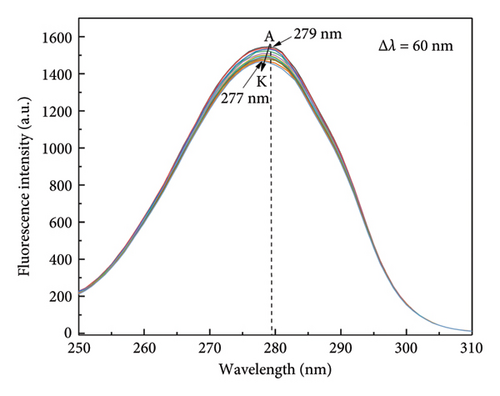
To explore the changes in the microenvironment of tyrosine and tryptophan residues in specific reactive proteins, synchronous fluorescence spectroscopy was employed [34, 36]. Spectral changes were measured at Δλ of 15 nm and 60 nm, reflecting the respective microenvironment of tyrosine and tryptophan residues, respectively. In Figure 3(a), it can be observed that the fluorescence intensity and maximum emission peak position of HSA remained relatively stable as the concentration of α-cembrenediol increased, suggesting that the interaction of α-cembrenediol with HSA did not cause notable changes in the microenvironment surrounding tyrosine residues. Conversely, Figure 3(b) demonstrates that at Δλ = 60 nm, increases in α-cembrenediol concentrations led to a shift in the maximum emission peak of HSA from 279 nm to 277 nm, accompanied by a notable decrease in the fluorescence intensity. These observations suggest that the interaction of α-cembrenediol with HSA led to modifications to the microenvironment around tryptophan residues, resulting in increased hydrophobicity and decreased polarity.
3.4. Three-Dimensional Fluorescence Spectroscopy
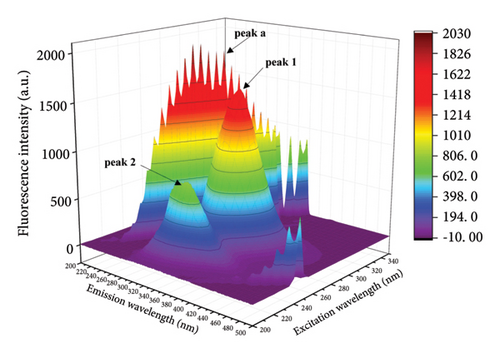
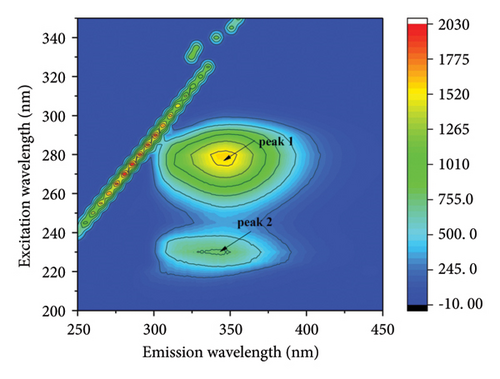
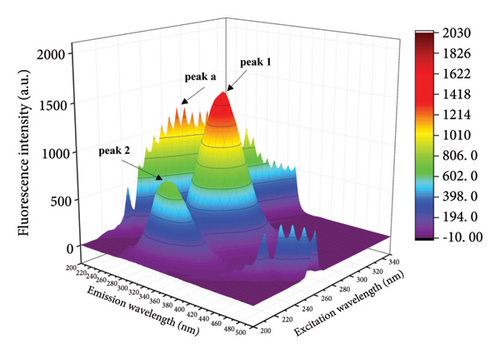
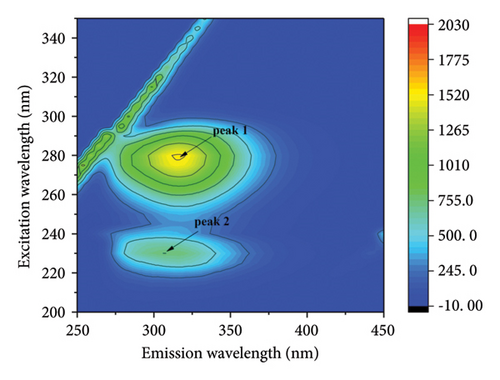
The fluorescence properties of chromophores such as tyrosine and tryptophan can be observed more comprehensively by three-dimensional fluorescence spectroscopy, allowing more accurate assessment of structural changes in proteins [42, 43]. Figure 4 shows the three-dimensional contour maps and contour plots of the free HSA and the HSA-α-cembrenediol complex, as well as the relevant parameter values listed in Table 3. Peak a corresponds to the Rayleigh scattering peak (λex = λem), while peak 1 (λex = 280 nm, λem = 347 nm) characterizes the spectral behavior of HSA chromophores. Additionally, the prominent fluorescence peak 2 (λex = 230 nm, λem = 344 nm) specifically reflects the fluorescence of the HSA peptide backbone structure. Compared with the spectra of free HSA, the fluorescence intensity of peaks 1 and 2 in HSA noticeably diminished by the addition of α-cembrenediol. Furthermore, the positions of these peaks exhibited varying degrees of blue shift, indicating significant alterations in the microenvironment of HSA molecules upon formation of the HSA-α-cembrenediol complex.
| System | Peak 1 (λex/λem) | Stokes shift Δλ = λem − λex | Fluorescence intensity | Peak 2 (λex/λem) | Stokes shift Δλ = λem − λex | Fluorescence intensity |
|---|---|---|---|---|---|---|
| HSA | 280/347 | 67 | 1603 | 230/344 | 104 | 800 |
| HSA-cembrenediol | 280/317 | 37 | 1541 | 230/307 | 77 | 757 |
3.5. Circular Dichroism Spectroscopy
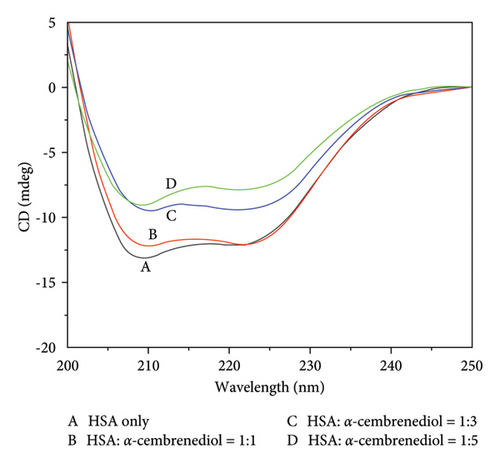
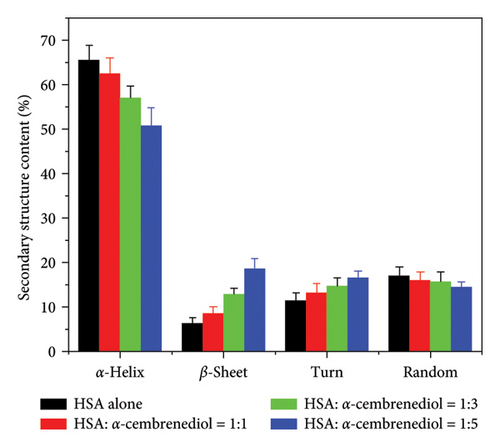
CD spectroscopy is a common method for determining the secondary structures of proteins [44]. Therefore, far-UV (200–250 nm) CD spectroscopy was employed to monitor conformational changes in HSA. Two prominent negative absorption bands at approximately 209 nm and 222 nm were revealed by the CD spectrum of HSA, arising from the n ⟶ π∗ transition within the peptide bonds of α-helical structures [27]. Upon the addition of a fixed concentration of α-cembrenediol to HSA (3 μmol/L), the intensity of these characteristic gradually diminished, accompanied by a significant red shift near 209 nm. As depicted in Figure 5(a), this observation suggests that with the increase of α-cembrenediol concentrations, the interactions between them led to the change of the secondary structure of HSA molecules. In addition, this change may be closely connected to perturbations in the microenvironment surrounding the hydrophobic cavity of aromatic residues, providing further insight into the mechanism of fluorescence quenching of HSA. Figure 5(b) shows an estimation of these changes generated using CDNN software. As the concentration of α-cembrenediol increased from 0 to 15 μmol/L, the proportion of α-helical structures in HSA decreased from an initial 65.4% to 50.7%. Meanwhile, the proportion of β-folded structures increased from 6.3% to 18.5%, that of β-turn structures increased from 11.4% to 16.3%, and that of irregular coil structures slightly decreased from 16.9% to 14.4%.
3.6. Competitive Binding Experiments
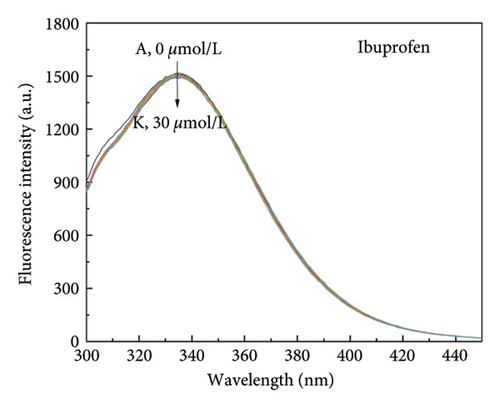
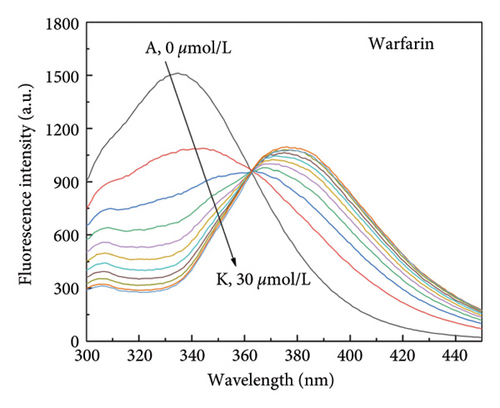
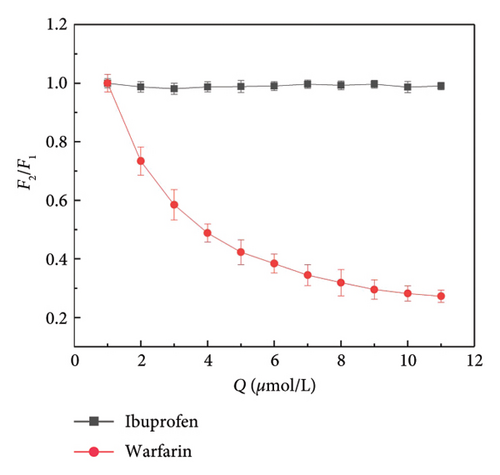
Small molecule ligands primarily bind to two subdomains of HSA. Warfarin specifically binds to HSA subdomain IIA (Sudlow site I), whereas ibuprofen is able to bind specifically to HSA subdomain IIIA (Sudlow site I) [45]. To investigate the binding position of α-cembrenediol on HSA, warfarin and ibuprofen were utilized as fluorescent probes and α-cembrenediol displacement was assessed. Employing the calculation method proposed by Sudlow et al. (5), Figures 6(a)–6(c) show that the fluorescence properties of the HSA and α-cembrenediol complex were minimally affected by the addition of ibuprofen. This suggests that ibuprofen did not interfere with the binding of HSA and α-cembrenediol. Conversely, upon the addition of warfarin to the HSA-α-cembrenediol reaction system, a significant quenching of fluorescence intensity was observed, along with a redshift of the maximum emission wavelength from 339 to 376 nm. These findings suggest that HSA and α-cembrenediol binding was notably influenced by warfarin, implying that α-cembrenediol binds to subdomain IIA (Sudlow site I).
3.7. Molecular Docking Simulation
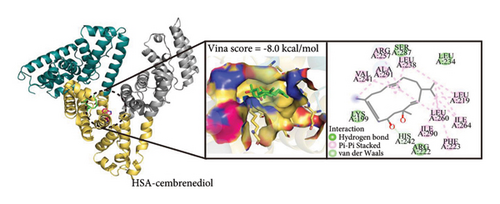
Molecular docking serves as an effective approach for analyzing molecular interactions and offers valuable insights into the interaction between α-cembrenediol and HSA [46]. To elucidate the binding mechanism of α-cembrenediol at these sites, molecular docking simulations were performed. The outcomes revealed that the lowest binding energies for α-cembrenediol binding to HSA sites I and II were −8.0 and −5.5 kcal/mol, respectively. These results suggest that α-cembrenediol has a higher binding affinity for site I, consistent with those of the fluorescence probe substitution experiments. The binding free energy obtained from molecular docking was higher than the free energy obtained from previous experimental results. This discrepancy may be attributed to the current immaturity of force field technology, resulting in certain differences between theoretical calculations and actual values. Figure 6(d) shows that α-cembrenediol entered the active site of the target protein via hydrogen bonds and van der Waals forces, bound noncovalently to site I of HSA, and formed an H-bond with His_242 (with a bond distance of 3.1 Å). Additionally, α-cembrenediol interacted hydrophobically with various amino acid residues (i.e., Leu_219, Phe_223, Leu_234, Leu_238, Val_241, Leu_260, Ile_264, Ile_290, and Ala_291), while charged residues (i.e., Lys_199, Arg_222, His_242, Arg_257, and Ser_287) also contributed to the stability of the HSA-α-cembrenediol complex. Thus, the binding of α-cembrenediol with HSA is primarily driven by hydrogen bonds and van der Waals forces, aligning with the findings of the fluorescence spectroscopic thermodynamic calculations. Moreover, hydrophobic and electrostatic interactions also played crucial roles in stabilizing the HSA-α-cembrenediol complex.
3.8. Molecular Dynamics Simulation
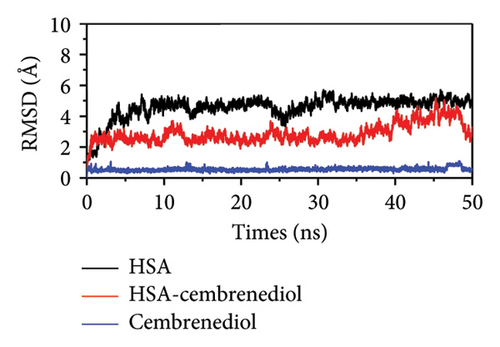
In order to better understand the binding behavior between proteins and ligands under physiological conditions, molecular dynamics simulations are considered a commonly used detection method. The rigidity and stability of HSA, as well as of the HSA-α-cembrenediol polyethylene glycol complex, were evaluated using RMSD plots over a simulation time scale of 50 ns [47]. Figure 7(a) illustrates the gradual increase in RMSD values for both HSA and the HSA-α-cembrenediol complex over the 0 to 5 ns period, followed by reaching and maintaining an equilibrium stage until the simulation concluded, indicating stability throughout the entire simulation process. Notably, the RMSD values of the HSA-cembrenediol complex were generally smaller than those of HSA alone, indicating that the interaction between α-cembrenediol and HSA induced a modification in the secondary conformation of HSA, ultimately leading to higher rigidity and stability.
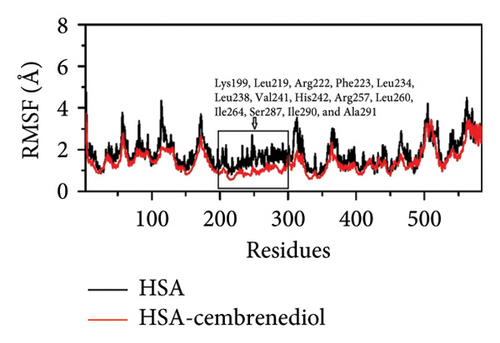
The root mean square fluctuation (RMSF) provides insight into the flexibility of ligand-protein binding [48]. Figure 7(b) presents the RMSF values for HSA and the HSA-α-cembrenediol complex. The RMSF curve of the HSA-α-cembrenediol complex displayed lower fluctuations when compared to that of HSA alone. The RMSF values of residues Lys_199, Leu_219, Arg_222, Phe_223, Leu_234, Leu_238, Val_241, His_242, Arg_257, Leu_260, Ile_264, Ser_287, Ile_290, and Ala_291 at site I were significantly lower in the HSA-α-cembrenediol polyethylene glycol complex than in HSA alone, indicating that α-cembrenediol polyethylene glycol can stably bind to these key residues, further confirming its binding to site I of HSA.
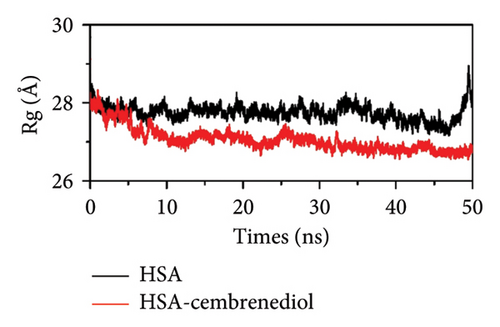
The radius of gyration (Rg) can indicate the compactness of the ligand-protein complex [49]. As shown in Figure 7(c), after α-cembrenediol polyethylene glycol was bound to HSA, the Rg value slightly decreased, indicating that the binding of α-cembrenediol polyethylene glycol to HSA induces a more compact conformation of HSA. The Rg and RMSD results were consistent with our circular dichroism experimental results, suggesting that the binding of α-cembrenediol to HSA induced conformational changes within HSA, which resulted in a reduction in α-helical content.
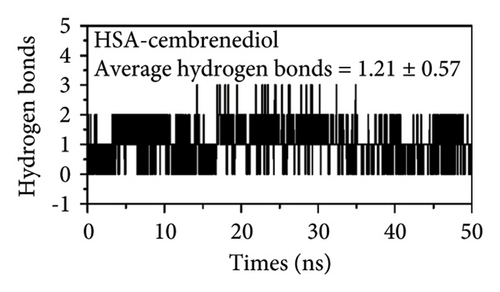
Hydrogen bonding is one of the main forces involved in ligand-protein binding [50]. Figure 7(d) presents the results of the analysis of the changes in hydrogen bonding while α-cembrenediol binds to HSA. The HSA-α-cembrenediol system exhibited an average of 1.21 ± 0.57 hydrogen bonds, which was very close to our docking model results, suggesting that one hydrogen bond was present, further confirming that hydrogen bonding played a crucial role between α-cembrenediol and HSA.
4. Conclusion
This study explored the binding interaction of α-cembrenediol with HSA under simulated physiological conditions using UV absorption spectroscopy, fluorescence spectroscopy, CD spectroscopy, and computer simulation techniques.
The addition of α-cembrenediol resulted in notable alterations to the absorption spectrum of HSA, as observed through UV absorption spectroscopy. These changes indicated a strong interaction between α-cembrenediol and HSA, resulting in alterations to the microenvironment surrounding the aromatic residues of HSA. The intrinsic fluorescence spectroscopy results additionally revealed that the interaction between α-cembrenediol and HSA reduced the polarity of tryptophan and tyrosine residues and increased the hydrophobicity, leading to fluorescence quenching. The calculated quenching constants suggested that the fluorescence quenching mechanism of α-cembrenediol binding to HSA was primarily static, which decreased with increasing temperatures. As the temperature increased, the binding constant (Kb) between HSA and α-cembrenediol also gradually decreased, confirming the static binding interaction between the two. The value for binding sites (n) showed that α-cembrenediol had a single independent binding site on the HSA.
Thermodynamic parameter analyses revealed that van der Waals forces and hydrogen bonds were the main driving forces behind the interaction of HSA with α-cembrenediol. Furthermore, molecular docking studies also indicated the presence of hydrophobic and electrostatic interactions. The results of synchronous fluorescence spectroscopy showed that the binding of α-cembrenediol to HSA led to alterations in the microenvironment of HSA amino acid residues, reducing the polarity of tryptophan residues and enhancing the hydrophobicity. The three-dimensional fluorescence spectroscopy results indicated that the peptide backbone structure of HSA underwent alterations following binding with α-cembrenediol. Moreover, the circular dichroism spectroscopy results demonstrated a reduction in the α-helix content and an elevation in the β-turn and β-sheet contents of HSA upon binding with α-cembrenediol. The fluorescence probe displacement experiments showed that the introduction of ibuprofen minimally affected the fluorescence properties of the HSA-α-cembrenediol complex. In contrast, the addition of warfarin caused a redshift in the maximum emission wavelength and significantly quenched the fluorescence intensity. This indicates that α-cembrenediol and warfarin share the same binding site on HSA, namely, subdomain II A (Sudlow site I). The molecular docking simulation indicated that the lowest binding energies of α-cembrenediol to sites I and II on HSA were −6.4 and −4.5 kcal/mol, respectively, indicating a higher binding affinity of α-cembrenediol to site I, further confirming that α-cembrenediol binds to site I on HSA.
During the molecular dynamics simulation, the RMSD values of HSA and the HSA-α-cembrenediol complex gradually increased and reached equilibrium within the simulated time scale, indicating system stability. The overall RMSD value of the HSA-α-cembrenediol complex was lower than that of HSA alone, suggesting that the binding of α-cembrenediol made HSA more rigid and stable. Furthermore, analyses of the RMSF (root mean square fluctuation) and Rg (gyration radius) values confirmed the binding of α-cembrenediol to site I on HSA.
This study offers initial understanding of the interaction between α-cembrenediol and HSA, broadening our understanding of the in vivo transport system of α-cembrenediol based on serum albumin. It also provides necessary theoretical foundations for utilizing α-cembrenediol in the food, health products, and pharmaceutical industries.
Looking ahead, future research could focus on exploring the biological implications of the α-cembrenediol-HSA interaction in vivo, considering factors such as bioavailability, distribution, and metabolism. Further investigations could delve into the potential physiological impacts of this interaction on drug transport and delivery mechanisms within the body. Moreover, expanding the study to evaluate the effects of α-cembrenediol binding on other proteins or biomolecules may provide a more comprehensive understanding of its pharmacological properties and therapeutic potentials. Additionally, comparative studies with structurally related compounds or exploring the synergistic effects of coadministration with other drugs may offer new avenues for drug development and formulation.
In conclusion, the findings of this study establish a solid foundation for future research endeavors aimed at harnessing the therapeutic benefits of α-cembrenediol in diverse applications within the food, health products, and pharmaceutical industries. By further exploring the molecular intricacies and physiological relevance of the α-cembrenediol-HSA interaction, researchers can advance knowledge towards developing innovative strategies for drug design and delivery, ultimately benefiting human health and well-being.
Conflicts of Interest
The authors declare that they have no conflicts of interest.
Acknowledgments
This work was supported by the China Tobacco Guizhou Industrial Corporation Science and Technology Project (2021XM25) and the Science and Technology Plan Project of Guizhou Province (No. [2020]4102, Qiankehe Platform Talent). Their support was instrumental in the completion of this research.
Open Research
Data Availability
The data used in this study are available upon request from the corresponding author.


