First Principle Study of Structural, Electronic, Optical, and Thermodynamic Properties of Scandium-Doped Zirconia (Zr1−xScxO2, x = 0.125)
Abstract
The effect of scandium doping on the structural, electronic, optical, and thermodynamic properties of scandium-doped zirconia (Zr0.875Sc0.125 O1.9375) was investigated by first-principles calculations. The results of electronic property calculation show that the incorporation of scandium (Sc3+) in ZrO2 has reduced its bandgap due to the formation of scandium 3d states in the conduction band. The analysis of optical properties shows that scandium doping in ZrO2 improves the real (ε1) and imaginary dielectric functions (ε2), extinction coefficient (k), refractive index (n), reflectivity (R), and absorption coefficient (α) properties thereby enhancing its photocatalytic and optical activities. The heat capacities of ZrO2 and Sc-ZrO2 calculated at temperature of 800 K are 74.27 and 77.98 J/K/Nmol, respectively. The result of thermodynamic properties calculations show that doping scandium in zirconia enhances its entropy and specific heat capacity thereby allowing it to be thermodynamically stable for a wide range of electronic applications.
1. Introduction
The biological inertness, biocompatibility, and high impact toughness and strength of zirconia (ZrO2) make it a popular material for use in the production of medical equipment [1, 2]. The optical characteristics of single crystals based on zirconia have significant potential for application in the field of gate dielectrics, photonics, and micro- and nanoelectronics [3, 4]. Researchers were interested in ZrO2 because of its many uses in solid oxide fuel cells, thermal coatings, resistive switching devices, gas sensors, and medicine [5]. Zirconia is an indispensable element in active electro-optical devices, broadband interference filters, and high-refractive mirrors because of its remarkable optical properties, which include a high refractive index, a wide optical bandgap, low optical loss, and high transparency in the visible and near-infrared regions [6]. At room temperature, pure ZrO2 lacks a cubic fluorite structure [7, 8]. On the other hand, adding tri- or divalent ions to zirconia can stabilize its cubic fluorite structure and produce oxygen vacancies, which will increase the compound’s ionic conductivity [7, 9, 10].
Due to its sufficiently high ionic conductivity at high temperatures (1,000°C), yttrium stabilized zirconia (YSZ) is the most commonly used electrolyte for solid oxide fuels cell (SOFC) [11, 12]. Unfortunately, the ionic conductivity of YSZ is insufficient at operating temperatures of 500–600°C (intermediate temperature operation) [13]. In contrast, scandium-doped zirconia (Sc-ZrO2) is considered as the best material at intermediate temperatures (IT) because it has two orders of magnitude higher ionic conductivity than yttrium-doped zirconia [14, 15, 16, 17]. The ionic radii of Zr4+ is 0.84 Å, whereas the dopant ions are 0.87 Å for Sc3+ and 0.94 Å for Y3+, respectively. Sc3+ has nearer ionic radii to that of Zr4+, which reduces the steric-blocking effect during oxygen ion transport. Therefore, Sc-ZrO2 has higher ionic conductivity than YSZ as a result of small ionic radii difference between the host (Zr4+) and dopant ions (Y 3+, Sc3+) [10, 18, 19]. Scandium-doped zirconia achieves a stable cubic phase when the scandium concentration is x > 0.18 [7, 20, 21]. The substitution of scandium into zirconia increases its conductivity and decreases its high-temperature activation energy [22]. Moreover, doping scandium enhances the mechanical strength of zirconia [23]. The small difference in ionic radii of zirconium and scandium ions is the reason for the higher conductivity of scandium-stabilized zirconia [19, 24, 25, 26]. Further research is needed to explore the properties of scandium-doped zirconia for a wide range of applications in order to better understand the effect of this doping in zirconia. Therefore, the purpose of this work is to use first the principle density functional theory (DFT) to examine how scandium doping affects the structural, electronic, optical, and thermodynamic properties of ZrO2.
2. Computational Methods
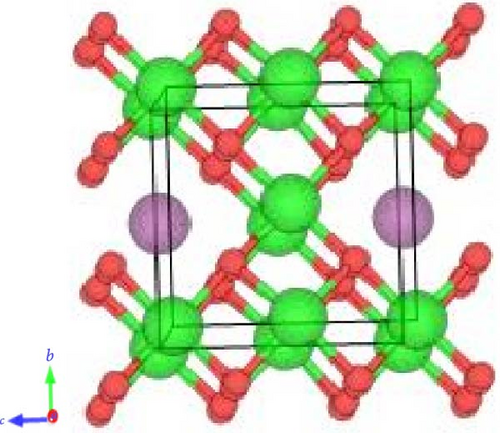
DFT, as implemented in open source Quantum Espresso software package within general gradient approximation function (GGA), was used to calculate the structural, electronic, optical, and thermodynamic properties of pure ZrO2 and Sc-ZrO2. First, a 2 × 2 × 2 supercell consisting of 32-zirconium atoms and 64 oxygen atoms was created using crystal maker. The doping process was performed using VESTA software to replace 4Zr 4+ atoms by 4Sc3+ atoms corresponding to a dopant concentration of 0.125 (12.5%). During the doping process, two oxygen atoms are removed, leaving two vacancies in their place to maintain stoichiometry and charge neutrality. This resulted in 28Zr, 4Sc, and 62O atoms constituting a total of 94 atoms and two oxygen vacancies in the simulation cell. The ultra-soft pseudopotentials were used to treat the interaction of the electrons with the ion cores, where Zr (4d, 5 s), O (2 s, 2p), and Sc (3d, 4 s) electrons were treated as valence states. To improve the precision of calculation, convergence of cutoff energy, k-point grid, and lattice parameter were employed separately for pure ZrO2 and Sc-ZrO2. Convergence testing of total minimum energy as a function of cutoff energy is performed with an increase of 5 Ry in the range of 30–100 Ry. In this calculation, energy threshold convergence of both compounds was achieved at 75 Ry. The convergence test for total minimum energy versus k-point sampling was employed from 2 × 2×2 to 10 × 10 × 10 and achieved at 6 × 6 × 6 k-point grid for both pure ZrO2 and Sc-ZrO2. The optimization of lattice parameter was performed for each compound keeping optimized cutoff energy and k-point. The optimized structural parameters of ZrO2 and Sc-ZrO2 were used for subsequent computations to investigate their electronic, optical, and thermodynamics properties.
3. Result and Discussions
3.1. Structural Optimization of Zirconia and Scandium-Doped Zirconia
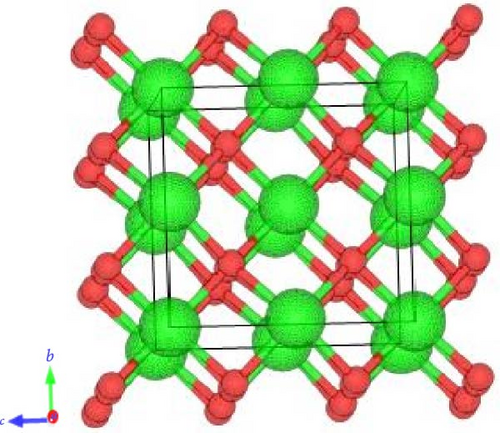
The crystal structure of pure ZrO2 and Sc-ZrO2 compounds is studied using DFT calculations. The unit cell of pure ZrO2 and Sc-ZrO2 was described in Figures 1(a) and 1(b), respectively.
In order to achieve the equilibrium structure, one has to calculate the lattice parameter that minimizes the DFT total energy.
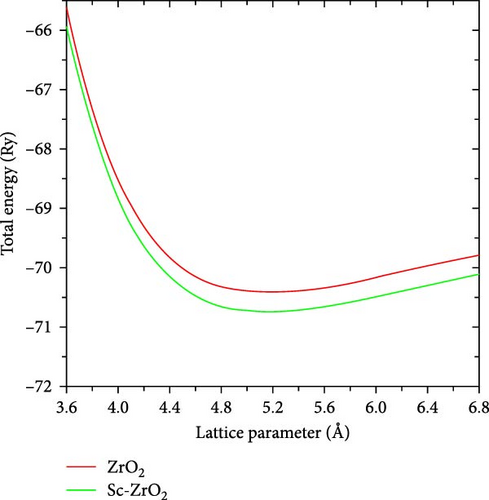
Figure 2 depicts the calculated lattice parameter of ZrO2 and Sc-ZrO2. The calculated lattice parameter that minimizes the DFT of total energy is achieved at 9.8 bohr (5.194 Å) for Sc-ZrO2 and 9.7 bohr (5.14 Å) for ZrO2 which is in better agreement with the experimental value of ZrO2 (5.135 Å) [27, 28]. Thus, the computational result indicates that doping Sc3+ raises the lattice parameter of zirconia (ZrO2), which in turn raises its volume.
3.2. Electronic Properties of Zirconia and Scandium-Doped Zirconia
3.2.1. Density of States
Figure 3 shows the electronic density of states (DoS) for ZrO2 and Sc-ZrO2, respectively. As can be seen in Figure 3, the upper valence band energy ranges from −7.27 to −1.82 eV are essentially dominated by O-2p states, with a minor presence of Zr-d states from the hybridization with O-2p for ZrO2. Furthermore, the result shows that the Zr-d valence band is partially occupied indicating a partial Zr–O covalent interaction. The unoccupied conduction band, which is separated from the valence band essentially dominated by Zr-d states for pure ZrO2.
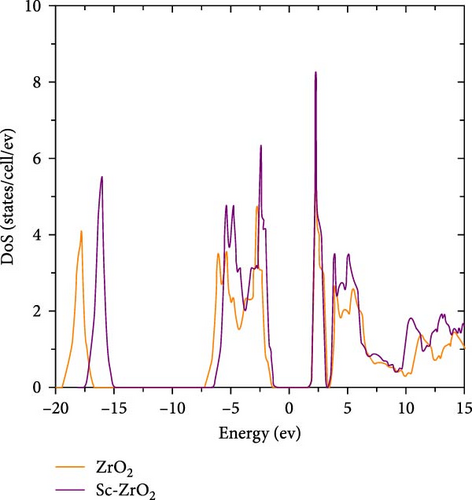
As depicted in Figure 3, the Sc-ZrO2 band located at the range −17.58 to −15.20 eV originates with Sc 2s states. The band at −6.42-0.−1.48 eV originates with the hybrid of Sc2p orbital, Zr4d and Zr4p orbitals. This state contributes to the formation of covalent bond between Sc, Zr, and oxygen. The lower unoccupied conduction band originates with hybrid Sc (3d) and Zr (4d) states. Figure 3 shows that introducing Sc3+ contents (12.5%) into ZrO2 reduced the width of bandgap between the conduction and valence bands.
3.2.2. Band Structure of Zirconia and Scandium-Doped Zirconia
The distance between a material’s valence and conduction bands is known as its optical bandgap. A material’s optical bandgap (Eg) is correlated with its absorption(α) [29].
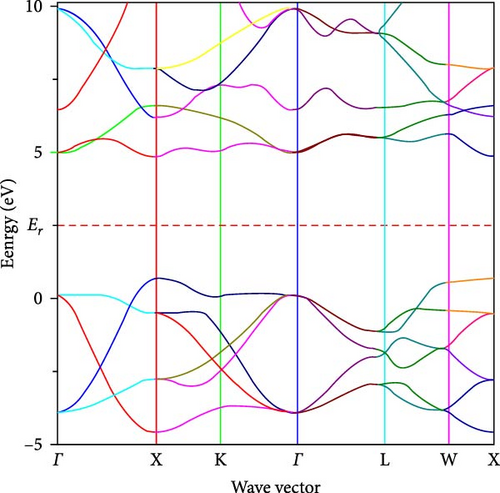
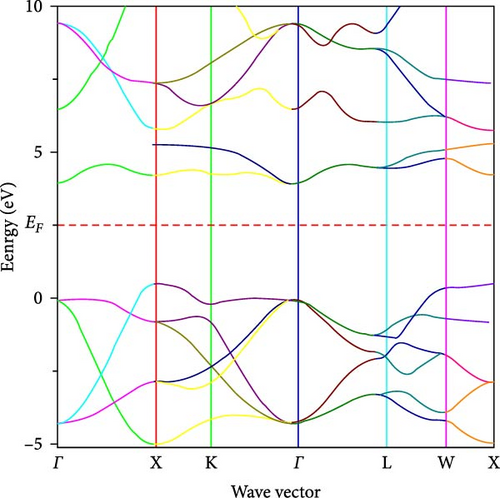
Figures 4(a) and 4(b), respectively, show the band structure of ZrO2 and Sc-ZrO2, which were calculated along the Brillion zone’s high symmetry direction. In this study, the calculated bandgap of Sc-ZrO2 and pure ZrO2 are 3.8 and 4.9 eV, respectively. This value is smaller than the experimental value reported for Sc-ZrO2 (3.8–5.25 eV) and ZrO2 (3.85–5.65 eV) [21]. Therefore, the incorporation of Sc3+ decreases the bandgap of ZrO2 due to increased Sc3d states in the conduction band which is the core reason for enhancing the photocatalytic and optical activities of scandium-doped zirconia (Sc-ZrO2).
3.3. Optical Properties of Zirconia and Scandium-Doped Zirconia
It is well-known that the strong light absorption is an indication of a high-efficiency photocatalyst. Moreover, it is known that the optical properties of compounds give useful information about their internal structure and can be described from the dielectric function that gives the linear response of an electronic system submitted to an applied external electric field [30]. The electronic response of a material toward an incident photon can be described from its complex dielectric function ε(ω) = ε1(ω) + iε2(ω). Generally, the real part ε1(ω) represents the phase lag between the incident field and induced field due to polarization and the imaginary part iε2(ω) represents the measure of energy loss [31].
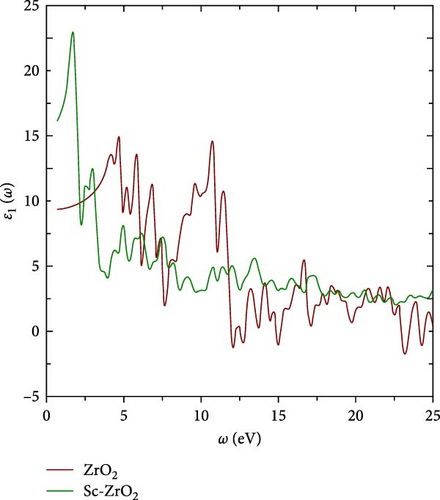
Figure 5 illustrates how the real part of the dielectric function ε1 (ω), which describes the material’s electronic polarization, varies with incident photon energy up to 25 eV. The first peak observed (23.22) is at 1.759 eV for Sc-ZrO2 and 15.04 at 4.69 eV for ZrO2 corresponding to the experimental value 3.9 eV. The second peak 12.68 is at 2.98 eV for Sc-ZrO2 and 12.16 at 5.67 eV for ZrO2. As shown in Figure 5, the static dielectric constant around zero frequency limit ε1(0) is 16.25 for Sc-ZrO2 and 9.348 for ZrO2, respectively. The real part of the dielectric function decreases with increasing frequency for both Sc-ZrO2 and ZrO2. It also reaches negative value for ZrO2, which is a characteristic of instability. On the other hand, the real dielectric function of Sc-ZrO2 is positive confirming scandium doping in zirconia stabilizes its structure.
The imaginary part of the frequency-dependent dielectric function ε2 (ω) gives the information about the absorption properties of compounds. Figure 6 shows the imaginary part of the dielectric function of zirconia (ZrO2) and scandium-doped zirconia (Sc-ZrO2). As shown in Figure 6, the first imaginary dielectric function peak of Sc-ZrO2 is 17.24 at 2.004 eV and 10.73 at 5.95 eV for ZrO2. The second peaks are 10.8 at 2.249 eV for Sc-ZrO2 and 17.72 at 11.79 eV for ZrO2, respectively.
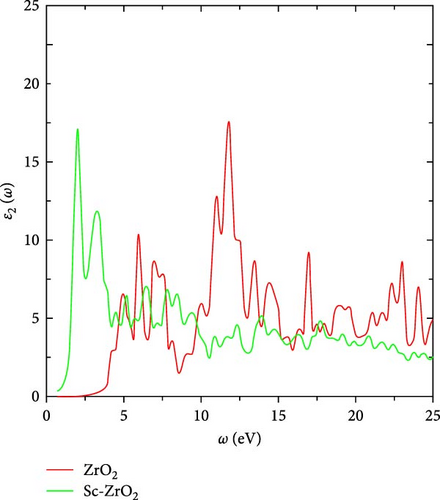
Among them, peaks 1 and 2 mainly originate from the electronic intraband transition of impurity Sc 3d states and Zr 4d states in the conduction band, where the shift of the position corresponds to the localized degree of the scandium band.
The incorporation of scandium atom causes a slight shift in the energy band, which also causes peak 1 to shift toward lower energy. That is, the absorption edge of the imaginary part of the dielectric function of Sc-ZrO2 is red-shifted compared to ZrO2. This corresponds with the preceding calculation, which confirmed that the bandgap become narrower after doping ZrO2 with scandium. Table 1 presents the real and imaginary dielectric functions of ZrO2 and Sc-ZrO2.
| Compound | ε1 | ε2 | ||||||
|---|---|---|---|---|---|---|---|---|
| Peak 1 | Energy (eV) | Peak 2 | Energy (eV) | Peak 1 | Energy (eV) | Peak 2 | Energy (eV) | |
| ZrO2 | 15.04 | 4.69 | 12.16 | 5.67 | 10.73 | 5.95 | 17.72 | 11.79 |
| Sc-ZrO2 | 23.22 | 1.759 | 12.68 | 2.98 | 17.24 | 2.00 | 10.8 | 2.24 |
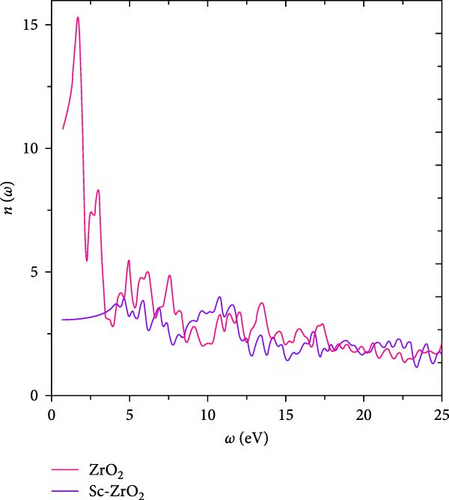
The optical properties explained by real and imaginary dielectric functions can also be described by the refractive index n (ω) and the extinction coefficient k (ω) [30]. Figure 7 shows the calculated value of n (ω) of each ZrO2 and Sc-ZrO2. Relating Figures 5 and 7, the refractive index n (ω) of both Sc-ZrO2 and ZrO2 have nearly identical characteristics with their respective real dielectric function ε1 (ω). As can be seen in Figure 7, the largest refractive index peak is 15.48 at 1.759 eV for Sc-ZrO2 and 4.01 at 10.81 eV for ZrO2. The refractive index of Sc-ZrO2 and ZrO2 at about zero frequency limit n (0) are 10.83 and 3.05, respectively. In this study, the zero frequency refractive index (n = 3.05) of ZrO2 calculated is higher than previously reported result(n = 2.15) [33]. As shown in Figure 7, the refractive index of both Sc-ZrO2 and ZrO2 decreases as frequency or energy increases. The peaks in ε1 (ω) and n (ω) are due to the interband electronic transitions.
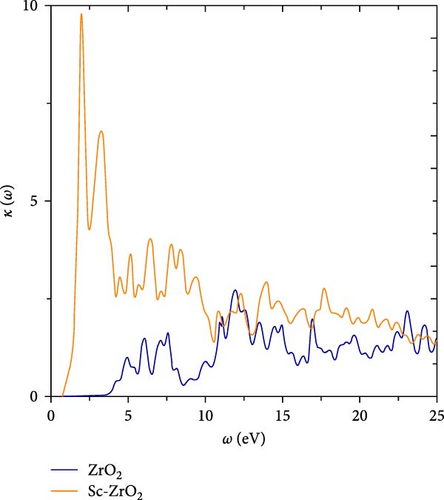
The calculated value of the extinction coefficient k (ω) provides information about the fraction of light lost due to scattering and absorption per unit distance of the participating medium.
Figure 8 displays the reflectivity and loss function of ZrO2 and Sc-ZrO2 compounds in the energy range of 0–25 eV. Correlating Figures 6 and 8, the extinction coefficient k (ω) has almost the same characteristics as the corresponding ε2 (ω). The frequency-dependent k (ω) of ZrO2 and Sc-ZrO2 increases with frequency at low-frequency region and reaches a maximum absorption in the medium at 9.85 at 2.00 eV for Sc-ZrO2 and 2.64 at 12.03 eV for ZrO2, respectively. As a conclusion, doping scandium in zirconia leads to rapid absorption of photons.
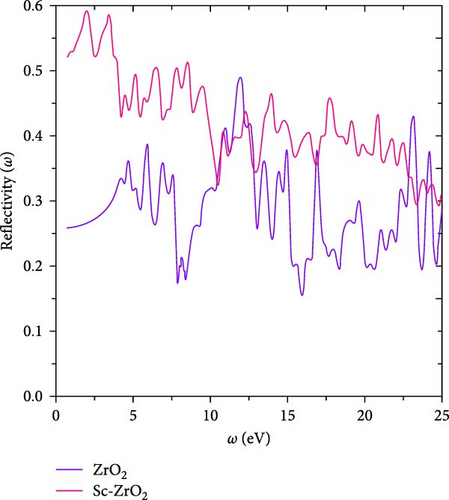
In this study, to investigate the surface behavior of ZrO2 and Sc-ZrO2, its reflectivity, which is the ratio of incident light intensity to reflected light intensity, is also calculated using generalized gradient approximation.
Figure 9 depicts the reflectivity R (ω) versus energy of ZrO2 and Sc-ZrO2. As can be seen in Figure 9, the value of reflectivity of Sc-ZrO2 is 0.594 at 2.0 and 0.41 at 11.05 eV for ZrO2. In addition, the reflectivity of Sc-ZrO2 decreases with increasing frequency. This means it shows a good transparency and absorption in the visible range of electromagnetic waves. The reflectivity plot in Figure 9 shows that doping scandium in zirconia leads to a decrease in reflectivity as frequency increases.
It is well-known that the strong light absorption is an indication of highly efficient photocatalyst. Figure 10 shows the calculated absorption coefficients as function of frequency for pure ZrO2 and Sc-ZrO2 compounds. The maximum peaks of the absorption coefficient for Sc-ZrO2 and pure ZrO2 calculated by the general gradient approximations were obtained at around 17.66 and 23.04 eV, respectively. It is evident in Figure 10 that pure ZrO2 and Sc-ZrO2 spectrum shows a good absorption characteristics for the incident photons in the ultraviolet part of the solar irradiation, while a small component appears in the visible region. However, the absorption intensity amplitude is greater for Sc-ZrO2 than pure ZrO2. The correlation between the two variables shows that higher absorbance is correlated with lower reflectance or vice versa [34]. Therefore, doping scandium into zirconia enhanced the absorption and lowers the reflectivity of solar radiation.
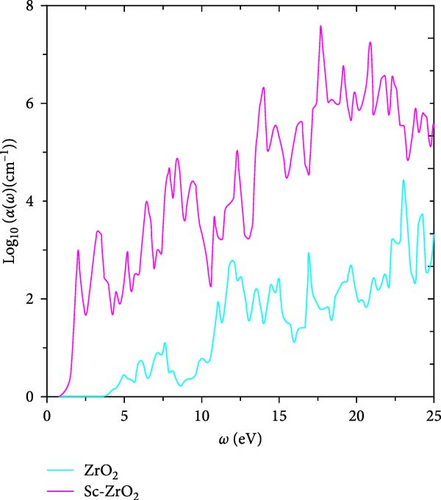
The incorporation of scandium into the zirconia lattice leads to the formation of new energy levels in the conduction band (Sc-3d). This in turn causes a red shift of the spectra, improving the photocatalytic performance of the studied systems. Additionally, scandium-doped zirconia exhibits a good transparency in the visible range nominating this material for the optical applications. Furthermore, the absorption curve of Sc-ZrO2 displays relatively larger absorption values than ZrO2, indicating a good performance for solar cell applications [35].
This study demonstrated that the density functional calculation output indicated that scandium-doped zirconia had an increased refractive index and reduced extinction coefficients in a wide range of frequencies, indicating improved optical transparency [17]. Additionally, it was found that scandium-doped zirconium nanoparticles had enhanced photoluminescent properties, potentially making them suitable for optical sensing applications [36]. Overall, scandium doping has been demonstrated to enhance zirconia’s optical properties, making it a potential material for a variety of optical applications.
3.4. Thermodynamic Properties
The thermodynamic properties of compounds play a major role in their ability to be used in electronic applications. This section examined the thermodynamic properties of the compounds, including internal energy (E), Helmholtz free energy (F), entropy (S), and constant volume-specific heat capacity (Cv) as a function of temperature (T) using a generalized gradient approximation (GGA).
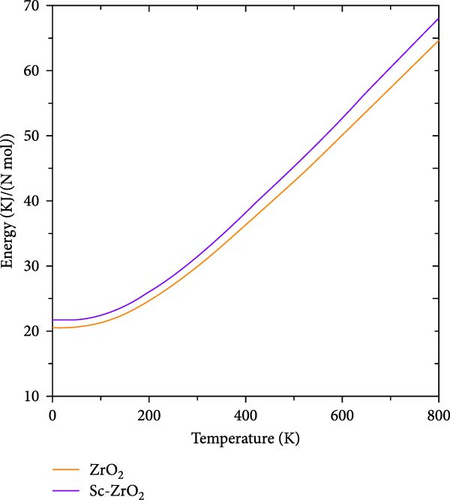
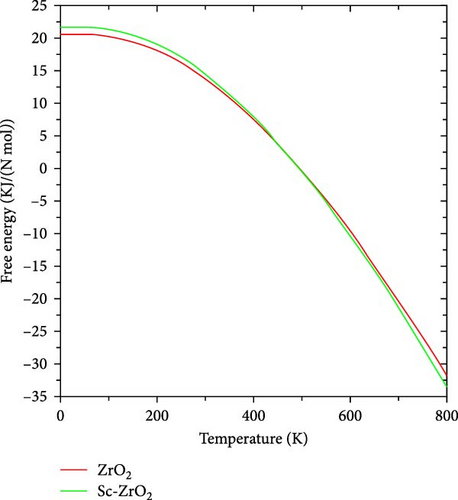
Figures 11 and 12, respectively, show the temperature dependence of the internal energy and Helmholtz free energy of pure ZrO2 and Sc-ZrO2. It is observed that the internal energy of these compounds increases with increase in temperature. However, the Helmholtz free energy of the compounds decreases with increasing temperature. At zero temperature (0 K), the calculated value of internal energy and Helmholtz free energy of ZrO2 and Sc-ZrO2 is 20.57 and 21.64 kJ/Nmol, respectively. The value of Helmholtz free energy and internal energy of both compounds is different from zero at a temperature of 0 K due to the presence of phonon oscillations. This indicates that doping scandium in zirconia enhanced the internal energy and Helmholtz free energy at temperature of zero (0 K). In addition, doping of scandium enhances both enthalpy and entropy of zirconia, as well as the stabilization of its cubic phase [37].
The heat capacity, entropy, free energy, and internal energy of pure ZrO2 and Sc-ZrO2 were measured at temperature range of 0–800 K. Figure 13 indicates the entropy of pure ZrO2 and Sc-ZrO2 as a function of temperature. The entropy of both ZrO2 and Sc-ZrO2 gradually increases with temperature due to increase in the oscillation of phonons. It is observed in Figure 13, the entropy of Sc-ZrO2 increases faster than that of pure ZrO2 with temperature. Therefore, doping ZrO2 with Sc3+ enhances its entropy and facilitates the stabilization of cubic phase by increasing its volume which is in agreement with the literature [37].
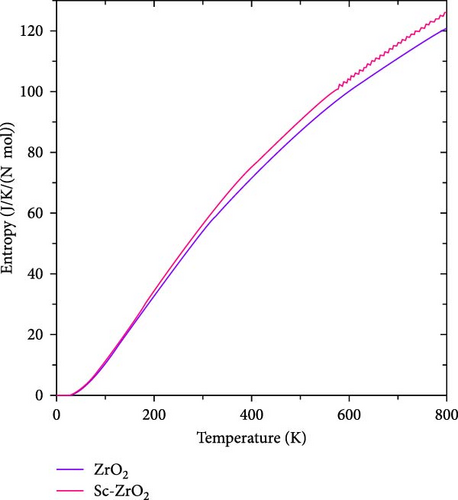
Figure 14 shows the temperature dependence of specific heat capacity of pure ZrO2 and Sc-ZrO2 at constant volume, which was calculated using the first principle investigation. As shown in Figure 14, heat capacity (Cv) values of pure ZrO2 and Sc-ZrO2 increase with the temperature until they reache a temperature limit (TD) where it reaches a constant level following the Dulong–Petit law, and then it remains nearly constant with further increase in the temperature [38].
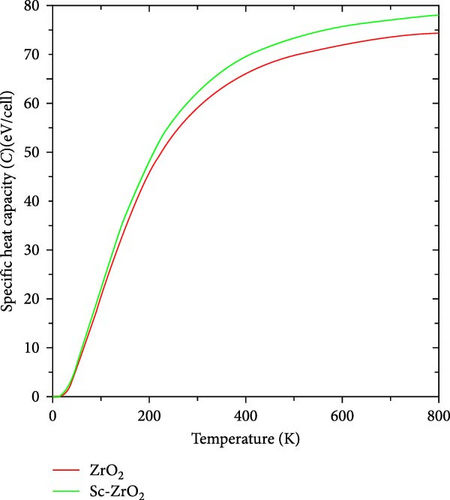
In this study, constant volume-specific heat capacity of ZrO2 and Sc-ZrO2 computed at a temperature of 800 K is 74.27 and 77.98 J/K/(N mol), respectively. As depicted in Figure 14, the doping of scandium into zirconia increased the heat capacity. The constant volume-specific heat capacity of ZrO2 is consistent with the previous reported value (60 J/K/(N mol)) [39].
The overall conclusion of the thermodynamic properties calculation is that the addition of scandium to zirconia increases the entropy and the constant volume-specific heat capacity, thus contributing to its thermodynamic stability for various electronic applications. The thermodynamic properties of Sc-ZrO2 are not compared with experimental values due to the unavailability of literatures.
4. Conclusion
First-principle calculations were employed in order to investigate the effects of scandium doping on the structural stability, electronic characteristics, optical properties, and thermodynamic properties of zirconia. The results of DFT calculations indicated that scandium-doping improved the structural stability of zirconia due to its optimal ionic radii of scandium with zirconia. The electronic analysis shows that doping scandium into zirconia results in a narrower bandgap. The examination of optical characteristics reveals that the addition of scandium doping to ZrO2 enhances its photocatalytic and optical activities by improving its real (ε1) and imaginary dielectric functions (ε2), extinction coefficient (k), refractive index (n), reflectivity (R), and absorption coefficient (α). Calculations of thermodynamic properties reveal that doping zirconia with scandium increases its specific heat capacity and entropy, making it thermodynamically stable for a variety of electronic applications.
Conflicts of Interest
The authors declare that they have no conflicts of interest.
Open Research
Data Availability
All the required data are included in the manuscript.


