Structural, Optical, Electrical, and Magnetic Characterization of PC/PEO Blend Incorporated with ZnFe2O4 Nanoparticles
Abstract
In this study, zinc ferrite nanoparticles (ZnFe2O4 NPs) were incorporated into a polycarbonate/polyethylene oxide (PC/PEO) blend using the casting method. The resulting blends were subjected to comprehensive analysis using various techniques. X-ray diffraction (XRD) analysis revealed that the presence of ZnFe2O4 nanoparticles had a significant impact on the crystal structure of the PC/PEO blend, leading to a reduction in crystallinity. Fourier-transform infrared (FT-IR) measurements further confirmed the uniform distribution and compatibility of PC and PEO as polymer components, as well as their compatibility with the blend containing ZnFe2O4 NPs. The optical properties of the PC/PEO blend, including band gap and Urbach energy, were quantified using the Kubelka–Munk method. The incorporation of ZnFe2O4 NPs resulted in the formation of sub-band states between the valence and conduction bands, leading to a decrease in the band gap values. Field emission scanning electron microscopy (FESEM) analysis revealed a noticeable modification in the surface roughness, with the addition of ZnFe2O4 NPs resulting in a smoother surface texture. The electrical properties of the blends, including dielectric constant, dielectric loss, and AC conductivity, were measured. The addition of ZnFe2O4 NPs increased the dielectric constant (ε′) at lower frequencies, while it remained relatively stable at higher frequencies due to the localized charge carriers within the polymer blend. The higher values of ε’ observed at lower frequencies can be attributed to the movement of ions, which contributes to enhanced ionic conductivity. The magnetic properties of the blends were evaluated, demonstrating an increase in magnetic saturation upon the addition of ZnFe2O4 NPs. These findings provide valuable insights into the structural, optical, electrical, and magnetic characteristics of PC/PEO blends incorporated with ZnFe2O4 nanoparticles, thereby highlighting their potential for a wide range of technological applications.
1. Introduction
Blending polymers has garnered much interest as a simple and inexpensive way to create polymeric compounds with broad potential in the industry. So, the blend’s qualities can be tailored to the application by carefully selecting the polymers that go into it [1, 2]. The research, development, and eventual market introduction of a new polymer typically take significant time and are accompanied by substantial financial investment. However, suppose a polymer blending process is used, which is also very inexpensive to run. In that case, it is frequently possible to shorten the time necessary to reach the commercialization stage to somewhere between 2 and 3 years [3]. The creation of polymer blends accounted for 50% of all plastics manufactured in 2010, marking a significant step toward eliminating conventional polymers. Research has indicated that polycarbonate (PC) could serve as an alternate polymer matrix for solid polymer electrolytes (SPEs). PC has a high degree of salt solubility because of the strongly polar nature of the usual carbonate group (O─(C═O)─O) [4, 5]. PC is signed as an amorphous polymer with remarkable qualities like high impact strength, transparency, exceptional optical properties, and dimensional stability [6]. Its properties make it ideal for use in electronic devices, optical lenses, and biomedical equipment [7, 8]. Adding functional groups to reactive sites or mixing with other polymers is a common practice for improving PC characteristics [9]. Morsi et al. [10] and Al-Muntaser et al. [11] were fabricated via a solution casting methodology, wherein varying concentrations of nanoparticles were incorporated into a polymeric matrix comprising a blend of polyethylene oxide, with other polymers. X-ray, optical, and AC electrical conductivity were investigated. The prepared nanocomposites are suitable for flexible optoelectronic devices and energy storage applications.
Polyethylene oxide (PEO) has been the primary choice as a foundational material for solid polymers [12]. Its prevalence in the literature has left little room for alternatives. Pioneering research by Armand et al. [13] showcased the potential of PEO as an ion-conductive material, leading to its widespread adoption in battery applications. Recent efforts have focused on developing novel SPE materials that offer improved performance for polymer batteries [14]. It is important to note that pure PEO is a semicrystalline structure that exhibits a combination of the crystalline and amorphous phases [15]. Better ionic conduction results from a decrease in the polymer chains’ crystallinity, which increases their mobility. As a result, amorphous-rich PEO-based electrolytes are thought to rely mostly on ions hopping [16]. The simplest solution is to reduce the crystallinity of the PEO matrix.
A relatively tiny quantity of nanofiller is required to bring about significant change in the way that polymer matrices behave physically. Research into various nanofiller(s) polymer nanocomposites is still ongoing and is being kept up to date [17]. Compared to their bulk counterparts, ferrites with dimensions on the nanoscale exhibit fascinating and unexpected results. With the development of nanotechnology comes many new applications for ferrites, which are expanding at a dizzying rate. In recent years, researchers in material science have been devoting a growing amount of attention to the study of nanostructured zinc ferrite (ZnFe2O4). Because of its magnetic properties, chemical stability, and greater surface area, ZnFe2O4 has garnered much attention in recent years. ZnFe2O4 is a prominent member of the spinel ferrite family, possessing a cubic crystal structure with zinc and iron cations occupying tetrahedral and octahedral sites, respectively, within a close-packed arrangement of oxide anions. This inorganic compound exhibits unique properties that render it attractive for a myriad of applications. Notably, ZnFe2O4 exhibits substantial magnetocrystalline anisotropy, resulting in hard magnetic behavior and moderately high coercivity values. Consequently, it finds utility in magnetic recording media, ferrofluids, and microwave absorbers. Moreover, ZnFe2O4 displays semiconductor characteristics with a wide band gap in the range of 1.9–2.1 eV, facilitating its exploitation in photocatalysis, gas sensing, and optoelectronic devices. The dielectric data obtained for PVC/PVP/ZnFe2O4 copolymers revealed a decrease in the dielectric constant values of the composite with increasing amounts of ZnFe2O4. Moreover, the DC conductivity values showed a decrease as the resistance of the ZnFe2O4 polymer composite increased with higher zinc ferrite contents, reaching 15.0 wt.% [18]. To our knowledge, it appears to us that there is no research on PC/PEO combined with ZnFe2O4 NPs for use in dielectric and magnetic fields. The novelty of incorporating ZnFe2O4 nanoparticles into a PC/PEO blend lies in exploring the resulting composite’s structural, optical, electrical, and magnetic properties. This combination of materials has not been extensively studied before, and the present study offers valuable insights into its behavior and potential applications.
This article aims to incorporate and investigate ZnFe2O4 in a PC/PEO polymer blend. Study the structural, optical, electrical, and magnetic properties of the PC/PEO-ZnFe2O4 polymer nanocomposite samples in detail. Optimum is the best ratio of ZnFe2O4 evaluated for use in electronic devices.
2. Experimental Work
2.1. Materials
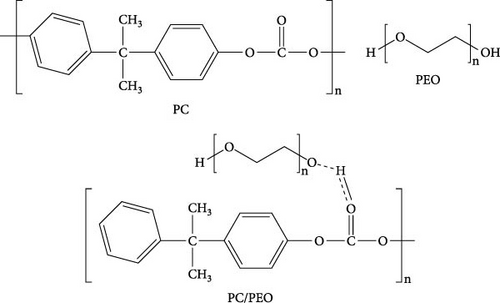
Polycarbonate (PC) pellets (2.7 × 10⁴ g/mol) were acquired from Shanghai Chemical Co., China, and polyethylene oxide (PEO, 600,000 g/mol) was purchased from Aldrich. Zn (NO3)2··6H2O was supplied from Sigma–Aldrich, USA. Fe (NO3)3··9H2O was obtained from Loba Chemie PVT with an average molecular weight of 404.0 g/mol. The ammonium hydroxide solution NH4OH, manufactured by AbcoChemie in England, had a grade between 28 and 30% NH3 analytical research (AR). Figure 1 shows the chemical structure of pure PC, PEO, and PC/PEO polymer blend.
2.2. Preparation of Zinc Ferrite Nanoparticles
Zn (NO3)2·6H2O and Fe (NO3)3·9H2O with a molar ratio of 1 : 2 were added to 75 mL of ethylene glycol under continuous stirring until solubility. NH4OH solution was added until pH reached 12. The mixture was placed in an autoclave and baked in an oven for 3 days at 200°C to get ZnFe2O4 nanoparticles. It took numerous washes with ethanol and distilled water to remove all traces and then drying at 80°C.
2.3. Preparation of PC/PEO/ZnFe2O4 Nanocomposites
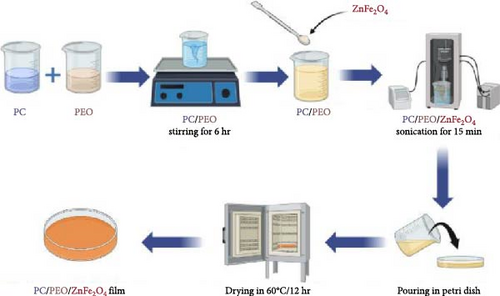
An equal mass ratio (50/50 wt.%) of PC:PEO blended by first dissolving each polymer separately in DMF under stirring at 60°C until complete solubility. Second, the two polymer solutions are combined with vigorous stirring at 60°C for 6 hr until a uniform homogenous solution is reached. ZnFe2O4 nanoparticles were added to the polymer mix solution in 10, 20, 30, and 40 wt.%. The solution was sonicated for homogeneity and uniformity. The solution was then poured into Petri dishes and put in a vacuum oven at 60°C for 12 hr until all solvents had evaporated (see Scheme 1), which was drawn with the aid of the biorender.com site. The thickness (≈200 µm) of the samples was measured by a digital thickness tester.
2.4. Measurements Techniques
X-ray diffraction was acquired by a PANalytical X’Pert Pro diffractometer in reflection mode with Cu–K radiation, covering the 2θ range from 5° to 60°. The nanocomposite films were comparatively assessed using a Fourier transform infrared (FT-IR) mode on a Bruker Vertex 80 instrument with a resolution of the FT-IR is 4 cm−1. UV-Vis spectral data were collected at room temperature employing a Jasco V-630 spectrophotometer, covering the wavelength range of 200–1,000 nm. To determine the size of ZnFe2O4 nanoparticles, a high-resolution transmission electron microscope (HR-TEM) with a JEM-2100F electron microscope operating at 200 kV was utilized. For investigating the morphology of the specimens and conducting energy-dispersive X-ray spectroscopy (EDX), a FE-SEM (Quanta 250 FEG) was employed. From the FE-SEM photographs of each sample, three-dimensional micrographs and roughness characteristics were retrieved using the Gwyddion program. The broadband dielectric spectroscopic measurements were performed using a high-resolution Novocontrol Alpha-A Analyzer operating at frequencies of 10−1 and 106 Hz. A vibrating sample magnetometer (VSM) series was utilized (Lake Shore VSM 7410).
3. Results and Discussion
3.1. X-Ray Diffraction Study
Figure 2 represents the X-ray diffraction of ZnFe2O4 NPs. As observed, there are diffraction peaks at 2θ = 18.3°, 29.8°, 35.2°, 42.8°, and 56.6°, which correspond to (111), (220), (311), (400), and (511) lattice planes, respectively, according to card no. 00-001-1108.
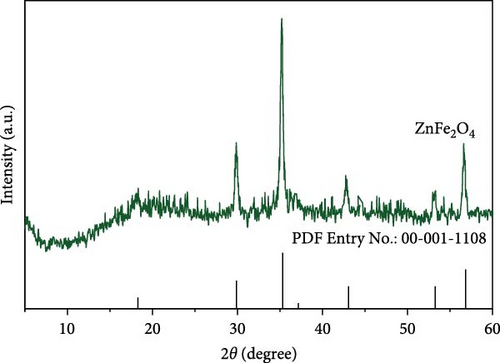
Figure 3 investigates the XRD of PC, PEO, PC/PEO, and PC/PEO incorporated with ZnFe2O4 NPs. PC has two amorphous peaks at 2θ = 9.8° and 19.4° [20, 21], while PEO has two main sharp crystalline peaks at 2θ = 19.1° and 23.3° and other small diffraction peaks at 2θ = 26.2°, 26.9°, 35.1°, 36.1°, and 39.6° [22, 23]. For PC/PEO, it is noticed that after blending, the diffraction peak at 2θ = 9.8° of PC disappeared, and there is a shift in the diffraction peak at 2θ = 19.4° toward the lower two-theta degree. Also, the broadening at 2θ = 23.3° is increased after blending. This affirmed the interaction and complexation between the functional group of PC and PEO.
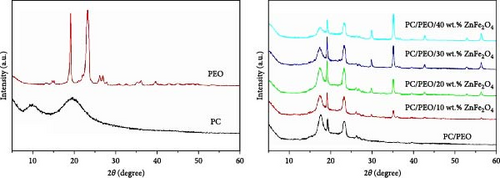
The incorporation of ZnFe2O4 NPs into PC/PEO is confirmed by a diffraction pattern at 2θ = 29.8°, 35.1°, 42.6°, 52.9°, and 56.5°, which is assigned to ZnFe2O4 NPs. It is seen that the intensities of the diffraction peaks of PC/PEO decrease and the broadening increases with the addition of ZnFe2O4 NPs. These results proved that adding ZnFe2O4 NPs changes the PC/PEO blend’s crystal structure, decreasing its crystalline nature and confirming the interaction between PC/PEO and ZnFe2O4 NPs.
3.2. FT-IR Study
Fourier transform infrared (FT-IR) spectra of PC/PEO blend, and PC/PEO incorporated with varying mass ratios of ZnFe2O4 NPs are presented in Figure 4. For PC, the bands from 3,081 to 2,851 cm−1 correspond to C─H aromatic ring deformation. The carbonate group (C═O) stretching vibration appears at 1,764 cm−1. Stretching of the C─C bond originating from the phenyl group (benzene ring) manifests at 1,675 and 1,603 cm−1. The bands at 1,503 and 1,451 cm−1 represent C ═ C stretching vibration. Between 1,160 and 1,226 cm−1, the ester group (O─C─O) exhibits stretching vibrations. Vibration of the CH3 group presents at 1,077 cm−1, while symmetric O─C─O group deformations occur near 1,011 cm−1. Significant infrared absorptions of PC arise from C─O single bond lengths, extending below 1,000 cm−1 [24, 25, 26, 27].
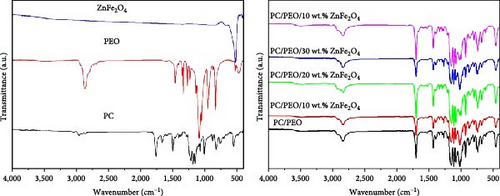
The spectrum of pure PEO shows a band at 2,879 cm−1, associated with CH2 stretching vibration. CH2 bending vibration appears at 1,465, 1,413, 1,359, 1,279, and 1,244 cm−1. Stretching vibration of the C─O─C band manifests at 1,144, 1,094, and 1,059 cm−1. The 960 cm−1 band corresponds to the C─O bond stretching vibration. CH2 rocking vibration occurs at 841 cm−1 [28].
For ZnFe2O4 NPs, the bands at 528 and 413 cm−1 represent stretching vibration of the Zn─O bond in tetrahedral (A) and octahedral (B) sites, respectively. The 684 cm−1 band corresponds to Fe─O bond stretching vibration [29]. In the PC/PEO blend, band shifts appear at 2,879, 1,226, 1,187, and 1,160 cm−1. Bands at 1,675 and 1,279 cm−1 disappear. All band intensities change upon blending, confirming strong interaction between PC and PEO via inter—and/or intramolecular bonding between functional groups. For PC/PEO/ZnFe2O4 NPs, the 1,095 cm−1 band disappears, and all blend-related band intensities change, indicating the embedding of ZnFe2O4 NPs within the PC/PEO blend and interaction between the filler and blend components. The incorporation of ZnFe2O4 NPs into the PC/PEO polymeric matrices leads to the formation of interfacial interactions, primarily in the form of Van der Waals forces (physical bonds)), between the polymeric chains and the surface of the ZnFe2O4 NPs. These weak intermolecular forces contribute to the physical adhesion and compatibility of the two components. Additionally, dipole–dipole interactions play a role in the interfacial interactions.
3.3. Optical Properties
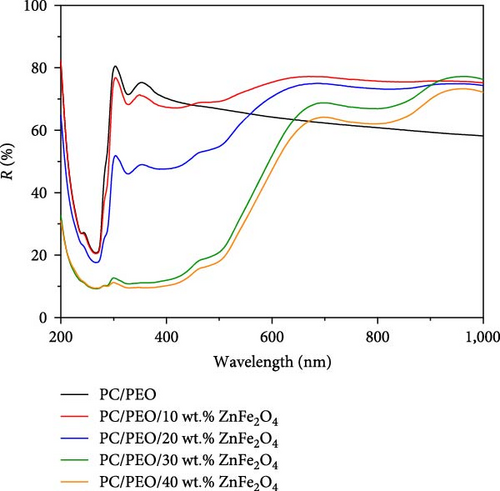
Figure 5 represents the optical reflection spectra of PC/PEO and PC/PEO incorporated with the different mass ratios of ZnFe2O4 NPs. Reflectance drops dramatically in the ultraviolet range from roughly 265–300 nm, then increases up to 300 nm, including the peak of PC/PEO and PC/PEO/ ZnFe2O4 NPs. This pattern can be seen in every composite film. As observed, with increasing concentrations of ZnFe2O4 NPs, PC/PEO film has the lowest reflectance in the visible area (600–1,000 nm). Surface roughness caused by the incorporation of nanoparticles is responsible for the enhanced reflectivity in the visible range observed in nanocomposites [30].
The band gap energy is determined by plotting ((F (R) hυ)1/2 versus photon energy hυ as seen in Figure 6. As observed in Figure 6, the band gap energy can be approximated by extrapolating the straight line of the curve until it meets up with zero on the h-axis. The band gap energy value decreases from 4.25 eV for pure PC/PEO pure blend to 2.97 eV for 40 wt.% of ZnFe2O4 NPs in the polymeric matrices.
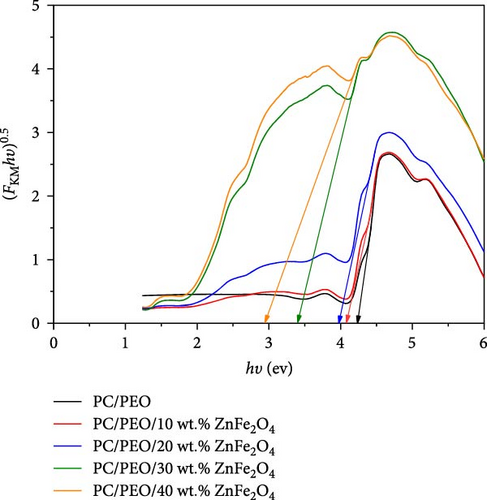
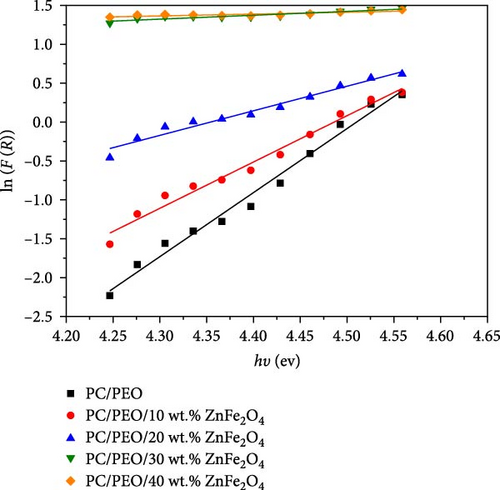
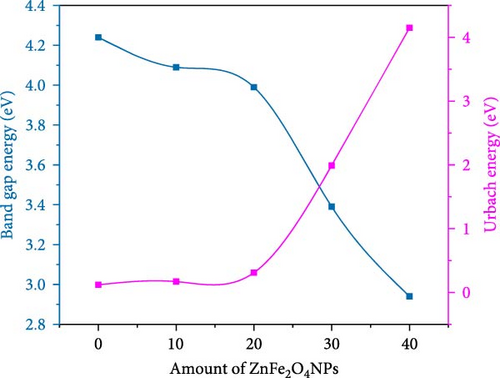
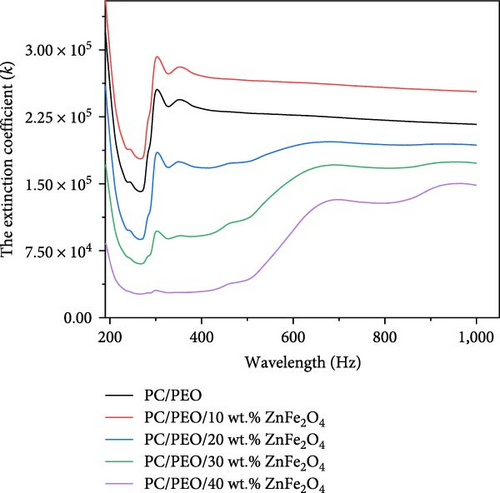
Figure 9 displays the relationship between the extinction coefficient (k) and wavelength (λ). It shows that K values have increased as the ZnFe2O4 NPs nanoparticles have increased.
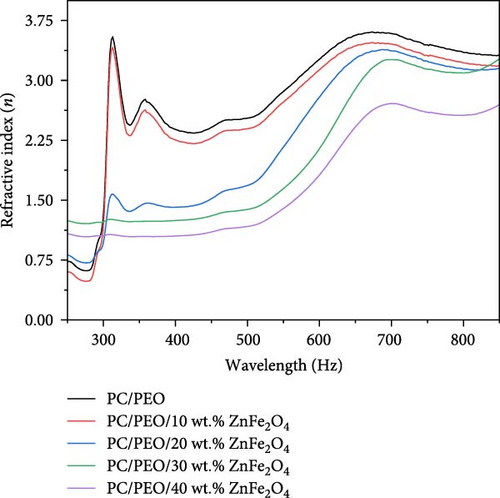
The plot of refractive index (n) as a function of wavelength (λ) is shown in Figure 10. The behavior of the PC/PEO polymer and PC/PEO. ZnFe2O4 NPs increase as an increase of λ and by an increase of adding of λ.
3.4. TEM Morphology
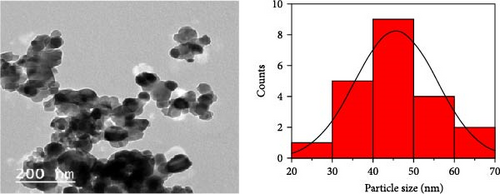
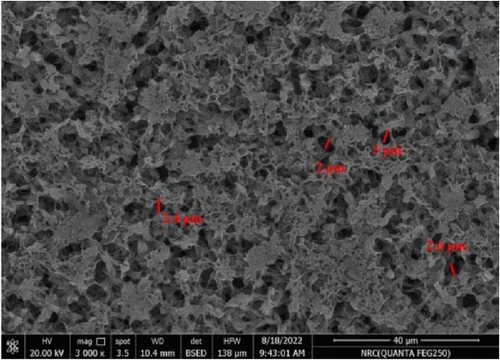
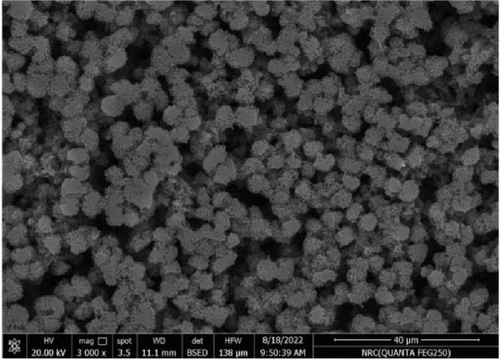
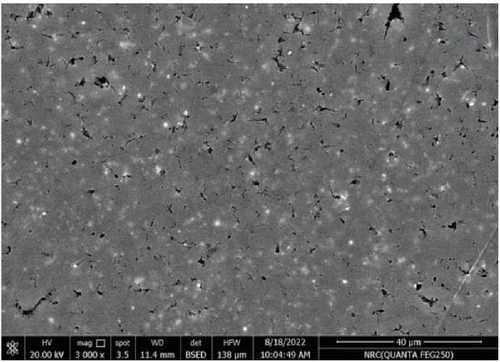
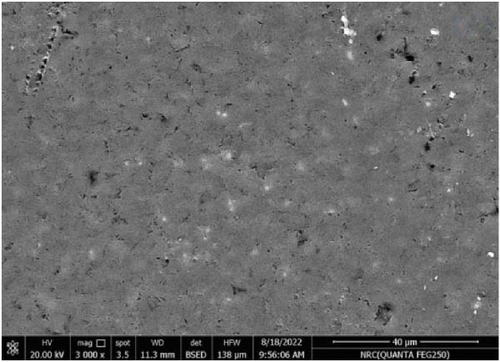
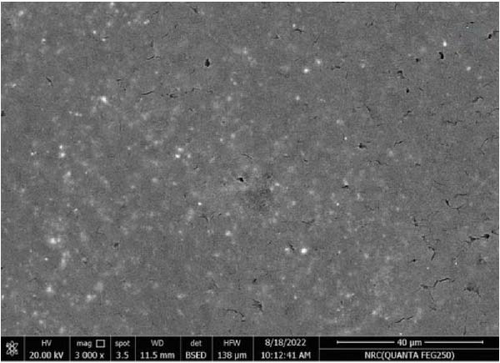
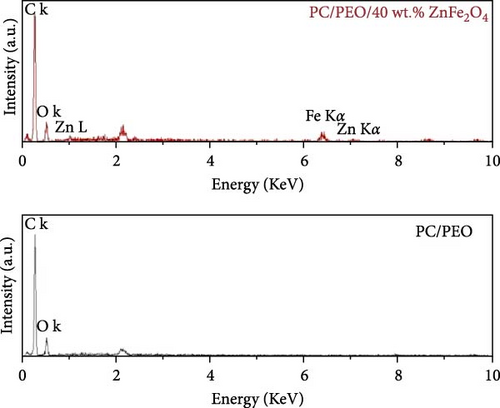
Figure 11 represents the HR-TEM and the histogram of ZnFe2O4 NPs. Pure ZnFe2O4 NPs have a semispherical shape with average particle size ranges from 20 to 70 nm. Figures 12(a), 12(b), 12(c), 12(d), and 12(e) represents the FE-SEM of PC/PEO and PC/PEO incorporated with the different mass ratios of ZnFe2O4 NPs. Figure 12(a) shows that PC/PEO has multiple irregular pore structures created on the surface of the blend with an average pore size of 2-3 μm. This pore structure facility incorporates the filler inside it and changes the surface characteristic of the PC/PEO blend. As shown in Figures 12(b), 12(c), 12(d), and 12(e), ZnFe2O4 NPs blocked the pores inside the PC/PEO matrix, and the surface roughness decreased, which confirmed the interaction between the PC/PEO mixture and ZnFe2O4 NPs. The EDX analysis in Figure 12(f) confirmed the presence of ZnFe2O4 NPs according to the element in the EDX analysis.
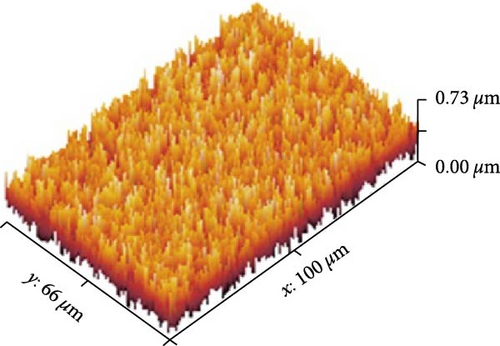
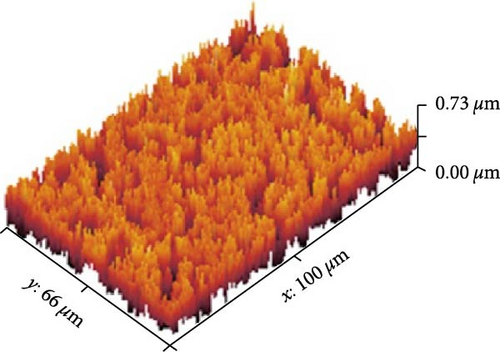
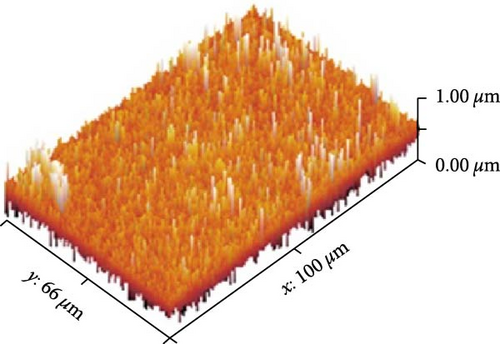
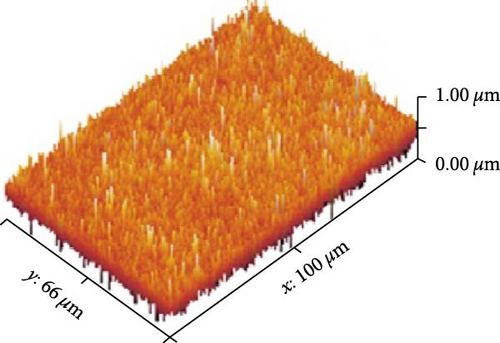
Figures 13(a), 13(b), and 13(c) represents the 3D images of PC/PEO embedded with the different mass ratios of ZnFe2O4 NPs. As seen from Table 1, the surface roughness parameters were decreased, which means that ZnFe2O4 NPs enhance surface smoothing, which can be used in electronic devices.

| ZnFe2O4 (wt. %) | Sq (nm) | Sa (nm) |
|---|---|---|
| 0 | 114.9 | 94.9 |
| 5 | 120.7 | 103.3 |
| 10 | 113.3 | 83.0 |
| 15 | 105.3 | 80.0 |
| 20 | 104.5 | 81.4 |
3.5. Dielectric Properties
Figure 14 illustrates the relationship between the dielectric constant (ε′) and dielectric loss (ε″) with frequency. As expected, the dielectric constant exhibits an inverse trend compared to the electrical conductivity. At low frequencies, the value of ε′ reaches its maximum and exponentially decreases as the frequency increases. This drop in ε′ is evident when transitioning from higher to lower frequency ranges. Incorporating ZnFe2O4 nanoparticles (NPs) into the system increases the ε′ value at lower frequencies, while it remains relatively unchanged at higher frequencies. This high permittivity is attributed to the localization of charge carriers within the polymer system [36]. The higher ε′ value observed in the lower frequency range may be due to the movement of ions, which contributes to increased ionic conductivity [37].
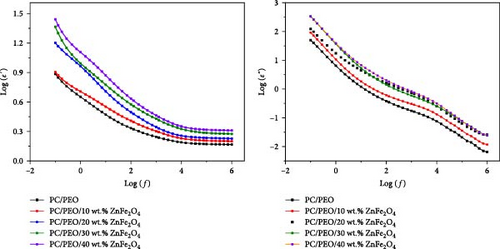
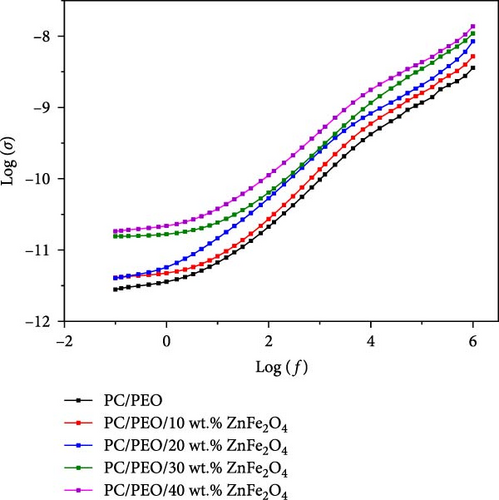
Figure 15 demonstrates that increasing the concentration of ZnFe2O4 NPs in the PC/PEO blend raises the electrical conductivity of the nanocomposites. The observed conductivity enhancement is ascribed to an elevated quantity of charge carriers arising from the inclusion of dopant nanoparticles, which decreases nanocomposite electrical resistance. Furthermore, the electrical conductivity of PC/PEO-ZnFe2O4 nanocomposites increases with frequency due to greater charge carrier mobility in the high-frequency region. Conversely, low frequencies lead to charge accumulation, reducing the number of movable ions and consequently lowering electrical conductivity [38]. From the figure, it is clear that the conduction mechanism of the nanocomposite samples correlated to barrier hopping attributed to localized processes.
3.6. Magnetic Properties
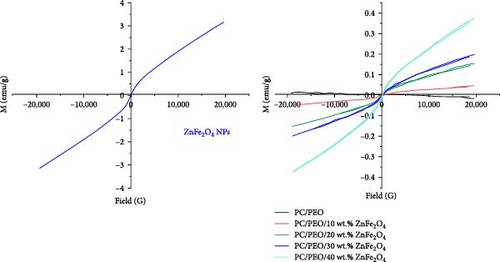
Figure 16 shows the magnetic properties of ZnFe2O4 NPs and PC/PEO ZnFe2O4 nanocomposites. ZnFe2O4 NPs display paramagnetic behavior with a saturation magnetization of 3.13 emu/g. Under an applied magnetic field, the magnetostrictive effect distorts the ZnFe2O4 NPs crystal lattice, producing local strains or stresses at the polymer–magnetic phase interface. This induces domain orientation and grain boundary movement, modifying the material’s dimensions and morphology. In this work, ZnFe2O4 NPs become embedded within the PC/PEO blend. The application of an external magnetic field causes attempted alignment of ZnFe2O4 NP domains with the field, eliciting grain boundary displacement. This phenomenon, known as the inverse magnetostrictive effect, causes a shift in the domain magnetization of the ZnFe2O4 phase due to the imposed interfacial tension, as reported previously [39]. The magnetization in these composites arises from the overall contribution of the filler particles since PC/PEO does not possess magnetic order. Consequently, increasing the concentration of ZnFe2O4 NPs results in higher magnetization. The magnetic data, including saturation magnetization (Ms), coercive magnetization (Hc), and remnant magnetization (Mr), are summarized in Table 2. The saturation magnetization values increase with a higher percentage of ZnFe2O4 NPs in the nanocomposites up to 0.37 emu/g due to the increased number of magnetite nanoparticles in the PC/PEO-ZnFe2O4 NP nanocomposites. The presence of PC and PEO causes thicker domain walls in the magnetic ferrite, requires more energy for magnetization and demagnetization, and impedes the movement of wall domains. As a result, the coercive force is reduced.
| ZnFe2O4 (wt. %) | Ms (emu/g) | Mr (emu/g) | Hc (G) |
|---|---|---|---|
| ZnFe2O4 NPs | 3.13 | 11.8 × 10⁻³ | 19.8 |
| 0 | 0.0015 | 0.36 × 10⁻³ | 536.1 |
| 5 | 0.05 | 1.25 × 10⁻³ | 50.58 |
| 10 | 0.15 | 1.55 × 10⁻³ | 74.5 |
| 15 | 0.20 | 0.97 × 10⁻³ | 36.2 |
| 20 | 0.37 | 0.73 × 10⁻³ | 22.7 |
4. Conclusion
Nanocomposite samples from PC/PEO with various ratios of ZnFe2O4 NPs were prepared. The XRD results show that ZnFe2O4 NPs modify the crystal structure of PC/PEO, resulting in less crystallinity in the blend. After blending, the diffraction peak at 2θ = 9.8° of PC disappeared with a shift of 2θ = 19.4° and an increase of the broadening at 2θ = 23.3° confirming the interaction and complexation between the functional group of PC and PEO. The combination of the two polymers and the ZnFe2O4 NPs was homogeneous, as determined by FT-IR spectroscopy. The Kubelka–Munk function determines optical parameters like the band gap and Urbach energy. The band gap between the conduction and valence band was decreased with the addition of ZnFe2O4 NPs, and Urbach energy increased, which means that ZnFe2O4 NPs create the localized state. HR-TEM showed that ZnFe2O4 NPs have a semispherical shape with an average particle size of 20–70 nm. Surface roughness was altered and smoothed out by the incorporation of ZnFe2O4 NPs, as shown by FE-SEM analysis. EDX analysis confirmed the presence of ZnFe2O4 NPs inside PC/PEO. The roughness parameter, like root, means square roughness, and average roughness decreases when incorporating ZnFe2O4 NPs. Adding ZnFe2O4 NPs to the PC/PEO blend improved its electrical conductivity. The magnetic characteristics are also tested, revealing a rise in magnetic saturation due to incorporating ZnFe2O4 NPs up to 0.37 emu/g. The results significant insights into the structural, optical, electrical, and magnetic characteristics of PC/PEO blends when incorporated with ZnFe2O4 nanoparticles. These findings were useful in different applications.
Conflicts of Interest
The author declares no conflicts of interest.
Open Research
Data Availability
Data are available upon request.


