Classification and Prediction of Vehicle Lane-Changing Crash Risk Levels Based on Video Trajectory Data
Abstract
To investigate the potential lane-changing collision risks that may arise between vehicles during lane changes and those in the original lane, a model for vehicle lane-changing collision risk is constructed specifically for this scenario, and a research analysis is conducted. First, based on vehicle trajectory data, a sample set capturing the relationships between vehicles traveling in a straight line and those changing lanes laterally is extracted and built. Interpolation methods are then applied to fill in missing values, outliers are eliminated, and data noise is smoothed during preprocessing. After preprocessing, a total of 468 vehicle pairs and 265,392 data points are obtained. Second, a real-time collision time model is established based on the preprocessed data, and collision risk probabilities are calculated accordingly. Then, the collision risks are classified into four levels based on whether the vehicle on the side actually changes lanes and the severity of the collision risks. Finally, a light gradient boosting machine (LightGBM) learning method is adopted to predict the risk levels and analyze the main factors that significantly impact the severity of collision risks. The results indicate that the longitudinal distance between the target vehicle and the preceding vehicle is the most critical influencing factor, followed by the speed of the target vehicle itself, and then the speed difference between the target vehicle and the preceding vehicle. The influence of other factors is relatively similar and does not have a significant impact.
1. Introduction
Lane changing and car following are the most common behaviors of vehicles on the road. Compared to the car following, lane changing poses a higher degree of danger and uncertainty [1]. When executing a lane change, it is necessary to consider the movement status of surrounding vehicles comprehensively. Dangerous lane-changing behaviors often cause turbulence in traffic flow, affect driving safety, and even lead to traffic accidents [2]. Moreover, the more complex the lane-changing environment, the greater the risk will be [3]. Therefore, researching on lane-changing collision safety risks for vehicles has theoretical and practical significance.
Research on lane-changing collision safety risks for vehicles has been ongoing for a long time, which can be divided into statistical models and machine learning–based models.
Statistical models often rely on specific indicators to assess risk or use theoretical formulas to measure the degree of danger. These models have high interpretability and do not require large amounts of data, but they may not be suitable for more complex scenarios. Gipps [4] proposed a simple convergence decision model based on predefined rules, which is easy to apply. However, due to the numerous assumptions made in the model, there are significant differences between the predicted results and actual vehicle driving behaviors. Mahajan et al. [5] developed a lane change risk index (LCRI) based on the modified collision time (MTTC) and further introduced a road segment risk prediction method to investigate how risk evolves with traffic flow conditions. Chen et al. [6] proposed the LCRI from a microbehavioral perspective, using vehicle trajectory data. They established a random variable–ordered logit model with mean and variance heterogeneity to evaluate the risk level of each vehicle group. Li et al. [7] established a polynomial logistic model to estimate the collision risk of lane changing at intersections and explained its influencing factors. Chen et al. [8] proposed the concept of lane-changing vehicle groups and developed a LCRI to evaluate the risk level of each vehicle group. Zhao et al. [9] modified the collision potential index (CPI) to reflect driver’s reaction time and estimated it based on the types of leading and following vehicles (automobiles or heavy vehicles).
In recent years, with the development of AI [10], many scholars have attempted to apply machine learning algorithms to the field of traffic management [11]. These methods usually have high accuracy but require a large amount of data for training, and the interpretability of the model is limited [12]. Zhang et al. [13] proposed a personalized risk lane change prediction framework of ego vehicles that takes driving style into account, using LightGBM to predict collision risks for various driver types and analyze influencing factors. Chen et al. [14] applied a random forest (RF) classifier to study the influencing factors of highway lane-changing behavior and predicted the risks of lane-changing behavior. Li et al. [15] proposed a support vector regression (SVR) model that uses microscopic traffic parameters, including speed, acceleration, and headway, to predict the impact of lane-changing on collision risk. Chen et al. [16] developed a Copula Bayesian network to predict lane-changing risks before accidents occur and explained the relationship between risk and variables. Chen et al. [17] proposed to combine the dynamic time warping (DTW) and K-means to measure the risks of lane-changing behavior. Fu et al. [18] developed a new simulation framework for mixed traffic flow to fill the gap in safety assessment under snow weather conditions, which can simultaneously identify longitudinal and lateral conflicts.
- 1.
Two novel risk assessment indicators, time to side-occupancy (TSO) and real-time risk exposure level of collision (RREL), are proposed to more accurately classify and evaluate lane-changing collision risks.
- 2.
The LightGBM algorithm is employed to predict lane-changing collision risks, enhancing the accuracy and reliability of predictions.
- 3.
Through feature importance analysis, multiple input factors related to the target vehicle, leading vehicle, and laterally lane-changing vehicle are ranked and analyzed, improving the interpretability of factors influencing lane-changing collisions.
2. Trajectory Data Preprocessing
This paper uses the UAV video trajectory database [19], which is the trajectory data of an expressway with a speed limit of 80 km/h on a section of Yingtian Street Viaduct in Nanjing, Jiangsu Province, China, in 2020, one of the busiest interchange hubs in the south part of Nanjing city, as shown in Figure 1. The data are provided and collected by the Ubiquitous Traffic Eyes (UTE) team. The team uses drones equipped with 4K high-definition cameras to conduct aerial photography of road traffic flow operations and extract high-resolution vehicle trajectory data from the videos. The original vehicle trajectory data include vehicle number, time, lane number, longitudinal position of the vehicle, lateral position of the vehicle from the edge of the lane line, vehicle speed, acceleration, vehicle length, and vehicle width parameters, with a time accuracy of 0.04 s and a position accuracy of 0.01 m.
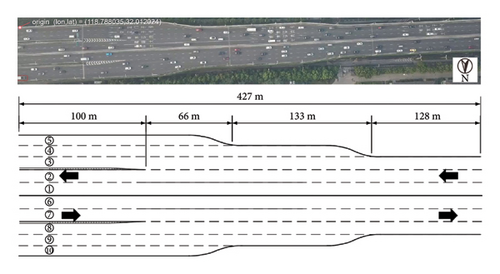
In the merging area of the road, lane-changing behavior often occurs due to the reduction of lanes. Therefore, based on the research objectives of the article, the lane merging area is selected as the research object, and the chosen dataset covers 5 lanes and contains 541 vehicles, totaling 535,892 data.
2.1. Handling of Anomalous Data
For speed anomalies, the maximum speed limit of the road section is used as an auxiliary parameter to identify the over-limit data, and the anomalous data whose speed exceeds this value are eliminated.
For acceleration anomalies, under normal driving conditions, the standard range of the recommended rate of change of vehicle speed is [−6 m/s2 to 5 m/s2] [20]. Data with absolute acceleration values exceeding 10 are removed, and special attention is given to detecting and eliminating anomalies in the data when the vehicle first appears.
For lateral position anomalies, through preliminary analysis, when there is an anomaly in the initial lateral position of the vehicle, there is always a data jump in the vehicle trajectory data, i.e., the lateral position is not continuous. Therefore, it is necessary to process the lateral position data according to time continuity and space continuity.
A total of 468 vehicle pairs and 265,392 data are obtained after data preprocessing.
2.2. Smoothing of Filtered Data
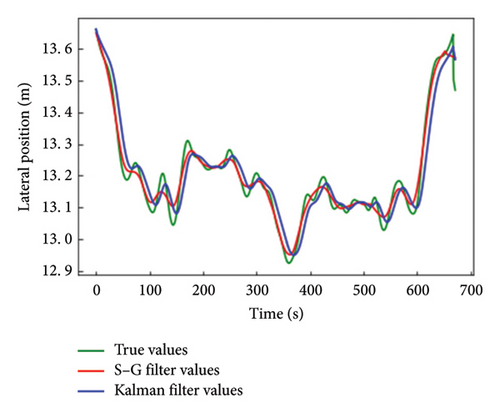
To address measurement errors caused by random disturbances in the data, noise reduction is necessary. Data smoothing is a commonly used method for this purpose. In this study, we employ the widely used Savitzky–Golay (S–G) filter [21] and Kalman filter [22] to smooth vehicle lateral and longitudinal coordinates, speed, and acceleration. The filter with the best smoothing performance between the two is selected as the smoothing value.
When applying smoothing filters, high-frequency components can be effectively smoothed out. Figure 2 displays the results of lateral position smoothing for a randomly selected set of vehicles. The green line represents the original values, which exhibit jumping fluctuations due to detection errors. The red line represents the S–G filter values, and the blue line represents the Kalman filter smoothing values. It can be observed that the smoothing effect is significant for high-frequency changes. By fitting the low-frequency components, the high-frequency components can be smoothed out.
3. Establishment of the Collision Risk Index for Lateral Vehicle Lane Changing
In order to enhance the safety of lane-changing maneuvers, this study investigates the collision risk associated with the lane-changing process. By analyzing the influencing factors of lane-changing collision risks, a collision risk model is developed. First, the stopping sight distance (SSD) index [23] is calculated for each leading and following vehicle. Subsequently, considering the relative relationship between the leading and following vehicles and incorporating the safety distance factor, a stop distance index (SDI) [24] is computed. Two scenarios are considered as follows: one where a vehicle intends to change lanes but does not execute the maneuver, and another where a vehicle intends to change lanes and successfully completes the maneuver. TSO values are calculated based on the SDI for each scenario. Following this, the collision risks are classified, and the RREL is computed by TSO values.
3.1. Calculation of TSO
In addition to the longitudinal and lateral position changes of vehicles, lane changing involves the motion relationship between vehicles, which is a crucial factor in studying the modeling and prediction of collision risks.
SSD refers to the minimum distance a driver needs to brake and come to a complete stop after detecting an obstacle in the forward path. It consists of three components as follows: reaction distance, braking distance, and safety distance. Since SSD is a single-vehicle indicator, the safety distance is not considered first, and only the reaction distance and braking distance are calculated. At this time, the minimum SSD contains two parts of vehicle reaction distance and braking distance.
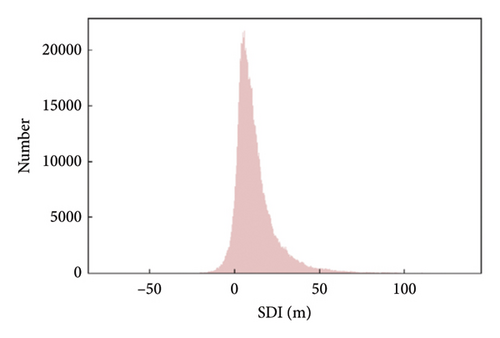
Calculations and statistical analyses are performed on the data obtained in the previous section. The results indicate that 4% of the data has SDI less than 0, as shown in Figure 3, which indicates that there is a certain level of safety concern on the road during lateral lane-changing maneuvers by neighboring vehicles.
On this basis, considering two scenarios as follows: when a vehicle intends to change lanes but does not execute the maneuver and when a vehicle intends to change lanes and successfully completes the maneuver, two TSO calculation models are established for each scenario.
3.1.1. Impact of Vehicles With Lane-Changing Intentions but Not Executing the Maneuver
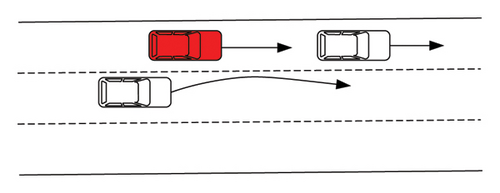
Due to the subjective and stochastic nature of vehicle driving, when a side-approaching vehicle indicates an intention to change lanes or when the lateral distance to the adjacent lane is too close, it can affect the normal driving of the adjacent vehicles, even if the vehicle does not actually change lanes, as shown in Figure 4.
The formula implies that when the lateral distance between the lane-changing vehicle and surrounding vehicles is lower than a certain safety threshold, the TSO value is taken as the minimum of the TSO value calculated for the leading vehicle and the TSO value calculated for the side-approaching vehicle.
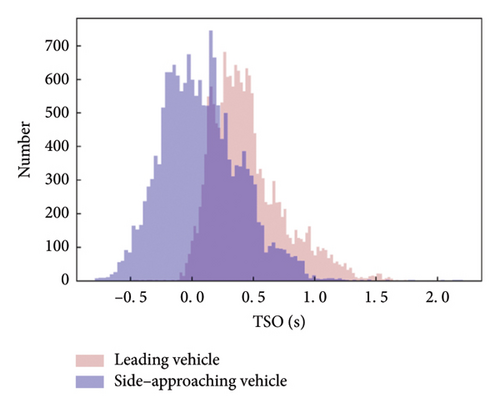
Calculations and statistical analyses are performed on the data obtained in the previous section, and the results are presented in Figure 5. The pink bars represent the TSO values calculated based on the leading vehicle, while the blue bars represent the TSO values calculated based on the side-approaching vehicle. It can be observed that the TSO of the vehicle is greater without the influence of the side-approaching vehicle’s lane-changing intention. The side-approaching vehicle’s lane-changing intention makes the vehicle’s collision time decrease by about 0.5 s, which will create a greater safety hazard.
3.1.2. Impact of Vehicles With Lane-Changing Intentions and Successful Completion of the Maneuver
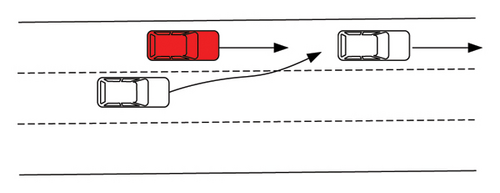
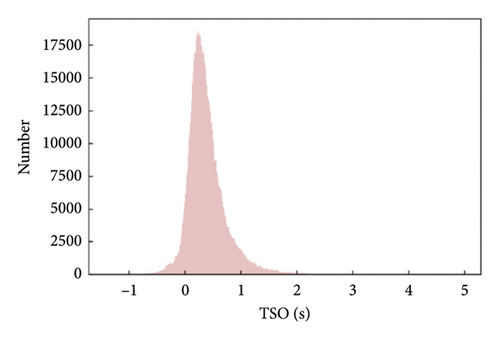
Calculations and statistical analyses are performed on the data obtained in the previous section. After calculation, it is found that there are 1200 cases with TSO greater than 3, which undoubtedly represent safe situations. In order to analyze cases with safety risks, data with the TSO of less than three are selected to draw a distribution map. The resulting distribution of TSO is depicted in Figure 7, where it is observed that the peak occurs around 0.3 s.
3.2. Calculation of RREL
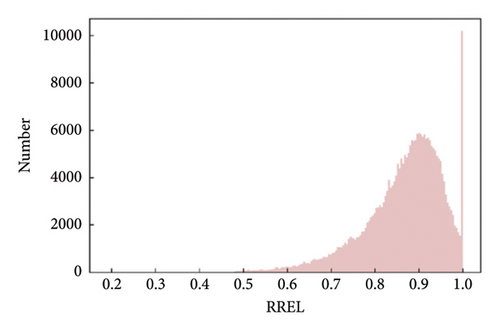
The choice of cEDF affects the peak position and width of the final distribution graph but does not influence the overall shape of the distribution. When RREL is equal to 1, it indicates moments when TSO is less than 0, regardless of the value of c. Calculations and statistical analyses are performed on the data obtained in the previous section, and the resulting distribution of RREL is shown in Figure 8.
3.3. Classification of Collision Risk Levels
- 1.
TSO less than 0: Extremely dangerous, indicating an unavoidable collision risk for the target vehicle.
- 2.
TSO greater than 0 and less than or equal to 1 s: The vehicle may not decelerate in time, and the collision situation is relatively severe.
- 3.
TSO greater than 1 s: The risk of collision is relatively low.
Moreover, vehicles are influenced not only by side-approaching vehicles that actually change lanes but also by those with the intention to do so. Therefore, the impact generated by side-approaching vehicles with lane-changing intentions but not executing the maneuver is also considered a risk. This leads to a total of four collision risk scenarios, as shown in Table 1. It is important to note that the classification results, upon validation with actual data, do not guarantee a collision but provide a categorized assessment and prediction of potential risks.
| Category | Condition | Severity |
|---|---|---|
| 0 | Lane-changing intention, no lane change | Mild |
| 1 | TSO < 0 | Extremely severe |
| 2 | 0 < TSO ≤ 1 | Severe |
| 3 | TSO > 1 | Moderate |
4. Prediction Model for Vehicle Collision Risk Levels
4.1. LightGBM Algorithm
Light gradient boosting machine (LightGBM) [25] is an improved algorithm based on the gradient boosting decision tree (GBDT) [26] framework. It uses the Gaussian algorithm for optimized sampling and employs regression tree models as its base learners. Furthermore, LightGBM utilizes histogram-based algorithms and depth-constrained leafwise growth algorithms to boost efficiency and prevent overfitting. This algorithm boasts higher training efficiency, reduces memory consumption, and increases accuracy, support for parallel training, and scalability for handling large-scale data processing. Compared to other GBDT improvement algorithms, LightGBM exhibits stronger and faster performance improvements [27]. Given its robust capabilities, this paper employs the LightGBM algorithm to predict the collision risk level of target vehicles influenced by side-approaching lane changes.
For training with the sample set {(xl1, yl1), (xl2, yl2), …, (xln, yln)}, the objective of the LightGBM algorithm is to minimize the loss function.
4.2. Results Analysis
The model takes the following parameters as input: the speed difference between the target vehicle and the leading vehicle (Variable 1), the speed difference between the target vehicle and the side-approaching vehicle (Variable 2), the acceleration difference between the target vehicle and the leading vehicle (Variable 3), the acceleration difference between the target vehicle and the side-approaching vehicle (Variable 4), the speed (Variable 5) and acceleration (Variable 6) of the target vehicle itself, the lateral gap between the target vehicle and the leading vehicle (Variable 7), the lateral gap between the target vehicle and the side-approaching vehicle (Variable 8), the longitudinal gap between the target vehicle and the leading vehicle (Variable 9), and the longitudinal gap between the target vehicle and the side-approaching vehicle (Variable 10). These 10 parameters serve as inputs for the model, while the four categories of collision risk obtained from the calculation are considered as output factors for prediction.
To evaluate the model’s performance, the actual road vehicle data are divided into a training set and a testing set with an 8:2 ratio. The model undergoes tuning, and the optimal network structure parameters are searched using the method of controlling variables. The final parameters are set as follows: the number of categories is 4, the specified number of leaves is 31, the model learning rate is set to 0.05, the number of decision trees is set to 20, and the maximum depth of the trees is set to −1.
The confusion matrix is used to illustrate the model’s classification prediction results. Rows represent predicted values, columns represent true values, and the values on the diagonal indicate the number of samples correctly predicted by the model. The resulting confusion matrix for the testing set is depicted in Figure 9.
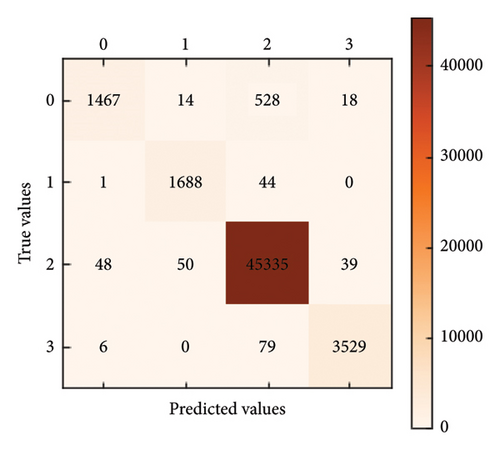
As can be seen from Figure 9, the values along the diagonal of the classification matrix are significantly larger than those in other positions, indicating that the model predicts a large number of results correctly and hence exhibits a good predictive performance.
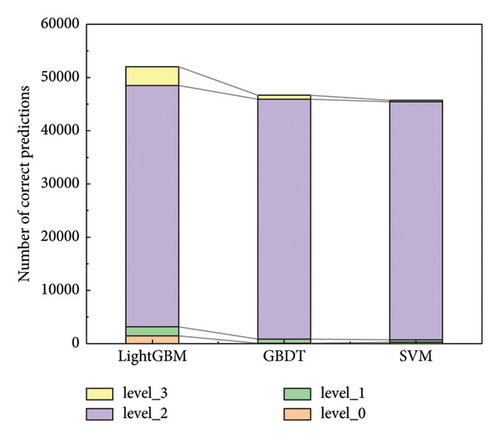
For comparison, the SVM and GBDT models are selected, and their predictive performance of each risk level is shown in Figure 10. Then, the four metrics: accuracy, recall rate, F1 score, and precision are evaluated. The validation results for these models are shown in Table 2.
| Model | Accuracy (%) | Precision (%) | Recall rate (%) | F1 score (%) |
|---|---|---|---|---|
| LightGBM | 97.76 | 97.77 | 97.76 | 97.49 |
| GBDT | 88.32 | 86.20 | 88.32 | 84.96 |
| SVM | 86.52 | 85.44 | 86.52 | 82.49 |
It can be observed that the SVM model has relatively poor predictive results, with its overall predictions tending to underestimate the actual values. Conversely, the GBDT model shows good predictive performance, achieving an overall accuracy of over 84%, though still lower than the LightGBM model. The LightGBM model exhibits precision above 97% for all metrics, demonstrating its higher credibility and persuasiveness.
Based on the results presented in Figure 10, it can be concluded that the LightGBM model has the highest predictive accuracy, followed by the GBDT model, and finally the SVM model. The SVM model tends to be conservative in its predictions, with most predicted values below the actual values. The majority of the samples have been classified into a collision risk level of 2, which indicates a relatively severe degree of potential collision risk.
4.3. Feature Importance Ranking for Collision Risk Factors
Feature importance analysis enhances the interpretability of the model, helping establish trust and making decisions that align with real-world significance. Using the LightGBM algorithm, 10 input factors, including traffic features of the target vehicle, the leading vehicle, and the side-approaching vehicle, are selected for feature importance ranking. The ranking results are shown in Figure 11. The numerical values represent the frequency of appearance in the trees during the classification predictions made by the LightGBM model, thus serving as an indicator of feature importance.
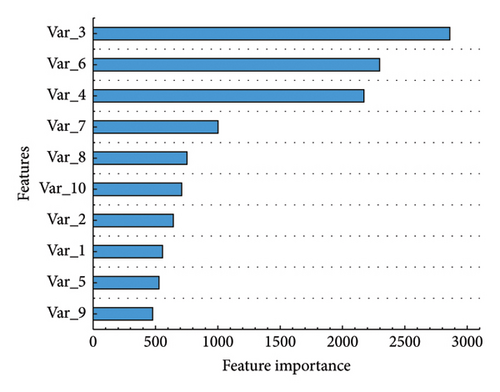
From the results, it can be observed that the traffic features of the leading vehicle have a significant impact on the collision risk. Following this, the speed and positional relationship of the target vehicle itself are important factors. Then, the influence of the side-approaching vehicle comes into play, though its impact is less significant. Notably, after the side-approaching vehicle changes lanes, its position with respect to the target vehicle transforms from a side-approaching vehicle to a leading vehicle. Therefore, special attention should be paid to the spacing between vehicles during the lane-changing process to mitigate potential collision risks.
5. Conclusion
This paper considers the collision safety risks that may arise when side-approaching vehicles change lanes and establishes a classification prediction model for lateral vehicle lane-changing collision risks.
First, the TSO for adjacent vehicles approaching from the side during lane changes is defined and computed, rooted in an in-depth analysis of their kinematic interactions. Subsequently, the likelihood of collision is stratified into four distinct severity tiers, each reflecting the TSO’s magnitude. Collision risk assessments are conducted for each moment of driving behavior, determining its danger level while calculating the RREL.
Second, the LightGBM algorithm is harnessed to classify and predict real-world vehicular data. The relevant traffic parameters of the target vehicle, leading vehicle, and side-approaching lane-changing vehicle are used as input factors. Comparative analyses with GBDT and SVM models underscore LightGBM’s superior performance, notably outperforming SVM by a significant margin and slightly edging out GBDT, attaining a prediction accuracy exceeding 97%. This demonstrates its effectiveness in predicting and identifying lane-changing risks.
Finally, leveraging the LightGBM algorithm, we rank the relative importance of input factors, revealing that the following distance between the target vehicle and the leading vehicle, the speed of the target vehicle, and the speed difference between the target vehicle and the leading vehicle are the main factors influencing collision risks.
The established classification prediction model for lateral vehicle lane-changing collision risks effectively identifies hidden collision risks in traffic environments, thus ensuring driving safety.
Conflicts of Interest
The authors declare no conflicts of interest.
Funding
This work was supported by the National Natural Science Foundation of China (72371019) and the Technology Project of Hebei Expressway Group (02072210KY0301). The first project provided financial support for our second, fifth, and sixth authors, and the second project provided financial support for our first, third, and fourth authors.
Acknowledgments
This work was supported by the National Natural Science Foundation of China (72371019) and the Technology Project of Hebei Expressway Group (02072210KY0301). The first project provided financial support for our second, fifth, and sixth authors, and the second project provided financial support for our first, third, and fourth authors. We did not use AI in the preparation of the manuscript.
Open Research
Data Availability Statement
The data used to support the findings of the study are openly available at https://drive.google.com/drive/folders/1TNXu6CMD32JnnRZvNmVEnaJFEAGN9ff_?usp=drive_link.


