Numerical Investigation on J-Shaped Straight-Bladed Darrieus Vertical Axis Wind Turbines Equipped with Gurney Flaps
Abstract
This study provides a numerical investigation about J-shaped straight-bladed Darrieus vertical axis wind turbines equipped with outboard, inboard, and two-sided Gurney flap (GF). The performance of the turbines is examined for different GF heights and tip speed ratios (TSRs). The aerodynamic analysis is carried out using power curves, vorticity field, and pressure field surrounding the wind turbine. The results indicate that employing the inboard GF effectively enhances the turbine’s performance by harnessing the drag force in the desired direction and postponing the flow separation up to 14° of azimuth angle. The inboard GF with a height of 0.75% chord length exhibits the best performance among the GFs, showing an increase in output power at higher TSRs up to 12.35%. Conversely, the use of outboard and two-sided GFs of any height cannot improve the turbine efficiency.
1. Introduction
The unique characteristics of vertical axis wind turbines (VAWTs), such as their insensitivity to the wind direction, low startup speed, low noise generation and vibration, and low maintenance costs [1, 2], have drawn the interest of numerous researchers in recent years. Another attractive aspect of the VAWTs is that unlike the horizontal axis wind turbines (HAWTs), the VAWTs do not need a wind farm and may be applied for small-scale applications. This matter, together with the fact that VAWTs may be operational at low wind speeds, makes them a promising candidate to be installed even in urban areas. Nevertheless, one of the important challenges is how to tackle the main disadvantage of the VAWTs that is they have considerably lower performance than HAWTs.
VAWTs can be classified into two distinct types, namely, the Savonius type, which is a drag-based turbine, and the Darrieus type, which is a lift-based turbine. Over time, modifications were made to the shape of the blades with the objective of enhancing their effectiveness, resulting in the widespread use of the common straight-bladed design. While the straight-bladed vertical axis wind turbine (SB-VAWT) appeared to outperform other types of VAWTs, it still has challenges with regard to low efficiency and self-start capability compared to conventional HAWTs [3, 4]. Typically, these turbines are comprised of two or three blades affixed to the rotation axis through connecting arms (Figure 1).
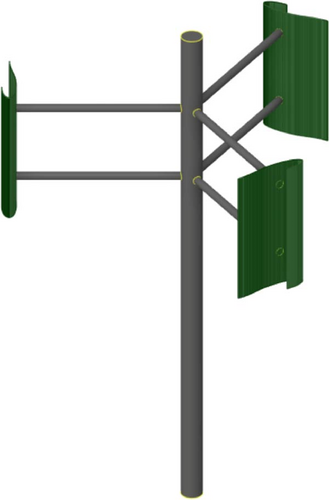
Numerous studies have been conducted on the blade profiles employed in Darrieus vertical axis turbines, aiming to enhance efficiency and improve the generation of initial torque. In general, research can be categorized into two classifications. In the first category, the focus of research is dedicated to the geometric modification of turbine blades, while the second category involves endeavors by researchers to enhance turbine performance through the utilization of flow controllers integrated into the blades.
From an aerodynamic performance viewpoint, it might be argued that SB-VAWTs fail to generate the required starting torque due to poor utilization of drag force. In contrast, Savonius vertical axis turbines exhibit no difficulty in providing starting torque, however, with the expense of lower efficiency. Modi and Fernando [5] conducted an extensive investigation on various designs of Savonius turbine blades. Their findings indicate that a power coefficient of 0.3 can be achieved by employing a blade tip speed ratio (TSR) of 0.7, thereby demonstrating an outstanding level of performance. By considering the strengths and weaknesses of various types of wind turbines, it is believed that by providing a blade that has the characteristics of each, it is possible to design a turbine that does not have the problem of providing initial startup torque and, at the same time, has an acceptable efficiency. The majority of previous studies have mostly concentrated on the utilization of symmetrical airfoil profiles, such as NACA 0012, NACA 0015, and NACA 0018. The installation of these blade profiles within SB-VAWT is incapable of generating sufficient torque required for initiating turbine operation. Modi and Fernando [5] showed that better performance can be recorded by using the curved 6-digit NACA blade profiles. The blade’s curvature increases the chord length, exposing more surface to the flow. Kadlec [6] also proposed the use of curved sections in order to increase the power coefficient of the turbine.
The adoption of curved blades was also confirmed by Klimas [7]. He claimed that using curved sections has advantages over the earlier use of symmetrical sections. That research made the researchers look for the geometric modification of sections. In a study carried out by Maruyama et al. [8] in 2001, the NACA 0018 cross-section was modified and tested. They concluded that the modified cross-section exhibited superior performance compared to the conventional one. Claessens [9] employed geometric modification techniques to enhance the performance of the NACA 0018 airfoil, ultimately leading to the development of the aerodynamic Du 06-W-200 airfoil. This newly developed profile is experimentally tested by Du et al. [10] to study the effect of independent design parameters. The Du 06-W200 profile demonstrated the highest peak power coefficient compared to the other two typical blades (NACA0021 and NACA4415). Zamani et al. [11] proposed an innovative strategy for providing the initial torque of the turbine. The presented model, known as the J-shaped profile, is obtained by eliminating a part of the DU 06-W-200 pressure side (Figure 2). The concept of removing a section of the airfoil, that is, from maximum thickness toward the trailing edge, is derived from a combination of the Savonius and Darrieus designs. The findings of Zamani et al. [11] indicate that the utilization of a J-shaped profile can improve self-starting. The results also show the maximum power coefficient of 0.485, which occurs at a TSR of 2.25 when using a J-shaped blade that was 0.469 for the conventional Du 06-W-200 airfoil. The reason behind the augmentation of torque is to enhance the drag force through the confinement of airflow within the airfoil at specific rotational angles, similar to the operation mechanisms seen in Savonius turbines.

On the other hand, flow controllers are recognized as a viable method to alter wind turbines’ aerodynamic performance. In the latest studies, researchers have come up with using passive flow control techniques based on the need to fill the performance gap compared to HAWTs. For instance, Eltayesh et al. [12] studied the impact of outboard and inboard configurations of dimples on hybrid turbine performance. It is proved that the presence of dimples has a positive effect and gives a flatter power coefficient curve. As another recent successful usage of flow controllers, three passive control methods, including leading-edge serration, anhedral, and endplate, could mitigate the losses, increasing the power coefficient of a two-bladed H-type Darrieus VAWT with NACA0018 airfoils [13]. These studies prove that proper utilization of flow controllers, especially passive techniques, can help to harness wind energy effectively. However, a deep understanding of aerodynamics is required to attain suitable methods.
One of the most renowned types of controllers is the Gurney flaps (GFs). They are small plates, typically with a height less than 2% of the blade chord length, mounted perpendicular to the trailing edge. The first study of the aerodynamic characteristics of a blade with a GF was conducted by Liebeck [14] as a hypothesis. He believed that the installation of a GF leads to an enhancement in lift force due to the formation of two counter-rotating vortices behind the flap, which alters Kutta condition. The vortices behind the GF induce small regions of separated flow above the blade that change the pressure distribution (Figure 3). In 1998, Jang et al. [15] conducted a numerical study on the standard NACA 4412 blade equipped with a GF in two dimensions. The parameter investigated in the study was the flap height, which varied between 0.5% of the blade chord (0.5%c) and 3%. Despite the relatively less accurate code employed at the time, the outcomes of their investigation reveal a remarkable resemblance to the findings of this research. In several static airfoils, the positive impact of GF was also demonstrated [16, 17, 18]. The results showed that the implementation of a GF leads to an increase in the lift force exerted by the blade. It is noteworthy that an undesirable elevation of the drag force follows this enhancement, known as the drag penalty. The optimal height of the flap is completely dependent on the blade profile used, as Cole et al. [19] demonstrated through the evaluation of several blades. With further investigation, it becomes evident that in the majority of cases, the efficient GF height ranging from 0.5% to 2% of the chord length yields better performance [20, 21]. Furthermore, by using higher GFs, the drag penalty increases and makes it useless [20].
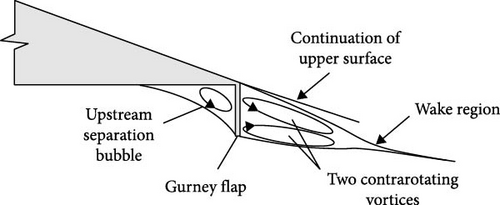
Graham et al. [22] investigated the effect of GF thickness on the SD7062 airfoil and claimed that better performance is achieved by using GF with lower thickness. However, the study by Hao et al. [23] showed that the width of the rectangular GF has a small impact on the lift, the drag, and the pitching moment. An investigation conducted by Zhu et al. [24] in 2021 examined the impact of a solitary outboard GF model on a turbine featuring the Naca0021 profile. The results have once more proved the positive impact of outboard GF on performance. At certain TSRs, an increase of as much as 21.32% was detected. In their earlier research, it was demonstrated that adding a GF onto standard sections can yield favorable outcomes with regard to speed intervals [25]. To conclude, the studies prove that the installation of a GF has the potential to enhance the performance of a wind turbine by simultaneously increasing the lift and drag coefficients. Nonetheless, blade sections are frequently designed to maximize lift force generation while minimizing drag force.
The corresponding literature, as briefly reviewed above, shows that many researchers tend to discover a proper passive control technique to improve the performance of SB-VAWTs. The current study comprehensively examines the effects of the GF flow control technique on newly introduced J-shaped straight blades. The preliminary results with J-shaped blades, so far reported in the literature, appear to be promising in enhancing the torque produced by the turbine under certain conditions. In this study, for further improvement of the VAWT performance, the small-scale J-shaped straight blades of Zamani et al. [11] are equipped with GFs. Outboard, inboard, and two-sided GFs mounted on J-shaped SB-VAWT are investigated. In terms of the physics of the flow, this study also aims to find out the aerodynamic effects of the GF height for a wide range of variations of TSR values.
2. Governing Equations and Numerical Methods
The flow field around VAWT is governed by the Navier-stokes equations regarding the incompressibility of the working fluid, as shown by Equations (1) and (2).
3. VAWT Geometrical and Boundary Conditions
The proper characterization of the computational domain has significant importance in numerical simulations. One potential drawback is that an excessively large fluid domain leads to a notable rise in the number of elements and, therefore, an increase in the computational cost. Conversely, by employing a restricted fluid domain that prevents the formation and development of vortices in the downstream region of the turbine, major changes in the results may occur, which increases the error rate of the simulation. Thus, in the present study, the rotor central axis was placed eight times the radius of the rotor from three sides (Figure 4). As was mentioned earlier, in the downstream area of the turbine, the creation of vortices is anticipated, and this phenomenon has a direct impact on the performance. Therefore, the distance under consideration is 16 times the radius of the turbine rotor. Three circular regions were strategically positioned around the airfoils to reduce the number of elements while maintaining the grid quality. Table 1 briefly presents the geometric characteristics of 3 kW straight-bladed Darrieus VAWT with a J-shaped profile. It is worth mentioning that the flow geometry and simulation parameters are considered to be similar to those of Zamani et al. [11] to provide an appropriate ground for comparison of the results. This is particularly important once the performance of the turbines with and without GFs are to be evaluated.
| Parameter | Value |
|---|---|
| Blade profile | J Du 06-W-200 |
| Number of blades (N) | 3 |
| Rotor diameter (Drotor) | 3.7 m |
| Chord length (C) | 0.297 m |
| |D1| | 5.18 m |
| |D2| | 0.0575 m |
| |D3| | 0.8 m |
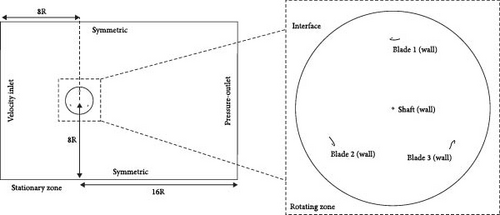
The employed boundary conditions on each of the boundaries of the 2D computational domain are depicted in Figure 4. A uniform inflow velocity of 10 m/s enters the domain from the left side of the computational domain with turbulent intensity of 0.1% and a viscous ratio of 10. A pressure-outlet type boundary with zero gauge pressure was set to the outlet, which represents atmospheric pressure. Both far-field boundaries were modeled sufficiently far from the turbine. Thus, a zero flux slip condition was defined for all variables. Also, the interface boundary connecting the stationary zone and rotating zone was used to interpolate the necessary values across the boundary to ensure a smooth transition from one cell zone to the other. No-slip wall boundary conditions were applied at the surfaces of the rotor blades and its tower.
Figure 5 illustrates the geometric model of GFs. There are three models of outboard, inboard, and two-sided GFs. As seen in Figure 5, the outboard GFs are mounted on the trailing edge of the airfoil toward the suction surface. The inboard GFs extend from the trailing edge to the pressure surface, and the two-sided GFs mount from both sides.


4. Model Sensitivity Analysis
4.1. Grid Independence Study
Based on prior studies, it has been observed that y+ for the nearest computing node to the wall should not be greater than 1 [30]. In the present study, the corresponding value of y+ was specified to be 1. Table 2 summarizes the three mesh specifications that were generated to investigate the grid independence study. The grid independence study is performed for the case in which the blade is equipped with an outboard GF with 2%c height, working at TSR 2.25.
| Grid name | Number of elements on the blade surface | Number of boundary layers | Growth rate | Total number of elements | Average torque coefficient | Derivation (%) |
|---|---|---|---|---|---|---|
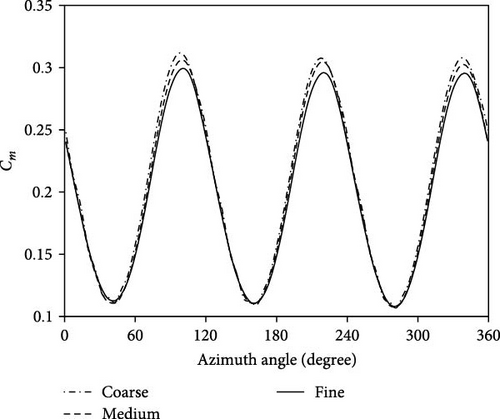
| Coarse | 4,900 | 25 | 1.15 | 774,057 | 0.202 | — |
| Medium | 7,400 | 25 | 1.15 | 1,100,996 | 0.197 | 2.53 |
| Fine | 14,800 | 25 | 1.1 | 3,328,357 | 0.196 | 0.51 |
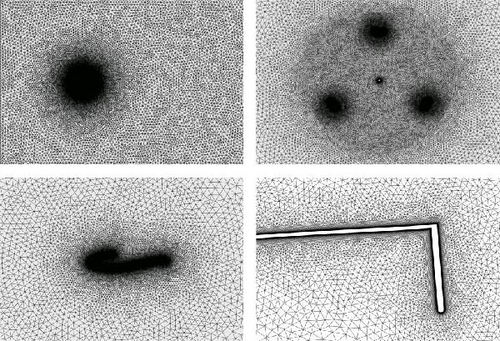
Figure 6 depicts how an unstructured grid was employed for both the rotating and stationary zones, while boundary layer grid generation was used in the vicinity of the airfoils. To avoid increasing the number of elements and hence the computational load, employing a finer grid only in sensitive and vital areas was attempted.
A comparison of the results on the torque coefficient as a function of blade azimuth angle for different grids is presented in Figure 7. As can be seen, there is a negligible difference in torque coefficient over all azimuth angles between medium and fine grids. The average torque coefficient of 0.202 was achieved by utilizing a coarse grid that has less than a million elements. The medium grid has twice as many cells as the coarse grid on the blade surface, resulting in 1.1 million elements in total and an average torque coefficient of 0.197, which means 2.53% changes. A fine grid was generated with double elements on the blade surface. The corresponding change in average torque coefficient between medium and fine mesh is 0.51%. Considering 1% changes in torque as a convergence criterion, the medium grid was selected as the optimal grid. Table 2 summarizes each grid’s specifications and achieved results.
4.2. Time Independence Study
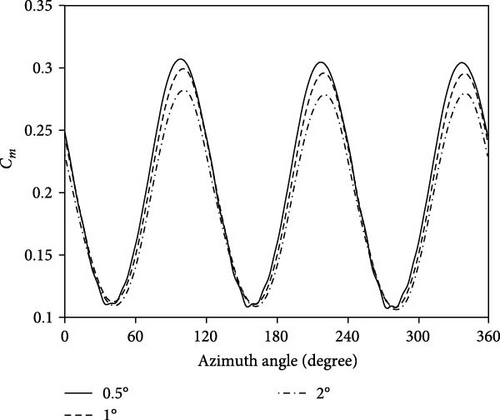
The time step is typically adjusted by the rotation angle of the rotor in VAWT simulations. In the present study, the time step’s effect on the simulation outcomes is evaluated by varying the time step values corresponding to 0.5°, 1°, and 2°. To some extent, the initial simulation involves the turbine having a rotational displacement of 0.5° at each time step, and subsequent simulations exhibit an increment to 1° and 2°, respectively. The time independence study is performed for the case in which the blade is equipped with an outboard GF with 2%c height, working at a TSR of 2.25. As can be seen in Figure 8, the time step corresponding to 1° shows results similar to the time step corresponding to 0.5° regarding its having half the computational cost. In terms of the average torque coefficient, the results are given in Table 3 demonstrate that employing a time step equivalent to 1° gives acceptable levels of accuracy regarding 1% changes in the average torque coefficient as the convergence criterion. It should be noted that in each case study, the time step sensitivity analysis must be performed independently.
| Time step size (°) | Average torque coefficient | Derivation (%) |
|---|---|---|
| 0.5 | 0.203 | — |
| 1 | 0.202 | 0.49 |
| 2 | 0.188 | 6.93 |
4.3. Model Validation
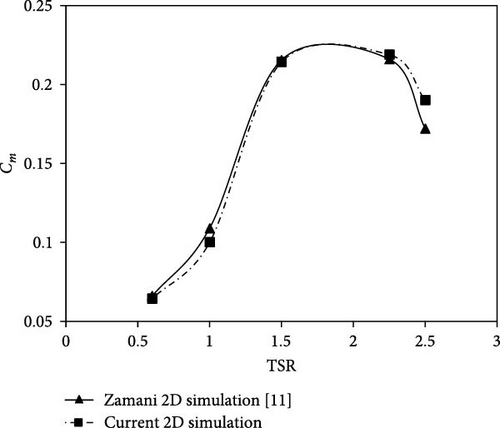
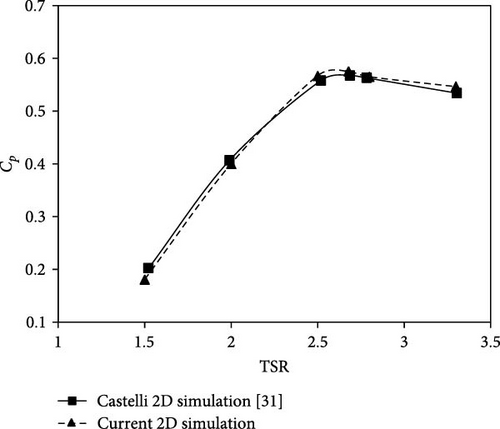
As indicated in Figure 9, the simulations were carried out using five different TSRs, including 0.6, 1, 1.5, 2.16, and 2.5. The simulation results demonstrate an adequate level of agreement at all data points, with the highest variation observed at a blade TSR of 2.5, resulting in an inaccuracy of 10%. In many locations, the observed inaccuracy falls within the range of 1%–2%, thereby proving the accuracy of the simulation results. Further, To increase the reliability of the simulations, the study done by Castelli et al. [31] was also investigated. They have experimentally and numerically tested a three-bladed Darrieus VAWT using the NACA0021 baseline. Figure 10 illustrates the comparison between the wind tunnel measured, the CFD simulation, and the numerically determined 2D power curve for a wind speed at the test section entrance of 9 m/s. It is evident that the simulation results, compared to Castelli’s numerical investigation [31], exhibit a good agreement. More specifically, throughout the TSRs range of 1.5–3.3, the variations in the results consistently remain below 6%.
5. Results and Discussions
5.1. Effect of Outboard GF on Performance of J-Shaped SB-VAWT
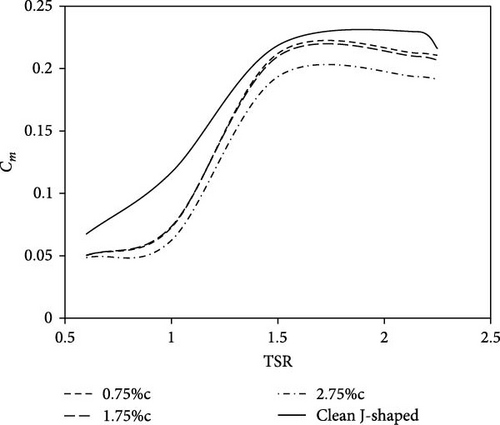
Figure 11 illustrates the variations in torque coefficient at different TSRs for a J-shaped SB-VAWT that is coupled with an outboard GF. The turbine blades under examination are equipped with three different heights: 0.75%c, 1.75%c, and 2.75%c. At a TSR of 0.6, the impact of the GFs remained very consistent, irrespective of their vertical height. As the rotational speed of the turbine increases and TSR exceeds 1.5, it becomes evident that the increased height of the GF has a negative effect on the produced torque due to the net increment in unfavorable drag force, particularly with the height of 2.75% GF. The important finding is the significant decrease observed in the overall performance of the turbine when equipped with the outboard GF, as compared to the case when the GF is removed. The decline in efficiency has achieved its maximum value at TSR = 1, indicating a reduction of 38%. Thus, the placement of the outboard GF at any height on the J-shaped blade is found to negatively affect the turbine performance.
5.2. Effect of Two-Sided GF on Performance of J-Shaped SB-VAWT
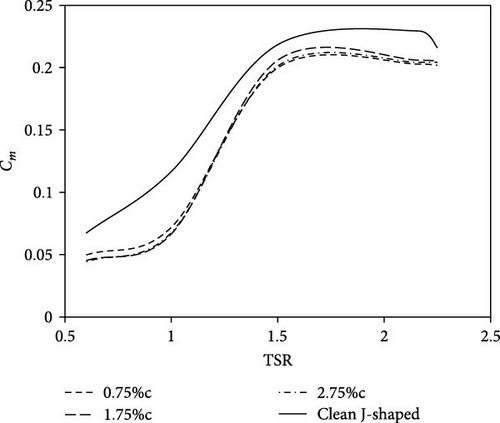
Figure 12 illustrates the variations in torque coefficient at different TSRs for a J-shaped SB-VAWT that is coupled with a two-sided GF. The turbine blades under examination are equipped with three different heights: 0.75%c, 1.75%c, and 2.75%c. The installation of two-sided GFs on the J-shaped blade, similar to the outboard GFs, leads to a decrease in turbine performance across all TSRs when compared to the clean J-shaped case. Nevertheless, it is noteworthy that the height of the GFs has an intriguing impact. At TSRs under 1.3, a shorter GF height produces more torque. Moreover, the analysis of two graphs pertaining to the height of 1.75%c and 2.75%c reveals that increasing the height of the flap does not result in a torque drop consistently. Rather, it has been observed that such an increase proves to become ineffective. At higher TSRs (>1.3), the impact of flap height exhibits a distinct trend, whereas employing a longer GF yields a greater torque. Based on the results, it has been concluded that the utilization of the two-sided GF at any height on the clean J-shaped blade fails to produce desirable outcomes.
For a deeper understanding, the torque produced by the clean J-shaped SB-VAWT and the turbines equipped with outboard and two-sided GFs as they undergo full rotation, spanning from 0° to 360°, are shown in Figure 13. They include different heights of GFs at five TSRs. The graphs reveal that at low TSRs (0.6 and 1), the equipped turbine experiences inconsistent fluctuations and produces negative torque in some regions, leading to initial starting torque issues, which is common for most VAWTs. Meanwhile, the turbine with a clean J-shaped profile shows more regular torque variations.
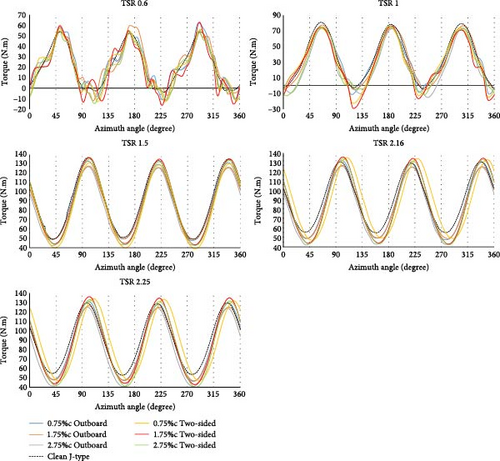
With closer inspection, it becomes evident that the turbine equipped with the GF produces greater torque than the clean J-shaped profile at angles close to 45°, 180°, and 285°. This is possibly attributed to the increased favorable drag force. However, once the flow separates at angles such as 100°, 225°, and 350°, the GF mitigates torque generation due to drag force in an undesired direction. The major difference in performance between the profiles is observed in these specific areas. The clean J-shaped profile seldom generates negative torque, but the equipped form yields substantial negative torque. At higher TSRs, the turbine’s production of negative torque has almost completely ceased. Nevertheless, the presence of the GF has an adverse impact on torque in regions where the turbine is experiencing stall. The aerodynamic reasons behind these observations are further elaborated in the following sections.
5.3. Effect of Inboard GF on Performance of J-Shaped SB-VAWT
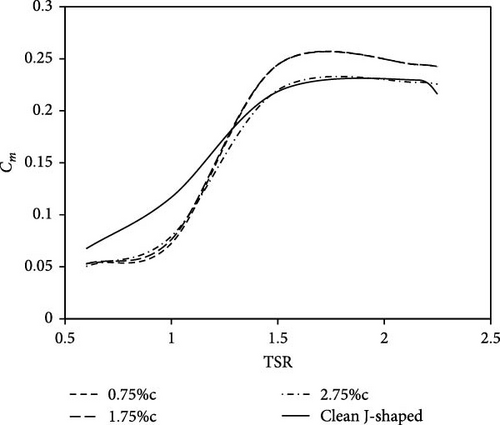
Figure 14 depicts the variations in torque coefficient at different TSRs for a J-shaped SB-VAWT that is equipped with an inboard GF. It is evident that for TSRs below 1.3, the torque coefficient of J-shaped SB-VAWT exhibits higher values compared to when an inboard GF is implemented. With regard to the findings discussed in previous sections, it can be assumed that the implantation of any type of GF on the J-shaped profile results in a decline in performance at low TSRs. At a TSR of 0.6, it can be observed that an increase in the height of the GF leads to a reduction in torque production. In general, when TSR is below 1.25, the performance of the turbine remains fairly consistent regardless of the GF heights. By exceeding the TSR of 1.25, the GF height prominently affects the turbine’s performance. It exhibits a favorable influence on efficiency and leads to an augmentation in the production torque. As indicated by the graph, the utilization of any inboard GF enhances the performance of the turbine during periods of high rotational speed. The highest improvement is achieved when 0.75%c GF is used. By using 1.75%c GF, a similar performance is recorded. Moreover, the installation of 2.75%c GF results in a reduction in the torque coefficient. Overall, the utilization of inboard GF, similar to other types, results in a noticeable drop in turbine performance when operating at low TSRs. With a rise in the rotational velocity, the inboard GF’s performance can be promoted. As given in Table 4, the torque generated by 1.5, 2.16, and 2.25 TSRs is 102.47 N.m, 102.45 N.m, and 101.75 N.m, respectively. Based on the findings at 2.25 TSR, the generated power experiences a 10%–12% growth with regard to the scenario where GF is not utilized. It can be concluded that the inboard GF greatly improves turbine performance in high TSRs.
| λ | Rotor rotational velocity (rpm) | Torque (N.m) | Power (W) | Power coefficient | |||
|---|---|---|---|---|---|---|---|
| Clean blade | Equipped blade | Clean blade | Equipped blade | Clean blade | Equipped blade | ||
| 0.6 | 30.97 | 28.28 | 22.14 | 91.7 | 71.82 | 0.04 | 0.032 |
| 1 | 51.62 | 48.99 | 30.43 | 264.84 | 164.5 | 0.116 | 0.073 |
| 1.5 | 77.43 | 91.64 | 102.47 | 743.07 | 830.87 | 0.328 | 0.367 |
| 2.16 | 111.50 | 96.24 | 102.45 | 11,123.65 | 1,196.21 | 0.495 | 0.528 |
| 2.25 | 116.14 | 90.63 | 101.75 | 1,102.26 | 1,237.53 | 0.486 | 0.546 |
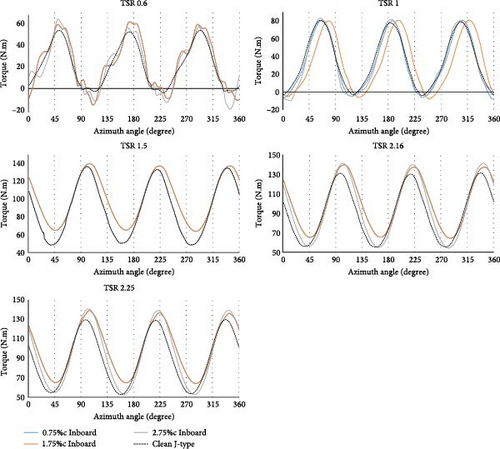
Figure 15 depicts the torque produced by the clean J-shaped SB-VAWT and the turbines equipped with inboard GF at different TSRs during full rotation from 0 to 360°. At TSR of 0.6, equipped J-shaped SB-VAWT experiences significant torque fluctuations, producing negative torque over roughly 120° of the rotation. The clean J-shaped design, which produces negative torque exclusively inside specific angles, outperforms equipped turbines at low TSRs. When the TSR is set to 1, there is a reduction in torque fluctuations. However, negative torque can still occur at certain angles. Notably, the turbine equipped with 2.75%c inboard GF has the worst performance when compared to other designs. As the rotational speed of the turbine increases, the fluctuations in torque become more uniform, and the generation of negative torque decreases. The inboard GF demonstrates ideal performance compared to the clean J-shaped profile at the angles of 100°, 220°, and 340° when torque production reaches its maximum. In contrast, when the turbine operates at angles of 45°, 150°, and 280°, which are associated with dynamic stalls, the GF has a negligible effect on turbine performance. The data suggest an enhancement in torque generation in high TSRs. In order to conduct a more in-depth analysis of fluid flow affected by various GF designs, it is crucial to investigate the pressure distribution surrounding the blades and the vortices downstream. The subsequent sections will provide supplementary findings to compare the wind turbine performance across all three GF designs.
5.4. Aerodynamic Analysis
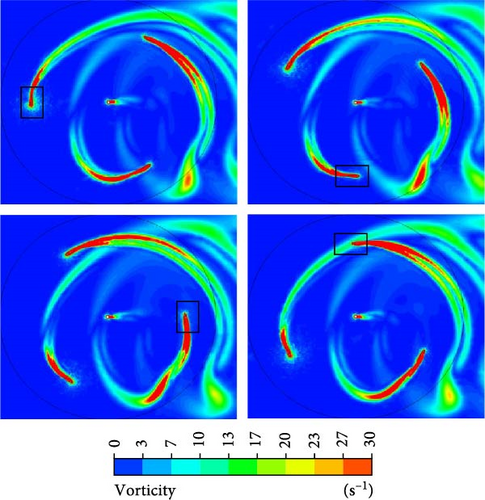
Figure 16 shows the vorticity field around the wind turbine at four separate times, corresponding to rotation angles of 0, 90°, 180°, and 270° at TSR of 2.25. In addition, the variations of the torque generation with the azimuth angle for a single turbine blade throughout a full revolution at 2.25 TSR are illustrated in Figure 17, which includes all three types of GFs featuring a height of 0.75%c as well as a clean J-shaped blade. The angle of rotation from 0° to 180° is commonly called the upstream region, while 180°–360° is called the downstream region. Based on McLaren’s observations [32], it was found that the low-pressure regions produced by the vortices on the surface of the blade in the upstream region move at a velocity equivalent to the rotational speed of the rotor towards the downstream area. The flow is guided and eventually undergoes separation from the blade. According to the vorticity field contours shown in Figure 16, it is visible that as the rotation angle reaches 90°, vortices begin to shed on the upstream region. As the rotor continues to revolve at a rotation angle of 180°, the vortices initiate detachment from the surface of the blade. The blade in the downstream zone is affected by low-energy flow coming from the upstream. Consequently, the torque generated by the blade is drastically reduced, and under certain angles of attack, it may even become negative. Furthermore, as the blade initiates its movement, which corresponds to an angle of zero degrees of rotation, it is situated in the dead zone. It is utterly influenced by the vortices in the upstream region. Zamani et al. [11] showed that the vortices created by the J-shaped profile are much smaller than the conventional DU 06-W-200 airfoil and are damped earlier. The vortex area behind the turbine is more limited, which reduces the vibrations and stresses on the turbine.
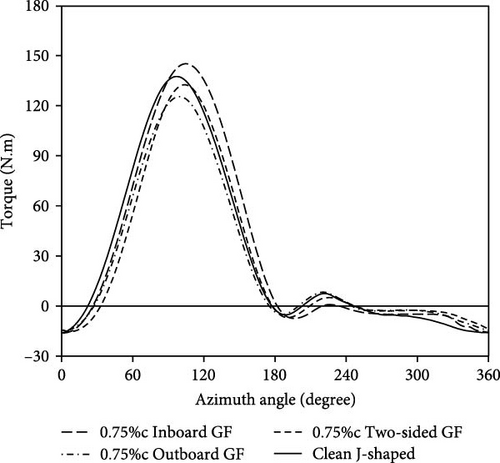
As can be seen in Figure 17, the torque generated for the clean and equipped blade is negative at the initial beginning angles of the movement. The unfavorable torque continues up to a rotation angle of about 20° for the clean J-shaped blade, while the blades equipped with GFs still produce negative torque up to higher rotation angles. The main reason is that the GFs act as a barrier against the wind blowing from the left side and cause a drag force in the unfavorable direction. The higher drag force of the two-sided GF, in contrast with the other two types, has prevented the blade from producing a positive torque until an approximate 32° rotation angle.
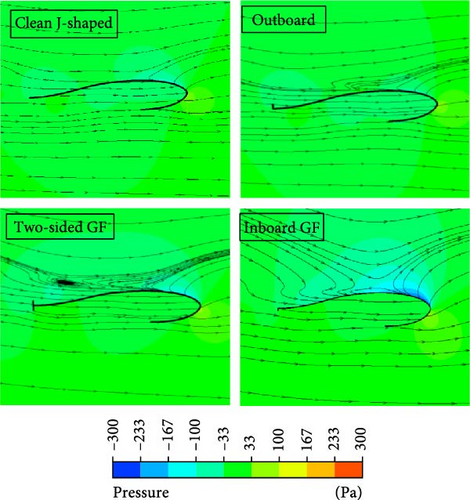
The gauge pressure distribution around the blade at a rotation angle of 0°, as depicted in Figure 18, exhibits that the net force does not align with the rotor’s rotational direction, yielding a negative torque. Besides, the influence of upstream vortices on the blade has been demonstrated at the current rotational angle. The utilization of the outboard and two-sided GF has clearly mitigated the pressure exerted on the pressure surface of the blade, leading to a reduction in the pressure gradient. Conversely, the implementation of the inboard GF has induced comparatively slight alterations to the pressure distribution. The streamlines indicate that flow separation occurs in a close vicinity to the blade leading edge.
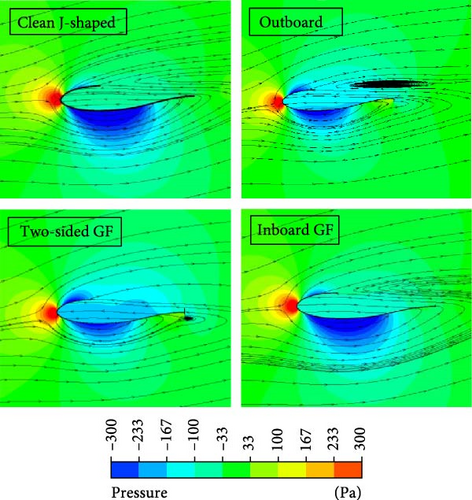
Before the clean J-shaped blade experiences dynamic stall around 95° rotation angle, the blades equipped with any type of GFs provide poor efficiency due to the fact that in the first half of the upstream region, GFs act as an obstacle toward wind flow and rotor movement. Although the primary effect of GFs over the first quarter is unfavorable, the results show that the flow separation is postponed. It is achieved through changes in the pressure distribution around the blade, hence reducing the reverse pressure gradient. The inboard GF shows the most effective performance. Particularly, the flow detachment occurs around 105°, indicating a delay of 14° in the dynamic stall. Figure 19 displays that at a rotation angle of 90°, the inboard GF properly guides the wind flow to be caught in the notch of the J-shaped blade, acting similarly to a Savonius turbine through the generation of drag force. Also, the pressure exerted on the pressure surface of the vane has increased, leading to an elevated pressure gradient. It is important to acknowledge that the two-sided GF shows comparable performance with its inner edge. However, the outside edge of the GF generates resistance similar to an obstruction in the direction of motion.

In the second quarter of the motion, when the flow is separated, the blade is in an ideal position regarding the wind direction to take advantage of the drag force. The GFs function as an obstacle to the wind flow again. Nonetheless, the drag force acts in the intended direction, which produces positive torque. Inboard GF operates more effectively than other types. By employing an outboard and two-sided GF, a vortex forms at the tip of the blade suction surface. This vortex intensifies the inverse pressure gradient, and the resulting force produces clockwise torque. As illustrated in Figure 20, the pressure distribution around the blade becomes almost uniform as the rotation angle reaches 180°. Thus, the positive impact of the blade is diminished. As the blade travels downstream, the eliminated surface of the J-shaped blade switches to the right side of the turbine, thereby is no longer in direct contact with the wind flow that blows from the left side and behaves like a conventional airfoil. In this region, known as the dead zone, the blade is exposed to low-energy wind flow. It can be seen in Figure 21 that the net force acting on the blade does not have a component to produce substantial torque around the rotor rotation axis.
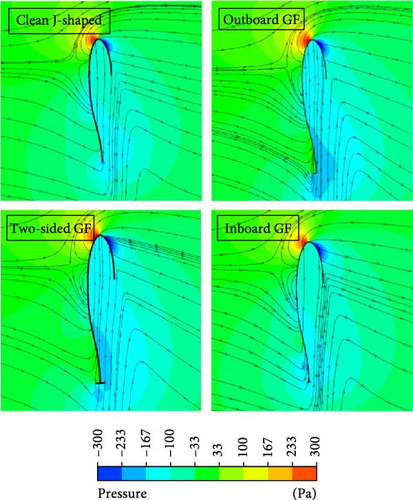
During the last quarter of the motion, the net force generates a clockwise torque due to the pressure distribution surrounding it. However, this can be avoided by employing GFs, which affect the pressure distribution, decreasing unfavorable torque.
6. Conclusion
In this study, a J-shaped SB-VAWT equipped with outboard, two-sided and inboard GF was numerically investigated in order to analyze the flow behavior under various conditions and find out the most appropriate configuration to improve the turbine performance. The results indicate that the formation of vortices in the upstream region and their propagation to the downstream region make the downstream low-energy and inefficient. Hence, the performance of the blade in the upstream region, particularly in the second quarter, holds significance in harnessing energy as it directly determines the overall efficiency of the turbine. By employing the inboard GF, despite a reduction in efficiency during the initial half of the blade’s motion in the upstream region, it effectively enhances the turbine’s performance in the latter half by harnessing the drag force in the desired direction where it is acting similar to a Savonius turbine. It postpones the occurrence of the dynamic stall up to 14° by reducing the reverse pressure gradient. The 0.75%c inboard GF, which recorded the best performance among the GFs, caused a drop in performance at TSRs of less than 1.3 but demonstrated its potential to enhance output power at higher TSRs. Moreover, the utilization of outboard and two-sided GFs of any height not only fails to enhance performance but also results in a decline in turbine efficiency across all TSRs.
Conflicts of Interest
The authors declare that they have no conflicts of interest.
Open Research
Data Availability
The data used to support the findings of this study are available from the corresponding author upon request.


