A MTInSAR-Based Early Warning System to Appraise Deformations in Simply Supported Concrete Girder Bridges
Abstract
This paper presents an early warning system to investigate deformations in simply supported concrete girder bridges over time, using the information content provided by satellite data, integrated with other available sources. The safety of the existing bridges is a priority for transportation management companies, which should carry out continuous and accurate monitoring campaigns, by exploiting traditional time- and cost-consuming activities that cannot be widely applied to a bridge portfolio scale. To reduce management costs and to define reliable prioritization schemes, new cost-effective technologies can be involved such as the satellite-based Multi-Temporal Interferometry Synthetic Aperture Radar (MTInSAR). This technique can represent a valuable option for observing the displacements induced by different actions and to relate the identified behaviour to possible or future fails. This paper presents an early warning system aimed at exploring possible anomalies in simply supported reinforced concrete girder bridges by efficiently elaborating MTInSAR, combined with additional data (e.g., environmental temperature and structural information knowledge). The proposed framework allows manipulating the persistent scatterers’ information to derive longitudinal and vertical displacements over time. These are compared to appropriate thresholds leading to potential early warnings aimed at supporting road managers in undertaking future surveillance actions. The proposed procedure was tested on a case study, defined according to the most spread typology of bridges in Italy. This application highlights the advantages of the proposed framework which allows for a cost-effective long-term monitoring with outputs that can be automatically updated over time and suitable for network-scale early warning detection.
1. Introduction
The socioeconomic development of humanity originating from inhabited centres has always required connection ways, which resulted in the construction of increasingly complex and extensive transportation networks. One of the most critical components of roadway and railway networks is represented by bridges and viaducts. Recent chronicles have shown the potential economic losses and the possible casualties occurring after the collapse of bridges, as for the Polcevera viaduct [1, 2] (2018, Genoa, Italy), or the Albiano-Magra viaduct [3] (2020, Albiano-Magra, Tuscany, Italy). Therefore, the technical and political debate about infrastructural safety cannot be focused only on the causes generating collapses and losses, but it raises the main principle of prevention. To practice prevention for existing bridges, it is worth considering that during their service life, these structures are subjected to actions and phenomena inducing displacements, material degradation, and structural decay. Among the main actions to consider, natural hazardous events can be mentioned, such as landslides, subsidence motions, earthquakes, and floods (e.g., [4–7]). On the other hand, within the service life of bridges, other exogenous actions can affect bridge safety and functionality such as the combination of traffic and dead loads, which increase the gravity actions on the bridges, and the environmental conditions (e.g., temperature, solar radiation, wind, and rain), which represent a silent enemy leading a slow but steady evolution of degradation phenomena like steel rebar corrosion, spalling in concrete elements, and bearing malfunctioning.
In this perspective, transportation management companies are obligated to monitor the health state of existing bridges and to employ appropriate policies of retrofit and rehabilitation, especially for the existing bridges that date to the second half of the 20th century and are approaching the end of their expected service life. To rule the operations by road management companies, the Italian Ministry of Infrastructures and Transports released in 2020 the guidelines on the safety assessment of existing bridges [8], which propose a multi-level approach to assess bridge screening and portfolio-scale risk and prioritize retrofit interventions considering structural, seismic, hydrological, and geological risks. The approach suggested by the Italian guidelines, as well as other international procedures, requires detailed time- and cost-consuming field surveys involving large efforts to be extensively employed on entire bridge portfolios. The existence of several factors limiting the efficiency of conventional bridge health state checks (e.g., inaccessibility of some elements and low frequency of inspections) and the necessity to reduce costs in near-continuous monitoring lead to the development of new and innovative technologies. The scientific literature proposes different structural health monitoring techniques, both traditional and innovative. Among the abundance of works about the topic, sensor-based systems (e.g., Ubertini et al. [9]), numerical/analytical models (e.g., Scozzese and Dall’Asta [10] and Morgese et al. [11]), machine learning algorithms (e.g., Xiang et al. [12]), and deep learning-based approaches (e.g., Cardellicchio et al. [13]) can be mentioned. Another potential option, deserving a relatively large research interest, is represented by interferometry via satellite-based Synthetic Aperture Radar (SAR) data to detect displacements related to scatterers on the Earth surface. Always taking as reference the Italian experience, the ReLUIS consortium (Network of University Laboratories of Seismic and Structural Engineering), supported by the National Research Council and the Department of Civil Protection, recently released a document [14] containing guidelines about the use of SAR data for structural evaluation purposes. The main advantages of this technique are the relatively low costs for the potential of continuous monitoring of large areas over a long-time range (limited by constellation activity period). At the same time, the information from satellite data can be used to monitor low-velocity deformations, which could not be directly appreciated in on-site surveys. Nevertheless, some limitations should be also considered by using SAR data, especially when monitoring deformable and temperature sensitive structures (see, for example, Ponzo et al. [15] for bridges). Generally, the occurrence of slow movements is due to different causes, e.g., landslides in progress and excursions of temperature, which can be currently monitored only through specific sensors. On the other hand, if specific elaborations are performed on SAR data, a valuable indication can be provided to management companies about ongoing phenomena, to activate reliable prevention strategies.
With this goal in mind, this paper presents a new early warning system based on Multi-Temporal Interferometric Synthetic Aperture Radar (MTInSAR) data, proposed with the aim of monitoring the ongoing deformation phenomena in single/multi-span simply supported prestressed/reinforced concrete (RC) girder bridges, within a bridge portfolio. In particular, the framework merges MTInSAR data with other sources of information, derived by environmental conditions and the knowledge of bridge structural details. The framework described in Section 3 is organized in consecutive steps: (i) data collection; (ii) bridge footprint definition and Persistent Scatterer (PS) selection criteria focusing on their attributes; (iii) Line-of-Sight (LoS) displacement time series; (iv) projection of LoS displacement vectors along the bridge main deformation axes, achieved combining acquisitions from ascending (ASC) and descending (DSC) datasets; (v) displacement time series decomposition using Seasonal-Trend LOESS (STL); and (vi) implementation of analytical models to define threshold values related to specific displacement components and belonging to bridge-specific displacement scenarios. All the above steps are implemented in a Python module, which is developed by the authors to support survey inspections, which enhances the structural knowledge of the bridge, and takes track of low-velocity deformation patterns. In Section 4, the framework is applied to a case study, representative of the considered structural typology, by using COSMO-SkyMed (CSK) satellite data retrieved from a five-year observation period. The systematic analysis of the retrieved longitudinal and vertical displacement time series highlighted the difference between the expected (i.e., based on design documentation) and the monitored behaviours. The further step involving the STL algorithm has figured out the overcoming of seasonal thresholds and an increasing seasonal displacement amplitude. Moreover, different behaviours are identified for the analysed spans thanks to the proposed bridge-specific displacement scenarios. In Section 5, conclusions are drawn recognizing the potential of the proposed framework, despite its assumptions and limitations. It is worth anticipating that the proposed method cannot be considered as exhaustive with respect to more complex and expensive monitoring approaches (e.g., sensor-based), given the inaccuracies that currently characterize satellite data. In fact, the proposed approach could be employed for the purpose of long-term monitoring of bridge portfolios, to perform a screening at disposal by transportation management companies. Thus, considering the MTInSAR technique as cost-effective, and the necessity of few additional data (e.g., structural information of bridges is usually available for management companies), the proposed system allows checking the occurrence of possible warnings whenever new satellite acquisitions are available (even though the frequency is still limited, typically two weeks). This represents the main potentiality of the proposed system, which can be systematically applied on different bridges within the network and then can allow performing prioritization and undertake reliable risk-mitigation strategies (e.g., ad hoc on-site surveys or specific sensor-based monitoring).
2. Background
This section provides a description of satellite data and the theoretical fundamentals about MTInSAR data and their applications on buildings, infrastructure networks, and bridges.
2.1. Principles of Satellite Interferometry and MTInSAR
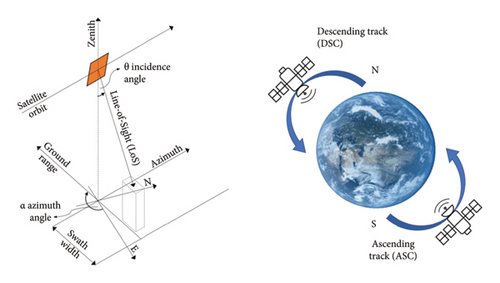
In the last decades, an increasing number of Earth observation studies have been provided, by employing satellite data for different purposes. This is mainly due to the increment of satellite constellations of different typologies. One of the most performing sensors is equipped on the CSK Second Generation, which became operational on 18 January 2021. Starting from the basics, satellites rotate around the Earth along near-polar orbits (almost oriented in the North-South, N-S, direction) that allow for revisiting the same scene at the same local solar time, according to two different acquisition geometries, that is, ASC and DSC (Figure 1(b)). SAR systems use a transmitter antenna that illuminates the scene on the ground with an electromagnetic wave along the LoS direction. This wave is partly absorbed and partly reflected by the transmitter antenna, which is equipped to receive signals. These antennas are designed for sending and receiving electromagnetic waves with predefined polarizations, such as single (HH or VV), double (HH, HV, VH, and VV), or quad-polarization, depending on the scene requirements (e.g., HH polarization tends to have better penetration in dense plant cover than VV [16]). The use of electromagnetic waves allows for acquiring data beyond the cloud cover, which makes the acquisition as independent on the atmospheric conditions. The SAR sensor, unlike a Real Aperture Radar one, moves during flight synthesizing an array of antennas. This difference ensures a greater spatial resolution in the flight direction of the satellite, called azimuth, leaving the resolution unchanged in the orthogonal ground range direction [17] (Figure 1(a)). In this reference system, the LoS direction is the one that identifies where the satellite is pointing during the motion, and it can be localized by defining some rotation angles. LoS is rotated from the Zenith by the incidence angle, θ, while it is rotated from the azimuth (almost coincident with N-S direction) by the azimuth angle, α (Figure 1(a)).
The satellite outputs obtained from different constellation data may show different spatial and temporal resolutions. Regarding the spatial resolution, this is linked to the wavelength of SAR sensor, named λ. In particular, the spatial resolution is inversely proportional to the radar wavelength, and this means that electromagnetic waves with a shorter wavelength achieve a better spatial resolution. Using X-band sensors, whose λ is almost equal to 3.1 cm, it is possible to acquire data with an extremely high resolution. Indeed, CSK SAR satellites can reach a resolution cell of 1 × 1 m covering an area of 10 × 10 km on SPOTLIGHT mode. Still to monitor small and large areas, outputs provided by Sentinel (SEN) satellites are adequate, C-band with λ ≈ 5.6, which can be exploited by opting for StripMap and EXTRA-WIDE SWATH modes, respectively. The first mode allows to achieve a 5 × 5 m resolution cell over an 80 km wide area on STRIPMAP mode, while the second one achieves a 40 m resolution for areas wider than 410 km. Generally, the former mode is not always a chance because it can be managed only on specific requests, while EXTRA-WIDE SWATH mode datasets are easier to be accessed. The temporal resolution varies according to the number of satellites actively running the constellation. The result is a quasi-continuous monitoring where the time between consecutive observations can be relatively short, but it is not continuous like real-time sensor monitoring. SEN constellation was composed of two satellites (i.e., Sentinel-1A and Sentinel-1B), which ensured a revisit time of 6 days. Nowadays, the Sentinel-1B has been over since 23rd December 2022, due to an anomaly in the power supply, and therefore, from that moment, the acquisition frequency has increased to 12 days. CSK constellation (first generation), composed of four satellites, can return acquisitions with a frequency ranging from 4 to 16 days. Another difference characterizing the two mentioned constellations is the orbital tube baseline, which is the space where flying orbits are constrained. The ability of the satellite to move within this region (rather than using a fixed orbit) provides an increased sensitivity of the terrain height [18]. Specifically, CSK satellites, which are guaranteed to be within ±1 km from the reference ground track, can reduce the errors in the estimate of the terrain height under 1 m. Some of this information, such as α and θ angles, is employed in Section 3.
Equation (2) suggests that DInSAR technique can track displacements up to the half of the wavelength, for a phase difference equal to 2π. In fact, as reported in several documents (e.g., TRE Altamira PSInSAR user manual [22] and Ponzo et al. [15]), a dLoS equal to λ/2 (for interferogram) is measurable without ambiguities (neglecting the limit case in which the displacement is exactly λ/2 where it would not be possible to detect any phase difference compared to the case of a stationary target). For example, taking as reference the Sentinel-1 constellation, working in the C-band with λ ≈ 5.6 cm, interferograms generated with their SAR images are capable of measuring dLoS equal to 2.8 cm. Furthermore, considering the double path of the radar wave, to distinguish between positive and negative displacements (coming closer and moving away from the satellite along the LoS, respectively), the limit to consider is reduced to λ/4. Hence, for the Sentinel-1 constellation and considering two subsequent acquisitions, the maximum observable displacement is equal to 1.4 cm. However, the phase difference obtained after removing the abovementioned contributions, that is, the one shown in equation (2), could exceed 2π value and then another step named “phase unwrapping” is required. The goal in this case is to calculate the additional phase jumps outside the wrapping range ]−π; +π] to obtain an accurate estimation of the relative distance travelled by the radar wave. DInSAR algorithms are susceptible to temporal decorrelation and atmospheric disturbances, which can degrade the quality of deformation measurements. MTInSAR overcomes these limitations by using data from multiple temporal acquisitions, which improves phase coherence over time and allows for a better separation of atmospheric effects from ground displacements. DInSAR is more suitable for applications that require high-resolution deformation measurements within a limited time frame or for analysing short-term phenomena, as it provides precise information from individual acquisitions. On the other hand, MTInSAR is preferable when the focus is on long-term monitoring and studying slow or gradual deformations over extended periods, as it offers a broader temporal coverage and enhanced accuracy by leveraging data from multiple acquisitions. The PS LoS displacement time series is measured with respect to a reference point which is assumed stable in time in the entire image stack for a given area. The same time series are characterized by an uncertainty of ±5 mm for displacements and of ±1 ÷ 2 mm/y for velocities [20].
From the application of MTInSAR algorithms, each point PS/DS is characterized by the following attributes: georeferenced position, defined through Latitude (Lat), Longitude (Lon), and Height, according to the WGS84 geodetic reference system, LoS displacement time series, average velocity along the LoS, VLoS, for the entire period, and coherence. This latter parameter quantifies the consistency of the estimated LoS displacement time series with a mathematical model based on φ used in the specific algorithm. The coherence value ranges between 0 (low coherence, not reliable result) and 1 (high coherence). In structural monitoring applications, to avoid unreliable estimates, a threshold should be fixed for this attribute, depending on the type and the quantity of data at disposal.
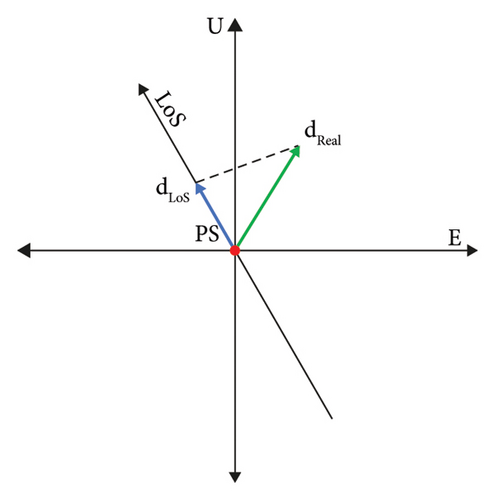
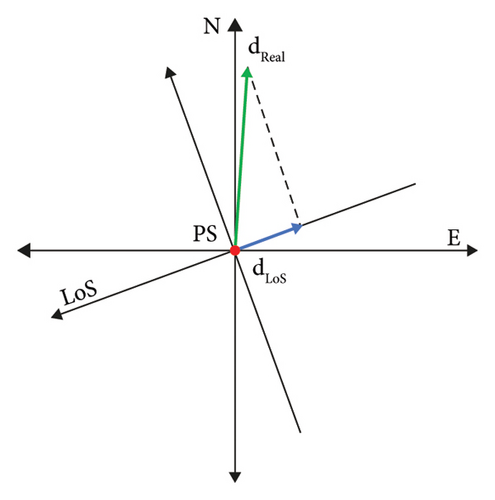
Concluding this section, the LoS displacement represents the projection of the real displacement along the LoS itself (Figure 2). Hence, due to satellite near-polar orbits, it is not possible to evaluate displacements that occurred along the N-S direction (Figure 2(b)), while results can be reliably obtained in West-East (W-E) direction. Finally, for convention of sign, a positive value of the LoS displacement is assigned if the detected motion approaches the satellite along the LoS direction.
2.2. State of the Art on the Use of MTInSAR for Monitoring Structures and Infrastructures
In this section, a short description of the applications of MTInSAR for structural quasi-continuous monitoring is provided. As the main field of application, MTInSAR procedures are suitable for studying slow kinematic phenomena, such as landslides [23, 24] and subsidence [25, 26], occurring in large areas. Several studies apply MTInSAR to monitor transportation infrastructure networks. For example, Fiorentini et al. [27] focused on mapping and predicting the surface movement of road infrastructures over a wide area in the Province of Pistoia, Italy. Macchiarulo et al. [28] proposed a semiautomatic GIS-integrated methodology, whose capability was demonstrated in two real case studies in United States and Italy. MTInSAR is also used to identify the effects of landslides and subsidence on the existing building stock. Di Carlo et al. [29] discussed about the settlement evaluation of two case studies of RC buildings in Rome, Italy, by means of CSK imagery collected along ASC and DSC orbits. Miano et al. [30] and Infante et al. [31] used numerical models for infilled RC frame buildings to find a numerical correspondence between the landslide-induced displacements measured via MTInSAR and the damage detected on the buildings. Other studies deal with MTInSAR monitoring of critical structures such as dams [32, 33]. On the other hand, of interest for the scope of this paper are the works using MTInSAR for bridge monitoring.
Moving on to bridge SHM and looking at bridge portfolios, Peduto et al. [34] formulated a procedure to investigate bridge settlement-induced damage via empirical fragility curves in Amsterdam city which are calibrated by using MTInSAR measurements and damage detected on-site. Nettis et al. [35] proposed a methodology based on an automatic geoprocessing pipeline, aimed at automatically interpreting bridge-specific displacement scenarios and for providing monitoring/assessment priority classes via MTInSAR. The methodology was applied to two highway networks in Italy by using SEN and CSK satellite datasets. Del Soldato et al. [36] monitored a roadway multi-span RC bridge in the harbour of Valencia, due to opened joints and damaged pavement in the abutment-embankment transition area. The InSAR analysis was used to show values of displacements higher than 20 mm in a four-year range period. Hoppe et al. [37] presented two post-tensioned bridges in Virginia, U.S., monitored through TerraSAR-X data. The results of the investigation showed that there was no evidence of permanent bridge deformations. Giordano et al. [38] used satellite data and principal component analysis for the purpose of bridge damage detection. The authors developed a framework, which evaluated displacement time histories by removing environmental conditions. The effectiveness of the method was assessed by applying the proposed methodology on a real steel truss bridge located in the Rome area, which was subjected to subsidence-induced deformations. Markogiannaki et al. [39] investigated MTInSAR potentialities to support bridge visual inspections, through an application on a bridge located in Greece. D-TomoSAR advanced technique was employed to achieve crucial conclusions on the performance and traffic capacity of the asset. Decoupled displacements suggested an evolving deformation of 1.8 mm/year for an absolute value of 9.5 mm that, according to authors, can be related to evolving degradation phenomena, as confirmed by on-site inspections.
Other studies focus on analysing the thermal behaviour of a given bridge based on MTInSAR measurements [40–43]. For instance, Cusson et al. [44, 45] applied RADARSAT-2 data and on-site sensor-recorded temperature to evaluate the structural behaviour of a bridge located in Canada. The bridge finite element (FE) model was used to apply recorded temperature data for evaluating the bridge thermal sensitivity to longitudinal displacements. Using a linear regression, the same parameter was also evaluated on satellite displacements. The InSAR displacement thermal sensitivity data were then evaluated and matched between the two elaborations.
Some studies focus on the identification of displacement precursors of bridge collapse. For example, Selvakumaran et al. [46] analysed an arch bridge in U.K. that partially collapsed after a period of severe rainfall and flooding. Analysing the LoS displacement time series of the points located near the collapsed pier, the authors identified displacement outliers in the last two acquisitions before the collapse. The outlier definition was based on the statistical analysis of the displacement data, giving high relevance to the values exceeding three times a fixed interquartile range. Farneti et al. [3] dealt with a framework to evaluate displacements in multi-span bridges by means of MTInSAR. Starting from the decomposition of LoS displacements to longitudinal and vertical components, they accounted for systematic and random errors, depending on the precision of the first LoS measurements and the plane in which the deformation was assumed. The methodology was applied to the Albiano-Magra Bridge, exploiting a five-year period of satellite data. Macchiarulo et al. [28] identified several PSs with VLoS values lower than −6 mm/y in the area near the Himera viaduct, which partially collapsed in 2015. Of interest are some studies about the Polcevera viaduct (Genova, Italy) collapse. Milillo et al. [1, 47] employed a modified version of an MTInSAR algorithm to evaluate relative displacements, observed over the five-year period before the collapse and referred to a reference point belonging to the bridge deck. In this way, the authors focused on differential displacements along the suspended part of the bridge, which resulted to present a maximum velocity of 14.1 ± 7.5 mm/year. Instead, Lanari et al. [2] recorded, by a different algorithm, a lack of coherent scatterers in the central part of the bridge affected by nonlinear displacements, evidence attributed to vibration effects and wind.
At the end of the literature review, several reasons motivating the use of InSAR for bridge monitoring can be highlighted. First, this approach requires a relatively low-cost information source, considering that, for example, SEN data are completely free [48]. Second, depending on the microwave sensor band, X or C, a different spatial resolution and measurement accuracy can be achieved, which makes the InSAR techniques suitable for both large- and local-scale analysis. Finally, a multi-year stock of data is available for analysis (limited by constellation activity period), which allows users to assess possible events on the focused area counting on an acquisition frequency spanning from 6 to 14 days. Most of the reported research studies focus on well-known or well-defined case studies to investigate the use of SAR data from a single facility perspective. Hence, such techniques might not be extensively generalizable for bridge portfolio monitoring applications. For this reason, with the aim to overcome these limitations, an early warning system is proposed and implemented in a Python module, to be used on a specific bridge typology, single/multi-span simply supported prestressed/RC girder bridges, as the most spread in Italy.
3. MTInSAR-Based Early Warning System: A Framework Proposal
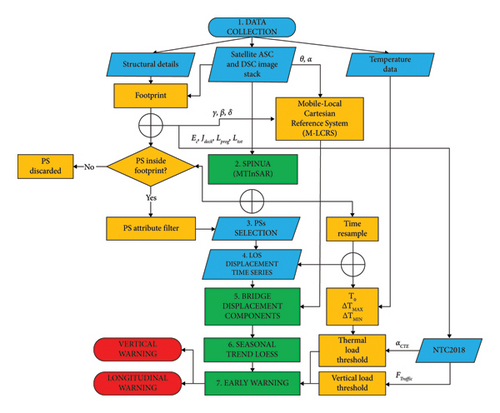
In this section, the framework of the proposed MTInSAR-based early warning system for the purpose of bridge monitoring is described. The main aim of the procedure is to provide support for the structural quasi-continuous monitoring via MTInSAR, by exploiting and elaborating other poor data. This can confer a standardized and reproducible approach for the considered structural typology (i.e., single/multi-span simply supported prestressed/RC girder bridges). The proposed framework is structured as reported in Figure 3. The idea behind the procedure is also covered by the Italian patent request n. 102024000002389, entitled “Metodo di early-warning per predire il comportamento strutturale di ponti esistenti basato su dati MTInSAR,” date of filing: 06 February 2024.
3.1. Data Collection
Single or multi-span simply supported RC girder is the most spread constructive typology for existing bridges built in the period 1950–1990 in Italy and Europe. Span length can extend up to 40–50 m, and they are built through cast-in-place elements (generally) up to 30 m, while prestressed beams are used for longer span lengths. Usually, the superstructure is characterized by longitudinal girders connected by transverse beam elements (diaphragms) and an RC slab. To transfer forces and displacements from superstructure to substructure components, such as piers and abutments, bearing devices are used. In simply supported girder bridges, expansion joints allow relative displacements and rotations between adjacent decks under service loads, while guaranteeing continuity of the road surface for the comfort of travellers. Considering service conditions, as the ones in which no hazards occur, simply supported RC girder bridges present deformations in longitudinal, transverse, and vertical directions. With a certain degree of simplification, the vertical displacements can be related to traffic loads acting on the slab, and gravity loads, while longitudinal and transverse displacements are mainly related to the environmental conditions (e.g., temperature and solar radiation). Longitudinal displacements are mostly concentrated in the support zones, while transverse displacements can occur from the bridge centreline to the end of the transverse section.
The proposed framework is based on the analysis of such displacement patterns which are characteristics of simply supported girder bridges. To develop the proposed framework, some initial information is required. In detail, satellite data are required as well as a generic MTInSAR algorithm. With this regard, image stacks acquired according to both ASC and DSC acquisition geometries are needed for a given period at disposal. Since bridge monitoring via satellite data requires a high level of spatial detail and displacement accuracy, the use of satellite imagery acquired with the highest available resolution is recommended (e.g., CSK X-band sensor data working in StripMap HIMAGE mode) [37].
Furthermore, to apply the framework to a specific bridge, the knowledge of poor, easily accessible, structural details is required. As minimum requirements about the information to gather, it is necessary to dispose of (a) the bridge coordinates, to match satellite data with the position of the structure; (b) the height above sea level (a.s.l.); (c) the number of spans and the longitudinal-transverse dimensions of each span, to identify the planimetric extension of the structure; (d) the deck cross section geometry, to identify the distribution of beam elements; and (e) the number of bearings and their arrangement as movable and fixed supports. In the case in which beams are placed on unbonded old elastomeric supports, the higher the rubber layer thickness, the lower its stiffness at the translation (with the same shear modulus), and then a higher displacement is allowed. This information is easily accessible if original design documents and drawings are available. Indeed, from the management companies’ point of view, such data should be available before performing any type of prioritization procedure, as recommended by the Italian guidelines [8]. When the abovementioned structural data are lacking, some limitations can characterize the proposed approach and then some hypotheses must be introduced, by employing other sources of data. For example, beam RC cross sections could be assumed through a fast on-site survey. Obviously, the lack of information could reduce the reliability of the framework output, considering the necessity to account for some hypotheses.
In addition to structural data, the last source of information to retrieve regards the temperature data, which is required to describe the bridge thermal behaviour (see Section 3.7). As shown in Figure 3, temperature data are used to define the temperature on the first acquisition date, T0, and the maximum and minimum temperature delta, ΔTMAX and ΔTMIN, respectively. These constant temperature deltas, calculated as the difference between TMAX (or TMIN) and T0, are referred to as the hottest and coldest satellite acquisition days. Ideally, this information should be captured by sensors placed on bridges to recreate the real temperature profile along the vertical section of the deck, possibly one acquisition for each span considering the different environmental conditions induced by the shade of the vegetation, which could reduce the solar radiation impact. In addition, the sensor sampling frequency should be equal to the satellite one. Since few bridges are equipped with these types of sensors, another source of temperature data could be explored, that is, the one obtained from weather stations close to the location of the bridge. To define reliable estimates, the distance between the station and the bridge should not exceed 10 km, to foster the representativeness of data, especially for complex topographic areas. This solution is less accurate than the sensor-based one because the air temperature is different from the one registered on the road pavement, and the solar radiations influence the deck temperature profile. A third option is given by the application of mathematical models, such as the cosine temperature model [49]. The latter, fitted over weather station data, could help to reconstruct the temperature values along the interested period.
3.2. SPINUA Interferometry Analysis
Once satellite data are available, a processing technique must be selected to derive LoS displacement time series and velocity VLoS. For the case at hand, the Stable Point INterferometry even over Un-urbanised Areas (SPINUA) technique [50] was employed. As main advantage of the selected algorithm, SPINUA is suitable for many monitoring applications involving landslides, subsidence, earthquakes, and unstable infrastructures. Furthermore, it was validated with on-site measurements [51, 52] and cross-compared with other MTInSAR techniques [53, 54]. A detailed description of the technique can be found in [50], while a short description is herein provided. SPINUA algorithm analyses input Single-Look-Complex images and a coarse digital elevation model of the area under investigation. Slave images are co-registered and hence superimposed on the master image by using precise orbit information and the input digital elevation model [55]. According to the description provided in Section 2.1, SPINUA adopts the MTInSAR processing chain, which is applied to generate a stack of differential interferograms calibrated to detect potential scatterers, both for PSs and DSs [20]. Then, an atmospheric phase filtering is applied to remove atmospheric and orbital artefacts. The obtained phase information for PSs and DSs candidates is combined with a robust Kriging-based interpolation [56], providing a resulting image stack that is analysed to identify final scatterers and to estimate the height and LoS displacement time series. The reliability of the estimation is determined by inter-image coherence (or temporal coherence). Proper thresholds of this parameter are identified on the base of the monitoring period, the number of images and their distribution in the perpendicular/temporal baseline plane. In the end, for each scatterer, the main parameters and attributes are obtained (i.e., Lat, Lon, and VLoS). An accurate parameter setting (e.g., the ones regarding the atmospheric phase contribution) allows for reaching an accuracy of 1 ÷ 2 mm/y for the velocity output, for points 5 km far from the reference point. For the application of the proposed framework, the authors recommend the use of only PSs, given that (a) DSs refer to more pixels than PSs and can refer to bridge areas characterized by different structural behaviours (i.e., those close to pinned and roller supports); (b) considering the overall dimensions of the bridges, very few DSs belonging to the bridge could usually be identified, making the further analyses statistically inconsistent.
3.3. Bridge Footprint Definition and PS Selection
- (i)
“H_GEO,” which compares the height attribute of each PS to the bridge information about height a.s.l. As pointed out by Talledo et al. [58], since the PS position is evaluated with respect to that of the reference point, a potential uncertainty in its estimation has a uniform impact on all PSs. Hence, all pixels could be affected by the same rigid translation whose value can be different for ASC and DSC datasets. This height shift is computed as the difference between the bridge height a.s.l. (or its average value if it is sloping) and the PS average height. The PS is selected if its biased height value is included between the bridge height above computed, added, and subtracted from a quantity related to PS height uncertainty, as explained in Section 2.1. For CSK datasets, this value amounts to 1 m.
- (ii)
“COH,” which excludes PS characterized by coherence values lower than a fixed threshold. This threshold should be empirically set up by considering the characteristics of the processed image dataset, such as the number of SAR acquisitions, the overall time interval, and the sampling time of the available acquisitions [59]. The available literature suggests assuming coherence threshold values ranging from 0.45 to 0.8 [1, 29, 42, 44, 45, 47].
- (iii)
“V_LOS,” which evaluates the distribution of VLoS attribute and returns only points whose VLoS value is between 5% and 95% percentile. With this regard, Giordano et al. [38], assuming the VLoS standard deviation (σLoS), employed a threshold of ±2σVLoS to discriminate PS belonging to the structure. The σVLoS value was referred to as the VLoS values estimated over 2 years for which the bridge is considered in a healthy state. Since neither prior information is required nor preliminary evaluations are performed about bridge healthy state, a larger threshold is fixed to prevent information loss gained by PS characterized by high VLoS values.
A combination of the presented criteria could also be considered for densely populated datasets, paying attention to not excluding representative points and not excessively reducing the number of available PS for the applicability of the next steps. The authors suggest linking all the above criteria in a hierarchical order as follows: “H_GEO,” “COH,” and “V_LOS.” The “H_GEO” criterion is considered by the authors as important as the “POS” one because it is also related to the bridge location, and for this reason, it should be used as first. Secondly, a coherence threshold equal to 0.65, according to the specific SPINUA recommendations, must be fixed to avoid PS not adhering to the adopted φ model in the MTInSAR algorithm. Lastly, “V_LOS” could be used to exclude PSs characterized by high-velocity values, which are reasonably not representative of the possible undergoing phenomena (e.g., values ten times higher than the average). It is worth noting that the proposed approach to select PSs does not involve specific clustering techniques (e.g., K-means), which could be especially used for large-scale monitoring of structures in urbanised areas. For example, Mele et al. [59] proposed the Density-Based Spatial Clustering of Applications with Noise clustering technique, which allows a suboptimal attribution of PSs to specific buildings in aggregate contexts.
3.4. LoS Displacement Time Series
Once the PS candidates are selected, the phase for computing displacement time series can be initialized. The first step involves the interpretation and the combination of the ASC and DSC dataset acquisitions, which are available for different PSs. Indeed, the PSs from ASC and DSC geometry are different because the points recognized by the MTInSAR algorithm on these image stacks do not overlap. This happens for at least two reasons. First, the satellite images are different due to the satellite right look view in both geometries which makes the scene different. Second, image distortions are different, as well as the θ angle. Therefore, the identification of unique PS pairs is required to represent the same point in the scene. Di Carlo et al. [29] suggest comparing the mutual distance between PSs with the position accuracy and selecting PSs presenting the first parameter lower than the second one. This approach was provided for the purpose of building applications, but it cannot be applied to the bridge case. Indeed, in the case of mismatched points, despite the mutual distance is lower than positioning accuracy, the PSs could belong to some parts of the bridge, which may be characterized by a different displacement behaviour (e.g., one PS is located above a fixed bearing, and one is located above a movable one). To overcome this problem, a position-based clustering method is proposed, which neglects PS geo-positioning errors. The footprint is divided according to the span positions concentrating half extra bridge length, due to “POS” criterion, to the side spans (or to the only one if a single-span bridge is analysed). Then, the span is considered as a reference unit and its centroid is characterized by the average displacement time series of all previous selected PSs falling within it. In this way, the influence of the false-positive PSs representing points outside of the bridge is minimized.
Depending on the number of PSs in each dataset and on their spatial distribution, a more refined subdivision can be processed, as shown in [3, 38]. This subdivision can be processed to define homogeneous subregions in terms of expected structural behaviour. Hence, the footprint of each span should be divided along the side of the longitudinal axis into subregions, with a minimum of 3 parts. Given the investigated structural typology, of interest are the parts close to the bearings, which behave in a certain way under service conditions and the central parts (i.e., middle-span), which differently behave from the previous ones (see Section 3.7). Obviously, the resulting subregion size cannot be lower than the satellite image resolution since PS is unique within the resolution cell. In the case of high PS density, a further subdivision can be performed, orthogonally to the one just defined. Again, this additional subdivision must be avoided for a deck having a width lower than twice the resolution of the cell. The main difference between these analysis solutions lies in the hypothesis on the transverse behaviour of the viaduct. In the case of transverse subdivision only, the flexural behaviour of the deck is assumed to be described by the hypothesis of infinite flexural stiffness of transverse diaphragms in their own plane. This implies the absence of differential displacements between the two outer regions of the transverse subdivision. Conversely, also considering the longitudinal subdivision, it is possible to assume that differential displacements occur.
Another aspect to highlight is the time shift occurring among ASC and DSC acquisitions. This is due to the operativity of the adopted sensors, which is characterized by two orbits that do not revisit the same scene on the same day. To address this difference in terms of time, the first solution is the one proposed by Talledo et al. [58], which resampled one time series on the temporal baseline of the other one, by using a linear interpolation of the missing values. This solution is reliable for two datasets presenting a low time lag between them (e.g., SEN datasets with six days of time interval) and a regular sampling frequency without missing values. A second option is provided by the Nyquist–Shannon theorem, which can be applied to resample a nonuniform sampled series, starting from the average sampling time. The main disadvantage of the above techniques lies in the loss of real acquisitions from one of the two datasets. To overcome this limitation, another resampling approach can be mentioned, where both acquired time series are merged to consider an “enlarged” temporal baseline. This latter extends from the further last acquisition to the closer first acquisition and missing values are estimated through a linear interpolation among consecutive measures. The criterion to select the first and the last dates is not random, and it is formulated to avoid interpolations where data are missing (e.g., back interpolation from closer to further initial dates). In this way, the information contained in all the acquisitions is preserved and the new values are coherent with the acquisitions. This approach was adopted in the proposed framework, and it also considers the possibility that the initial acquisition, in one of the resampled time series, is characterized by a nonnull displacement value. As suggested in [29], in this case, the entire time history can be depurated from this nonnull displacement value.
At this point, ASC and DSC displacement time series could be combined, but some considerations should be highlighted starting from LoS values. Assuming for the sake of simplicity, that both acquisition geometries present the same θ angle, if VLoS values have the same magnitude and the same sign, the PS is moving upwards or downwards, depending on the LoS acquisition sign and the abovementioned sign convention. Instead, in case of opposite signs between measures, the movement is along E or W. In most cases, ASC and DSC displacement vector modules are not characterized by the same values and the result is like the one shown in Figure 4. This observation can be used with ASC and DSC VLoS values to estimate the prevalent displacement component over the observation period, although not very accurate.
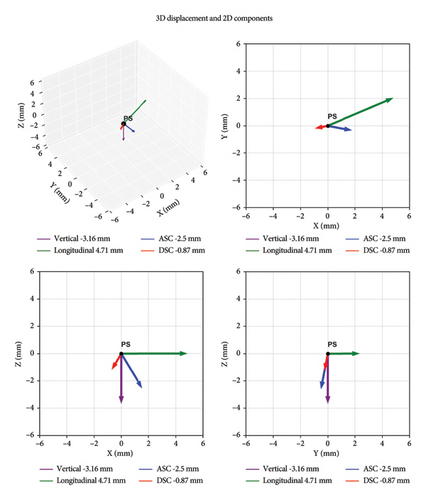
Finally, it is worth specifying that each displacement measure (along the LoS, for both acquisition geometries, and the ones derived from further elaborations) is referred to the master image, which, in turn, reflects an initial specific deformed shape that is unknown. If on one side, the information about the initial deformed shape could be important, on the other side, the proposed procedure aims at assessing the evolution of the deformation over time. Hence, as can be observed later (see Section 3.7), the comparison of the deformation with the proposed limits could reveal the occurrence of permanent anomalies, which do not depend on the initial deformed shape.
3.5. Displacement Time Series Analysis for Bridge Monitoring
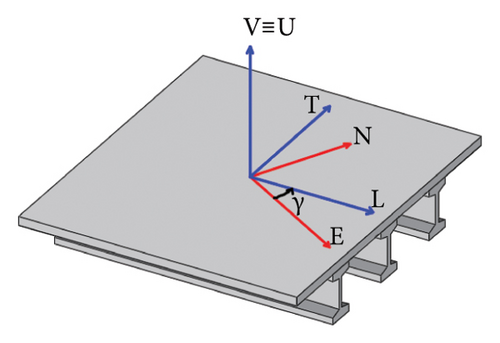
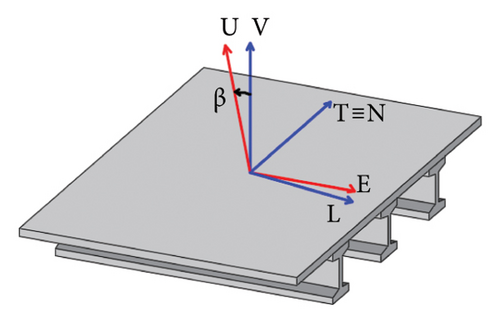
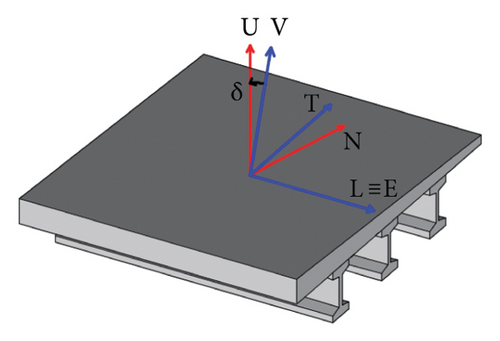
Equation (11) presents three unknown terms, that is, dL, dT, and dV. These latter represent the components of the assumed real displacement along the new reference system axes. To find the three unknown values, three LoS acquisition datasets from different geometries should be required (e.g., imagery corresponding to a higher incidence angle or left-looking geometry, in addition to conventional ASC and DSC acquisitions). Considering that only two datasets (e.g., ASC and DSC) are usually available, one of the displacement components can be neglected to solve the system. Among the candidates, the negligible component is assumed the transverse one (dT) since temperature effects are prevalent along the longitudinal direction (L). The two remaining unknowns are calculated for each subregion updating rotational matrix values (equations (8)–(10)), according to subregion directions, defined by the angles γ, β, and δ (Figure 5). The above matrices describe the rotations RV, RT, and RL along the local axis V, T, and L, respectively. γ is considered positive from E to L clockwise, or negative if accounted counterclockwise, as well for β and δ from V to U. These angles are limited between 0° and 180°. The use of rotational matrices to project dLoS along M-LCRS (referred to the main axes of the bridge) instead of simpler E-W direction allows estimating more accurate time series components of the bridge displacements [14]. To conclude this step, the hypothesis of transverse negligible displacement is not valid in the cases of N-S orientation (or nearly N-S) since the LoS projection of the longitudinal displacements is almost equal to 0, due to the satellite acquisition geometry. In these cases, the transverse displacements can be evaluated and compared with proper thresholds referred to the abovementioned service condition. The described steps can be then repeated for each acquisition, to obtain L and V time series.
3.6. Seasonal Trend Decomposition

- (i)
Perform a weighted moving average (LOESS) on the original time series, to estimate the local trend.
- (ii)
Depurate the estimated trend from the original time series and estimate the seasonality and noise components. This step can be iteratively performed to improve the accuracy of the seasonal estimation.
- (iii)
Apply the LOESS algorithm to the seasonality and noise components, to estimate the local seasonality component. The local component represents trends that may differ from year to year, adapting to the specific conditions of the data under review.
- (iv)
Derive the noise component, as the difference between the estimated seasonality component and the ones obtained from the previous step. The difference represents the residual decomposition error, named the remainder component.
Considering that STL method is applied to historical series characterized by a regular sampling frequency, but MTInSAR algorithms could provide irregular sampling frequency, a time resampling is required. Hence, to prevent data loss and simplify the definition of the next parameter, a one-day linear resampling is suggested. Moreover, the number of observations describing the seasonal component is the second parameter to define and its value is fixed according to the sampling frequency of the time series.
Without evident structural damage, landslide, or subsidence phenomena, the displacement time series should present seasonal fluctuations under service conditions (e.g., thermal and traffic/gravity loads), with an average value that can be assumed equal to zero [38]. However, since landslide and subsidence are common phenomena, part of the measured displacements can be related to the above geo-hazard components. Hence, the seasonal component is useful for understanding the bridge behaviour concerning service conditions, while trend components could give information regarding geo-hazards or ongoing structural damage.
3.7. Definition of Early Warning Thresholds
Once displacement time series for bridge regions in both the bridge main directions are available together with their components, such outcomes can be compared with appropriate displacement thresholds. Those thresholds are defined to automatically check if the focused bridge conditions present an unexpected behaviour. Those thresholds are assumed for defining a sort of limit for the displacement components. It is worth noting that the output of the proposed procedure cannot be mistaken for a structural analysis of bridges in the investigated portfolio, but it can provide insights towards the ideal behaviour that bridges should exhibit during their service life. In addition, considering the impossibility of knowing prior real input loads, the output of the proposed methodology reveals the current performance and the displacement trend to compare with the imposed limit (i.e., threshold).

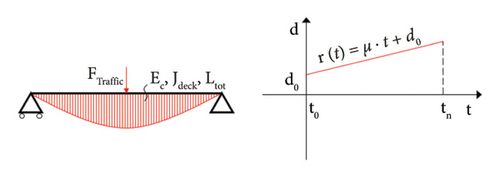
About vertical displacements, as just stated they are related to loads acting in the vertical direction (e.g., self-weight and traffic loads) and are influenced by material degradation and environmental conditions (e.g., temperature and subsidence). Exploring in detail each factor, gravity loads increase during the bridge service life and usually the effect for the considered structural typology is a higher vertical deflection at midspan. Some causes could be identified for the increment of gravity loads, such as the replacement of old road barriers with new concrete jersey ones, or addition of new bitumen layers to the road pavement. At the same time, the increase in material degradation affects the vertical deflection of gravity loads, amplifying the vertical component of the time series. Also, environmental conditions could change the vertical deformation of the bridge, as occurs for the temperature excursion that produces a seasonal upwards or downwards of the vertical deflection at midspan in summer and winter, respectively. This effect is due to a nonuniform temperature profile along the vertical deck section and to the variation of the stiffness characterizing bearings. For the investigated bridge typology, the variation of the vertical component due to the temperature is limited and is also influenced by the solar radiation excursion. It is clear that this kind of information can be retrieved via a specific sensor-based system able to measure temperature variation over the vertical section of the deck, and this is not always possible. In addition, other boundary conditions affecting the bridges (e.g., subsidence and hydro-geomorphological actions) can produce uniform or differential displacements between the subregions of the same span [36, 44]. The observation of differential displacements can highlight the presence of other phenomena, such as discontinuities between abutment and embankment or between the decks of two adjacent spans. Instead, uniform displacements reveal vertical discontinuity on structural elements.
Considering the different displacement scenarios and the impossibility to a priori know the real input loads, two thresholds can be defined, associated to three bridge-specific displacement scenarios. First, for each subregion, a linear trend is fitted, according to the Least Squares Regression method, on the vertical trend component, Tr, as retrieved from Section 3.6. Then, the slope of the regression line, μ, is multiplied for the acquisition time interval to obtain a vertical cumulative displacement, δi, to be evaluated for each ith subregion of each span.
- (1)
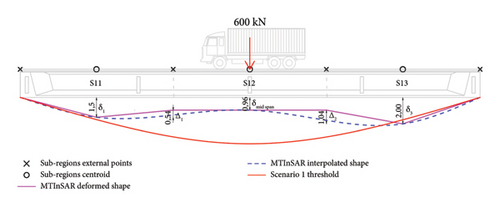
Increasing midspan vertical deflection, δmid span, due to material degradation and gravity loads described by , and (∑i|δi|)/n ≤ 2|δmid span|/3. The last condition is necessary to differentiate this scenario with the next one, where in this case (Scenario 1), the parabolic deformation of the span is more emphasized as observed in Figure 8, on the left-hand side.
- (2)
Subsidence, shown in Figure 8 (in the centre), where a uniform vertical displacement profile is described by ∆sx ≥ 0, ∆dx ≤ 0 and (∑i|δi|)/n ≤ 2|δmid span|/3. In this case, the last condition is used to describe a quasi-linear deformation of the span.
- (3)
Differential displacement (Figure 8, right-hand side) where ∆sx and ∆dx are both higher or lower than 0.

Scenario 1 is compared with the first threshold, whose value considers the occurrence of both damage and material degradation. This displacement, which occurs under service conditions, is considered critical if recognized as inelastic deformation due to aging, material degradation, and gravity loads. Hence, a warning is raised if δmid span observed by Scenario 1 exceeds dservice. Scenario 2 is achieved when the average value of |δi| for a single span exceeds the second threshold. An average value of |δi| lower than the threshold highlights that the bridge is not subjected to critical displacements. Finally, a warning is raised for Scenario 3 when ∑i|Δi| overcomes the value estimated for the second threshold.
In conclusion, it is worth specifying how the proposed system can be employed in practical applications. Considering that the entire framework (see Figure 3) was developed in an automated Python module, the tool can be used for each bridge belonging to a focused road network. In particular, the comparison between the displacement time series and the proposed threshold can be checked every time a new satellite acquisition is available (by updating the input data), and the occurrence of warnings can be assessed. It is important to specify that the occurrence of an isolated warning could not be a real concern, given that some approximations and elaborations were proposed. On the other hand, if the same warning persists for consecutive runs, the user can proceed with specific investigations (e.g., on-site survey) and undertake specific actions according to the detected scenario. The system could be also implemented in a bridge management system (BMS) as an additional module at disposal to road management companies.
4. Application of the Proposed Early Warning System
This section is aimed at providing an illustrative application of the proposed framework. The proposed early warning system was applied to a multi-span simply supported prestressed RC girder bridge. About the case study, it is worth noting that the satellite data have been collected and elaborated on a bridge for which some details (e.g., name and location) cannot be disclosed by the authors. The bridge should be considered an archetype structure, as its constructive and structural features are representative of simply supported bridges built in Europe in the period 1950–1990. According to the first step, the structural information is collected. It is made of four spans supported by single-shaft piers and seat-type abutments. Each span is characterized by four prestressed RC beams, transversely connected by RC cast-in-place diaphragms and by an RC slab whose thickness is equal to 0.2 m thick. The bridge superstructure is connected to the piers and abutments through elastomeric bearings. The length of the spans ranges from 32 m to 33 m. The bridge longitudinal axis is inclined by an angle equal to −33° with respect to the E-W direction. The deck width is equal to 13.00 m. The bridge presents a 7° slope and it was hypothesized to be located at a height of about 560 m a.s.l. for its highest point and about 550 m a.s.l for its lowest point. The distribution of elastomeric bearings was assumed as repetitive along the bridge: longitudinal mobile bearings at the beginning of each span and fixed mobile bearings at the end of each span, going from the first (AB1) to the second (AB2) abutment, according to the indication in Figure 9. Regarding the deck section, geometric and mechanical features were available. In particular, the value of Ec was assumed equal to 31000 MPa, while Jdeck was assumed equal to 4.12 m4. Although these values are assumed as fixed along the bridges, they could be considered accounting for uncertainty (especially for EC when estimated through mechanical tests) and this can produce a set of seasonal vertical thresholds (e.g., a spindle). Nevertheless, this is not of interest for purpose of the proposed procedure application.
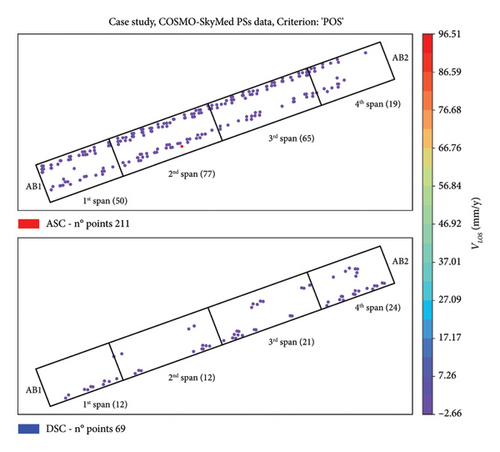
Regarding satellite data, both ASC imagery and DSC imagery were collected by CSK constellation on StripMap HIMAGE mode, for which detailed features are reported in Table 1. Image resolution suits well for this application considering the bridge footprint dimension (Section 2.1). Figure 9 reports the numbering of the spans and, for each span, the distribution of ASC and DSC PSs. Each PS is colored by matching a common colormap defined according to VLoS values. The number of points for each span is also indicated in the brackets.
| Satellite | Mode | Spatial resolution | Pass type | Time span | Incidence angle θ (°) | Azimuth angle α (°) |
|---|---|---|---|---|---|---|
| CSK | StripMap HIMAGE | 3 m × 3 m | ASC |
|
31.143 | 169.155 |
| CSK | StripMap HIMAGE | 3 m × 3 m | DSC |
|
30.781 | 10.894 |
Satellite data were processed by the SPINUA algorithm to retrieve PSs and the related attributes. The selected ones in Figure 9 are obtained by defining the bridge and the span footprints according to the “POS” criterion (a 3 m buffer around the real footprint is fixed to consider geo-positioning errors).
Once the buffered footprint was divided in spans, the PSs were selected. Table 2 summarizes the number of PSs selected according to each criterion described in Section 3.3, reporting results for the whole bridge footprint. PS height values were corrected considering the difference between the bridge mean height a.s.l and mean height attribute of each PS falling within the enhanced footprint. Hence, PSs are subjected to a rigid translation of 7.8 m and 7.5 m for ASC and DSC datasets, respectively, and a ± 1 m tolerance is considered for geo-positioning errors. It is worth noting that, using “H_GEO” criterion, among the points a PS was discarded (L20968P02259, red dot in the ASC geometry of Figure 9 and black line in Figure 10(a)), which is characterized by a very high VLoS value (96.51 mm/y) over the whole period and that completely disagreed with VLoS of the closer PSs (Figure 10(b)). The results of the retained PSs from “H_GEO” criterion are illustrated in Figure 11 and given both the low variability of VLoS attribute on “H_GEO” criterion and the lack of PSs from DSC geometry on 3rd span with “V_LOS” criterion, the “H_GEO” criterion was chosen to continue the analysis.
| Criterion | PSs—ASC | PSs—DSC |
|---|---|---|
| POS | 211 | 69 |
| H_GEO | 191 | 61 |
| V_LOS | 190 | 55 |
| COH | 211 | 69 |
| H_GEO + COH | 191 | 61 |
| H_GEO + COH + V_LOS | 187 | 55 |
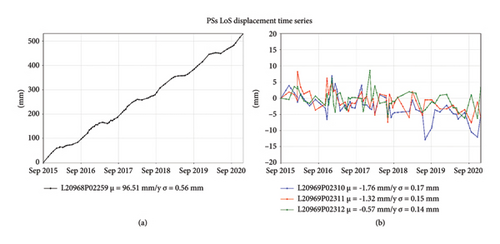
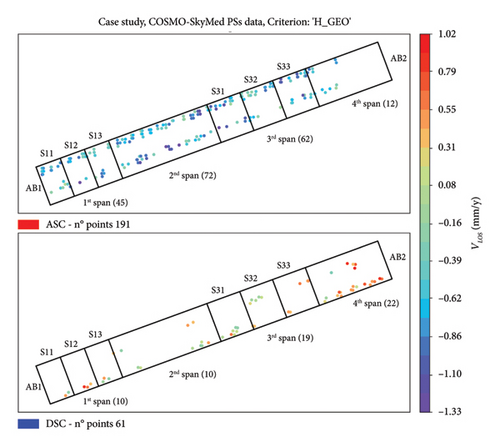
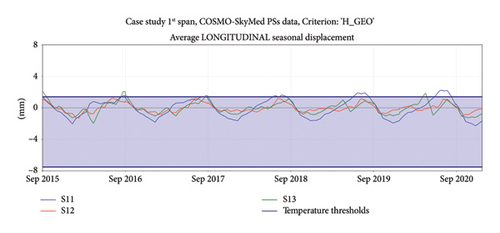
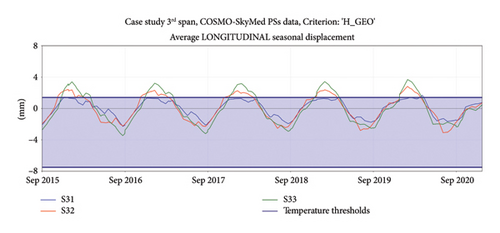
Figure 11 shows the division of the spans in subregions for the 1st and 3rd spans (S11, S12, and S13 for the 1st span and S31, S32, and S33 for the 3rd span), according to the minimum requirements defined in Section 3.3. The performed subdivision has the goal to describe the behaviour of lateral and central span regions, where the first ones could be affected by more sensitive longitudinal displacements (e.g., due to thermal effects) and the second one could be affected by vertical displacements (e.g., due to traffic/gravity loads). Temporal and spatial consistency was evaluated before computing longitudinal and vertical displacement time series. Spatial consistency was evaluated on the PS distribution along each span. As observed in Figure 11, although 1st and 3rd spans present a good spatial consistency, a different situation can be observed on the remaining spans. As a matter of fact, the 2nd span does not present PSs in the central part of the DSC dataset, even without PS filtering, as in the “POS” criterion shown in Figure 9, while the 4th span is partially covered by the ASC dataset. The lack of PSs from the DSC dataset could be caused by the presence of vegetation on the bridge left side coupled with the DSC side view geometry. The absence of points remains an open issue, which limits the application of the proposed methodology. In general, improvements for spatial consistency, obtainable through a further longitudinal division, are recommended as proposed in [30]. This is worth only in the cases in which larger datasets are available to analyse the differences among structural parts, especially regarding vertical displacements (as for example shown for the Himera viaduct in [28]). Talking about the temporal consistency, time series associated with each PS should be manipulated. First, it is necessary to eliminate the first ASC acquisition (02 January 2015), because it is extremely far from the second acquisition of the same dataset (01 September 2015). To this scope, the entire ASC time series must be purified from the data related to its first acquisition. Then, the common temporal baseline was defined according to Section 3.4.
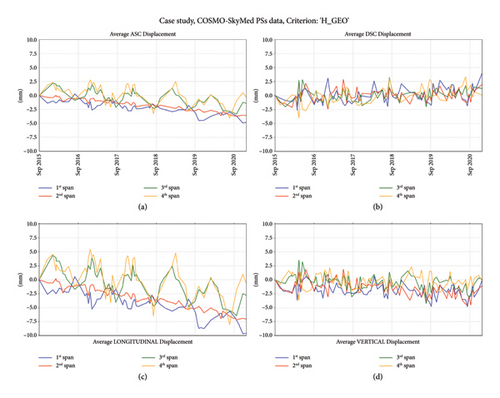
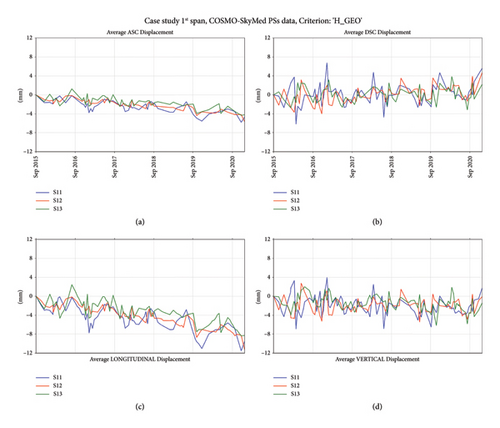
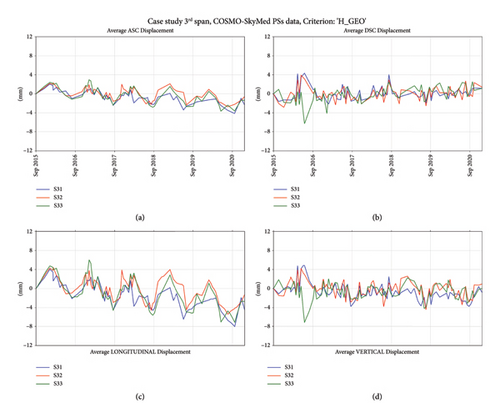
Results from equation (16), for each span, can be observed in the bottom graphs of Figure 12. A reversed sign is assumed for longitudinal displacements to classify positive displacements during summer and negative ones during winter. A positive displacement implies a stretching movement towards W direction, while a negative displacement corresponds to an approaching movement to the E direction. According to the estimates of VLoS values in Figure 12, the longitudinal and vertical displacement trends are found, denoting that the vertical one is less accentuated (i.e., quasi-horizontal). Regarding the longitudinal seasonal component, although it is not possible to quantify an amplitude, it can be observed that the first two spans (1st and 2nd) have a mirrored behaviour compared to the last two spans (3rd and 4th). Hence, during the summer months, the 1st and 2nd spans show positive displacements, while 3rd and 4th spans show negative displacements. Similar outcomes cannot be provided regarding the vertical direction, where a unclear seasonal trend can be observed. Figures 13 and 14 show, in the bottom graphs, the time series already discussed for the subregions of the 1st (S11, S12, and S13) and 3rd (S31, S32, and S33) span, respectively, denoting the same outcomes. As discussed at the end of Section 3.4, final insights about average longitudinal displacement-time series in Figure 12 can be provided. Observing the VLoS values of ASC and DSC acquisition geometry, a quite similar magnitude can be denoted (i.e., −0.64 mm/y for ASC and 0.20 mm/y for DSC on average), but opposite signs were obtained for longitudinal components. This means that, although longitudinal displacements present a trend similar to the one observed for ASC component, it was obtained by the combination of ASC and DSC and then should be not confused.
To process a systematic analysis of the time series, the application of the decomposition algorithm STL was required. A temporal resampling of the time series was processed, to have a regular sampling frequency. Considering an average frequency of 34 days for the case at hand, corresponding to twice the satellite revisit time for CSK constellation, the series were resampled with a daily frequency, to prevent acquisition losses. In addition, an annual seasonality was considered. The obtained trends (seasonal and remainder components) are shown in Figure 15 for S11, S12, and S13 and in Figure 16 for S31, S32, and S33.
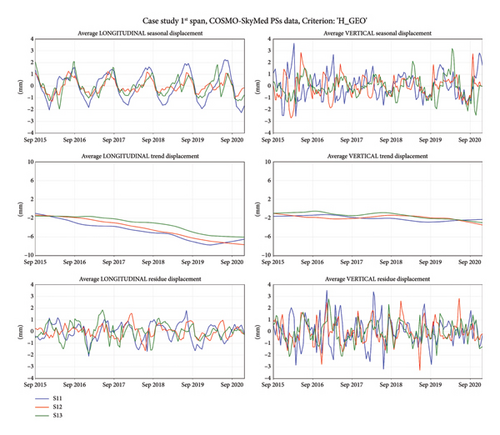
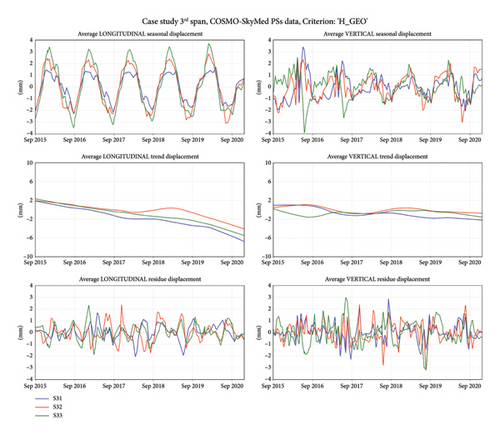
Some considerations can be provided by observing the results of obtained displacement components from the STL analysis. As previously stated, from the longitudinal seasonal components, the displacements of the 1st span subregions (S11, S12, and S13 in the bottom left chart of Figure 13) are out of phase compared to the ones provided in the 3rd span subregions (S31, S32, and S33 in the bottom left chart of Figure 14). Furthermore, as expected for this constructive typology, the displacements of subregions close to the fixed support (S13 and S31, blue lines) are smaller than those of central (S12 and S32, red lines) and last (S11 and S33, green lines) subregions (see top left graphs in Figures 15 and 16). From this observation, some insights can be derived on how bearings are working under service conditions, despite the fact that original design drawings could suggest a different positioning criterion. As a matter of fact, observing the obtained results, it seems that bearings are positioned symmetrically to the central pier and not according to the scheme above declared. The magnitude of the movements is also increasing in both summer and winter months, which cannot imply a wrong functioning of the bearings, but a different behaviour to the expected one (a malfunction of bearings could lock the longitudinal displacements, benefiting the development of greater displacements in the vertical direction).
In addition, looking at the longitudinal displacements, a negative trend can be observed for 1st and 3rd span, which could imply a movement from AB1 to AB2 (see Figure 11). Nevertheless, this aspect was faced only by considering the vertical displacements because, for the sake of generalization, the effect of the movement can be always detected by the vertical component and not always derived by the horizontal component (i.e., when the horizontal component is in the azimuth direction). Regarding the vertical seasonal component (top right graphs in Figures 15 and 16), it shows a lower regularity than the longitudinal component, considering that the expected behaviour of larger vertical displacements in the central subregions (S12 and S32, red lines) than the lateral ones (S11, S13, and S31, S33) is not always well described by satellite data.
Regarding trend values, the longitudinal components are almost linear (presenting a high coefficient of determination, R2, values) and highlight an ongoing deformation along L axis (see middle left graphs of Figures 15 and 16). For the case at hand, the average value, μ, is equal to −1.2 mm/y and −0.8 mm/y for 1st and 3rd span subregions, respectively, as summarized in Table 3. Looking at the obtained values, average velocities are not alarming for the bridge, also according to the available literature (e.g., Nettis et al. [35] consider velocities lower than 2 mm/year as low-risk deformation scenarios). Concerning vertical trends (see middle right graphs in Figures 15 and 16), although nonlinearities can be observed (low values of R2), they describe a slightly downward movement characterized by an average value, μ, equal to −0.28 mm/y for both 1st and 3rd span subregions.
| Subregion | Longitudinal | Vertical | |||||
|---|---|---|---|---|---|---|---|
| μ (mm/y) | d0 (mm) | R2 | μ (mm/y) | d0 (mm) | R2 | δi (mm) | |
| S11 | −1.23 | −1.47 | 0.95 | −0.28 | −1.25 | 0.75 | −1.5 |
| S12 | −1.34 | −0.66 | 0.98 | −0.18 | −1.42 | 0.34 | −0.96 |
| S13 | −1.01 | −0.60 | 0.92 | −0.38 | −0.44 | 0.77 | −2 |
| S31 | −1.36 | 1.77 | 0.97 | −0.61 | 0.88 | 0.86 | −3.32 |
| S32 | −0.83 | 1.93 | 0.80 | −0.25 | 0.65 | 0.40 | −1.32 |
| S33 | −1.25 | 2.24 | 0.98 | 0.03 | −0.78 | 0.01 | 0.16 |
Finally, the above qualitative considerations about the time series and the velocity values can be quantified and compared with limits. Therefore, as a last step, longitudinal and vertical thresholds were defined according to Section 3.7. Temperature data were derived from the closest weather station (10 km away). The reference temperature, T0, of the master image was fixed to 29°C, from the weather station data, while ΔTMAX and ΔTMIN were calculated from TMAX and TMIN, defined through the temperature cosine model, equation (13), fitted on the few data provided by the same station. The fitting parameters, from a nonlinear least squares method, were B = 11°C, ϕT = −4.6 assuming A = 23.1°C. Hence, ΔTMAX is found equal to 4.3°C and ΔTMIN to −23.4°C and thresholds dTemp were estimated, equation (14), as equal to 1.4 mm and −7.5 mm (dark blue lines on top graphs in Figures 17 and 18) for both S11 and S33, respectively. Later, the two vertical thresholds were calculated and compared with the observed scenario. The first threshold, dservice, was equal to 3.5 mm for both 1st and 3rd span, equation (15), while the second threshold was quantified as equal to 10.6 mm. The scenarios’ values to be compared with thresholds, as described in Section 3.7 and reported in Table 4, were defined through the vertical cumulative displacement δi reported in Table 3. As a result, the 1st span falls under Scenario 1 (material degradation, Figure 19) while the 3rd span falls under Scenario 3 (differential displacement). From the comparison of descriptive characteristics with the threshold values, no span was subject to warnings.
| Span | Δsx (mm) | Δdx (mm) | δmidspan (mm) | Average |Δi| (mm) | 2|δmidspan|/3 (mm) | Scenario | Threshold (mm) |
|---|---|---|---|---|---|---|---|
| 1st | 0.54 | −1.04 | −0.96 | 0.25 | 0.64 | 1 | −3.5 |
| 3rd | 1.91 | 1.48 | −1.32 | 1.7 | 0.88 | 3 | 10.6 |
In summary, considering a five-year observation period, the proposed framework allowed for retrieving, discussing, and comparing seasonal and trend displacement components for the focused bridge. As a first result, the longitudinal seasonal component highlighted a different behaviour between the hypothesized and the real bridge behaviours, regarding the support operation. Considering a constant temperature range along transverse deck section, thresholds were evaluated and compared to seasonal displacements, showing that the imposed limit was always exceeded by the 3rd span. Regarding vertical displacements, two different deformation scenarios were identified, material degradation and subsidence, but no warnings were noticed. Longitudinal trends presented small velocity values but, in the absence of further analysis, material degradation and aging cannot be excluded as possible causes of displacement increment. In the end, considering the tolerances and the limited precision of the displacement time series for the reasons more times above stated, the specific exceedance of the thresholds is not worrying, but it is worth paying attention in the cases of constant exceedance and of relative velocity increasing.
5. Conclusions
This paper proposed a Multi-Temporal Interferometric Synthetic Aperture Radar (MTInSAR) based early warning system to investigate the displacements and slow deformations over time for single/multi-span simply supported prestressed/reinforced concrete girder bridges. As a main advantage, the proposed framework presents a standardized and scalable series of steps, developed through a Python module, to apply for the purpose of large-scale monitoring of the considered structural typology, as one of the most diffused in the bridge portfolios in Italy. The framework is mainly based on the information extracted from satellite data, but it is completed by additional information. Among these, as minimum requirements, environmental temperatures and structural information from original drawings should be available for defining basic census information such as the number of spans, the position, the longitudinal and transversal dimensions, the bearing distribution, and the structural material. Bridge geometrical information is used to perform the Persistent Scatterer (PS) selection, based on positional and MTInSAR algorithm attributes, including geo-positioning errors through a buffer zone around the bridge footprint. Then, the bridge spans are considered as homogeneous structural units characterized by an average Line-of-Sight (LoS) displacement time series of the PSs within the focused bridge. Spatial and temporal coherence must be ensured, and the criteria for performing resampling operations are provided. Each span is then subdivided into subregions (at least three parts) to highlight the differences among structural regions close to the bearings and regions in the central parts of the span. Taking advantage from two LoS displacement time series for each point (coming from ascending and descending satellite acquisition geometry) and fixing predefined reference directions in the Mobile-Local Cartesian Reference System (M-LCRS), longitudinal and vertical displacements are computed, by employing directional cosines for the LoS vector along the reference directions. The obtained displacement time series can be characterized by a trend and a seasonal component, and both components can be evaluated against service conditions (e.g., thermal and traffic/gravity loads). To differentiate the displacement components, a Seasonal Trend LOESS (STL) algorithm is applied. Using straightforward static schemes, likely thresholds for the abovementioned displacement components are established, considering an a priori unknown deformed shape of the bridge (as systematic over time, starting from the first acquisition). The framework was applied to a structure representative of the considered structural typology, by using COSMO-SkyMed satellite data retrieved from a five-year observation period. Results were elaborated for each span and the related subregions. From longitudinal displacement time series (both for spans and subregions analysis), the seasonal components reveal unexpected behaviour of the bearings, which differently operates from the ideal situation. This is the first valuable piece of information, which could be assessed only through a visual survey. Looking at the results obtained by employing an STL model and threshold evaluations, other considerations can be provided. First, the temperature threshold is always exceeded during the summer months by both subregions in 1st and 3rd spans close to the mobile bearings. Still, the magnitude of the longitudinal seasonal movements is increasing in both summer and winter, which confirms the above observation on the operation of the supports. Regarding vertical seasonal displacements, no warnings are noticed. Regarding the bridge-specific displacement scenarios, the 1st span falls under Scenario 1 (material degradation) while the 3rd span falls under Scenario 3 (differential displacement). From the comparison of descriptive characteristics with the threshold values, no span was subjected to warnings. Longitudinal trends present small velocity values, which could be due to several causes, such as material degradation or aging. Although simplified and retaining some hypotheses, the early warning system can suggest interesting insights for the purpose of bridge portfolio analysis and risk prioritization, also according to the framework proposed by the recent Italian guidelines.
From the application of the proposed procedure, the main pros and cons can be highlighted. As main potentialities, the proposed system uses SAR data to perform cost-effective long-term monitoring of existing bridge portfolios, by simply elaborating the time-displacement series derived by the PSs (i.e., output-only procedure). In addition, the entire framework is automatic since it is defined through a specific Python module, which allows for the automatic updating of the output when new input data are available and performing the monitoring procedure on all bridges belonging to a focused road network. Finally, the proposed early warning system can be applied to identify possible anomalies, which can be used to plan further actions (e.g., specific bridge sensor-based monitoring). On the other hand, the main disadvantage is represented by the absence of data. As a matter of fact, if SAR data are not available or the PSs on the focused bridges (or span) are limited, the proposed procedure cannot provide a result.
In the end, it is worth noting that the proposed approach cannot replace the traditional monitoring methodologies, considering the limits characterizing the information contained in the satellite data. Nevertheless, also according to the provisions of the Italian guidelines, the approach can be used for large-scale monitoring of bridges within road networks, especially for those phenomena that are difficult to survey through a visual inspection. In addition, the proposed approach accounts for the behaviour under service conditions, providing feedback on possible actions to be taken temporarily for reducing possible risks (e.g., traffic limitations). Future developments will include some suggested enhancements. First, to acquire more accurate measurements for each subregion and to raise their number, spatial resampling is needed for the PSs, to transfer the point displacement information to the areas not covered by points. This could be carried out by employing additional models, such as the Inverse Distance Weighted or Kriging techniques. Moreover, due to the deterministic manipulation of both thresholds and displacement time series, a probabilistic approach could be implemented. Still, some other data could be implemented in the proposed framework, considering that it currently works like an “output-only” procedure. For example, the information about traffic loads could be considered as input, by exploiting specific simulations (e.g., finite element models) or by acquiring data about traffic flows (e.g., average daily traffic and heavy-average daily traffic).
Finally, with proper extensions, the method could be applied to different typologies of bridges with different static schemes.
Conflicts of Interest
The authors declare that there are no conflicts of interest regarding the publication of this article.
Acknowledgments
All authors thank Vincenzo Massimi, Vincenzo Barbieri, and Sergio Samarelli from Planetek Italia for providing satellite data. The authors thank Politecnico di Bari for the financial support to submit the Italian patent request n. 102024000002389, named “Metodo di early-warning per predire il comportamento strutturale di ponti esistenti basato su dati MTInSAR,” date of filing: 06 February 2024. Mirko Calò acknowledges funding by Italian Ministry of University and Research, within the project PON-Ricerca e Innovazione-2014–2020, CUP Code (D.M. 10/08/2021, n. 1061): D95F21002340006. Sergio Ruggieri acknowledges funding by Italian Ministry of University and Research, within the project PON-Ricerca e Innovazione-2014–2020, CUP Code (D.M. 10/08/2021, n. 1062): D95F21002140006. Andrea Nettis and Giuseppina Uva acknowledge the Sustainable Mobility National Research Center (MOST) and received funding from the European Union Next-GenerationEU (PIANO NAZIONALE DI RIPRESA E RESILIENZA (PNRR)—MISSIONE 4 COMPONENTE 2, INVESTIMENTO 1.4–D.D. 1033 17/06/2022, CN00000023)—SPOKE 7 “CCAM, Connected Networks and Smart Infrastructure”-WP4 (CUP D93C22000410001).
Open Research
Data Availability
The data that support the findings of this study are available from the corresponding author upon reasonable request.


