Design and Application of a Liquid Detection Device Based on Transmission Near-Infrared Spectroscopic Imaging
Abstract
Spectral imaging is performed primarily using reflective devices, but for transparent objects, especially transparent liquids, a transmission-based device is required to obtain more effective spectral imaging data. For this purpose, a transmitted spectral imaging data acquisition device based on a miniature multispectral spectrometer was developed and demonstrated its capability in the analysis of transparent liquids. This device allows rapid and noncontact acquisition of spectral imaging signals from transparent liquid samples. The design of the device mainly includes two parts: a shooting system and a master computer, and the optical path is optimized by selecting the appropriate diffusion plate. As an application example, a concentration-absorbance model of liquid samples at characteristic wavelengths was established and used to predict the concentrations of different liquid samples. Experimental results showed that the relative error of the predicted concentration values was within 4%, indicating excellent detection performance. Therefore, the design of the device demonstrates favorable feasibility and wide applicability in liquid detection systems.
1. Introduction
Spectral imaging detection is a novel analytical detection technique that combines spectral analysis with image technology [1]. This method uses spectral imaging devices to acquire and generate material feature information in both wavelength and space. It can obtain spectral features at different spatial positions, which enables qualitative detection and quantitative measurement of target objects. Conventional spectroscopic techniques typically acquire spectral information at a specific location through single-point measurements, which can be affected by interfering spectra, such as background noise or impurities. In contrast, spectral imaging techniques are capable of acquiring spectral data at multiple locations in a single imaging session, thus providing greater efficiency and more comprehensive information acquisition. Through subsequent image processing and data analysis, interference can be reduced, providing more stable and reliable data. This makes spectral imaging techniques more suitable for research and detection of large areas, especially for application scenarios that require rapid and efficient assessment of the entire area. For certain liquid samples, such as wastewater, they are actually nonhomogeneous. In such cases, obtaining complete spectral information about the sample is challenging using single-point spectroscopy alone, making multispectral analysis necessary for the detection of these types of samples.
The earliest application of spectral imaging was in the field of remote sensing, where the reflection spectrum of objects was captured through long-distance spectral imaging. Furthermore, since most solid substances are usually nontransparent, spectral image data acquisition of samples must be performed using reflective equipment. Reflective spectral imaging can be performed over considerable distances without being limited by sample location and alignment. For example, in the field of remote sensing, spectral imaging technology is used for data acquisition and analysis in land use classification [2], environmental monitoring [3], and other aspects, thus making reflection detection more widespread and universal. However, with the development of spectral imaging technology, on the one hand, the size of spectral imaging devices ranges from large to miniature, and on the other hand, the application of spectral imaging is increasingly extensive. The development of miniature imaging spectrometers has laid the technical foundation for real-time rapid detection, but the objects that need to be detected in the actual detection process are often transparent objects, such as liquid samples. It is difficult to get effective data using reflective spectral imaging, so it is necessary to design a transmission spectral imaging device in order to obtain effective spectral image data. In terms of the optical structure, unlike reflection spectral imaging, where the light source and the spectral camera are generally on the same side of the sample, transmission spectral imaging requires placing the sample between the light source and the spectral camera, which is more sensitive to the precise sample placement, the spatial alignment between the light source, samples, and spectral camera, and the uniformity of the light source [4]. For example, in near-field liquid spectral imaging, due to the obvious scattering effect of the liquid on the light source, the data collected by reflective spectral imaging will not only contain a large amount of interference information but also can only reflect the situation of the sample surface without obtaining the characteristic information within the sample [5]. Therefore, near-field spectral imaging has high demands for the acquisition, processing, and operation of liquid samples and is more susceptible to the optical properties of liquids compared to long-distance water observation in the field of remote sensing. In order to overcome the limitations of near-field reflective liquid detection and realize the overall spectral information acquisition of liquid samples, a transmission method is required.
In recent years, the research using transmission spectroscopy to analyze the composition of samples has gradually emerged and achieved certain research results. Gan et al. obtained a variety of characteristic parameters of bacteria by multiwavelength transmission spectroscopy analysis, which was used for rapid and effective detection of pathogenic bacterial microorganisms in water bodies [6]. Wang et al. proposed an inversion method to optimize the hyperspectral water quality nitrite parameters of the random forest model based on transmission spectroscopy [7]. However, transmission spectroscopy has some limitations. First, the method requires high uniformity of the light source because any nonuniformity of the light source may lead to background noise or inhomogeneity in the image. In addition, for samples with inhomogeneous concentrations, there may be problems with signal saturation or transmittance variations. Multispectral imaging, on the other hand, not only provides spectral information but also acquires spatial information about the sample at the same time. This means that even if the sample has problems such as concentration inhomogeneity or signal saturation, the characteristics and concentration distribution can still be inferred by analyzing the imaging results of the sample at different locations, which improves the overall understanding of the sample and overcomes some of the limitations in transmission spectroscopy to a certain extent. Shao et al. applied hyperspectral imaging to construct a model for the detection of astaxanthin content in the rainbow red algae [8]. Although hyperspectral imaging can acquire more spectral details and has a large amount of information, the correlation between bands is high, data redundancy is high, and imaging speed is slow. Transmission multispectral imaging systems can use fewer bands to capture relevant information, so their equipment cost, data storage cost, and processing cost may be lower. And the appropriate bands can be selected based on specific application requirements, thus enabling the detection and monitoring of critical parameters without the need for the higher spectral resolution and detailed information provided by transmission hyperspectral imaging. In summary, the use of transmission multispectral imaging may be more appropriate in certain water quality testing applications because it is more economical, easier to operate, and meets real-time requirements.
For this purpose, this paper specifically designed a transmissive spectral imaging scheme based on a miniature multispectrometer and demonstrated its successful application in near-field spectral imaging of water samples. This design scheme can be widely used in similar scenarios.
2. Device Design
The intensity stability and spatial uniformity of the light source are the most important factors in the transmission-type spectral imaging detection device. The fluctuation of light intensity will change the signal intensity received by the spectral camera, thus affecting the accuracy and stability of spectral imaging. Moreover, the spatial distribution uniformity of light intensity will affect the spectral signal intensity at different positions of the sample, which may lead to analysis errors of the spectral information within the sample. Therefore, it is crucial to improve the intensity stability and spatial uniformity of the light source to enhance the robustness of data detection when designing transmission spectral imaging devices. Consequently, the design of a transmission spectral imaging system involves two components: the shooting system and the master computer for data processing and analysis.
2.1. Shooting System
The shooting system of the transmission spectral imaging device consists of a light source, a sample, and a spectral camera. The design scheme adopts a vertical structure, where the components are arranged from top to bottom as follows: light source, diffusion plate, sample, and spectral camera, and fixed inside a black ambient light shielding box to reduce the interference of external stray light. In this setup, the light passes directly through the sample in a vertical direction without the need for complex optical path adjustment and calibration, which reduces manufacturing costs and the difficulty of using the instrument. Meanwhile, the use of vertical transmission spectral detection enables more light to pass through the liquid sample and travel a longer light path, thus increasing the amount of light absorption and enhancing the signal intensity, which contributes to the higher sensitivity and accuracy of the detection.
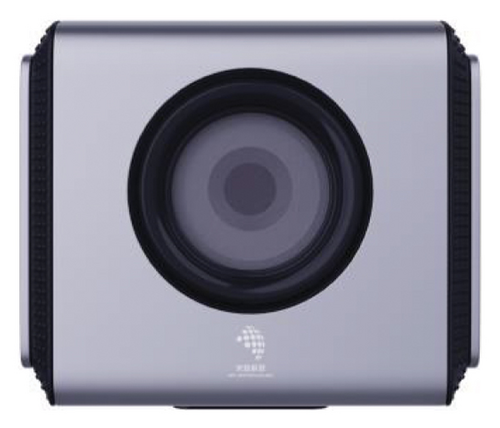
Near-infrared (NIR) spectra contain rich information about the structure of chemical molecules. Acquiring this information and combining it with machine learning enables fast and accurate identification or detection [9, 10]. The NIR multispectral camera (GX-IRSV-1100, Guangzhou Guangxin Technology Co., Ltd., China) is used as the spectral camera, as shown in Figure 1(b). This multispectral camera incorporates a built-in MEMS spectral imaging chip, which can capture and immediately output high-resolution spectral images of 1024 × 1280 pixels in multiple single bands within the spectral range of 713–920 nm. This camera can be connected to the PC through a USB-to-Type-C cable. The relevant application software on the PC can be utilized to configure camera parameters, select the desired shooting spectrum, and capture and output the original spectral images. This camera is often used for real-time analysis, detection, and other similar scenarios.
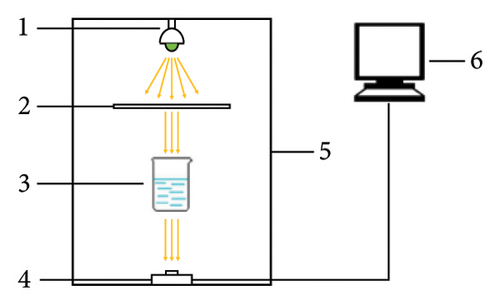
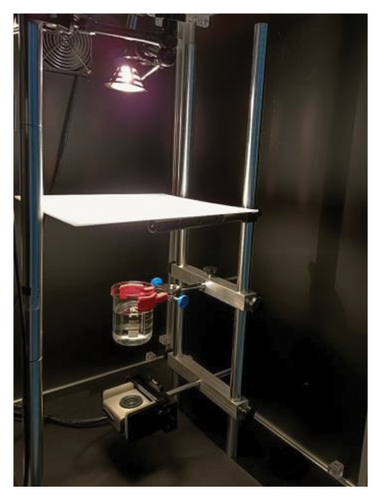
The light source should be selected according to the characteristics of the liquid sample and the reception range of the spectral camera to ensure adequate light intensity and an appropriate spectral range. The halogen lamp (Hu, MR16, 12 V/50 W) can stably provide sufficient light intensity, a relatively uniform spectral distribution, and a wide wavelength range for the NIR spectral camera to accurately capture and analyze the NIR optical signals of the samples. The diffusion plate is an element used for light diffusion, often used to attenuate or scatter strong light to achieve a soft and uniform irradiation effect, thus protecting highly sensitive optical measuring instruments [11]. Therefore, in order to improve the uniformity of the incident light on the sample, a diffusion plate was added between the light source and the sample. Moreover, the addition of the diffusion plate also contributes to the illumination stability and ensures the stability of the imaging quality. For the spectral camera, the diffusion plate can prevent too much light from entering to cause too many signal peaks, thereby improving the spectral resolution.
2.2. Master Computer
System software designed for the master computer is used for image and spectral processing. Preprocessing operations are required due to potential variations in illumination that can lead to brightness and color shifts, as well as the possibility of capturing nonsample-related information or noise [12]. The master computer receives the transmission spectrum images captured by the NIR spectral camera through the USB line. The software should have the functions of image processing and spectral analysis to realize image segmentation, image smoothing, and morphological processing so as to improve the precision and quality of the acquired images, while the spectral processing module in the software must perform essential preprocessing steps on the acquired spectra, such as spectral smoothing, multivariate scattering correction, and standard normal variate (SNV) transformation [13] to eliminate the noise in the spectrum, improve the readability of the spectral data, and perform subsequent spectral feature analysis.
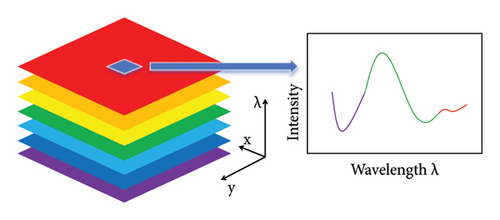
The device is reliant on a spectral camera capable of capturing images of the same sample at various wavelengths, thereby constructing a data cube containing two-dimensional spatial information and one-dimensional spectral information [14]. The two-dimensional spatial information can describe the position of each pixel in the image, with each pixel corresponding to the detected spectral data. By processing and analyzing the spectral data at each pixel, the master computer can extract the spectral features and the spatial distribution information of the sample.
Selecting a region of interest (ROI) is a critical step in spectral image processing, which is a technique for choosing specific areas in the image for further analysis [15]. As shown in Figure 2, it allows for an in-depth study and precise analysis of particular areas in the data cube, thereby obtaining detailed information about the spectral characteristics of those regions. Selecting a specific region as an ROI reduces the amount of data to be processed, thereby increasing processing efficiency [16]. Moreover, there may be multiple impurities and noise signals present in the original sample, and choosing the ROI can focus the analysis on a specific region, reducing the impact of background interference [17]. Additionally, the result of the ROI is the average spectral data of all pixels within the selected region, thus improving the signal-to-noise ratio and robustness of the analysis and making the results more reliable [18]. In summary, spectral analysis using the ROI has many advantages, including improved processing efficiency, reduced background interference, and improved reliability of results to obtain more accurate spectral analysis results.
3. Device Performance Test
3.1. The Choice of the Diffusion Plate
Choosing the suitable diffusion plate material is the key to optimize the stability of the optical path. To evaluate the diffusing effects of different materials, diffusion plates made of polymethyl methacrylate (PMMA), polycarbonate (PC), and polystyrene (PS) were tested. In the experiment, the spectral camera and the light source were kept in a fixed position, and the diffusion plates of the same thickness were sequentially placed in the same position between the light source and the spectral camera. Spectral images passing through the diffusion plate were acquired after the light source had stabilized upon startup. In addition, a blank control (BC) was established by capturing images with a spectral camera without installing diffusion plates. The highest brightness values and the image brightness standard deviation were calculated for the four sets of images to evaluate the performance of different diffusion plate materials. The brightness values of the BC group were normalized as the maximum value to obtain four sets of data, as shown in Table 1.
| Wavelength (nm) | BC | PS | PMMA | PC | ||||
|---|---|---|---|---|---|---|---|---|
| Lmax | Lstd | Lmax | Lstd | Lmax | Lstd | Lmax | Lstd | |
| 713 | 1 | 53.69 | 0.47 | 18.64 | 0.15 | 6.67 | 0.14 | 6.15 |
| 736 | 1 | 53.14 | 0.44 | 16.34 | 0.13 | 5.25 | 0.12 | 4.74 |
| 759 | 1 | 53.03 | 0.46 | 16.18 | 0.13 | 4.52 | 0.11 | 3.93 |
| 782 | 1 | 53.09 | 0.5 | 18.04 | 0.13 | 4.71 | 0.11 | 3.96 |
| 805 | 1 | 53.54 | 0.55 | 20.33 | 0.13 | 5.25 | 0.12 | 4.39 |
| 828 | 1 | 54.2 | 0.61 | 21.92 | 0.15 | 5.79 | 0.13 | 4.76 |
| 851 | 1 | 54.86 | 0.63 | 21.51 | 0.15 | 5.71 | 0.13 | 4.73 |
| 874 | 1 | 54.95 | 0.55 | 18.34 | 0.14 | 4.9 | 0.12 | 4.19 |
| 897 | 1 | 55.06 | 0.37 | 12.4 | 0.11 | 3.66 | 0.1 | 3.12 |
| 920 | 1 | 55.1 | 0.24 | 8.2 | 0.08 | 2.42 | 0.08 | 2.07 |
- Lmax: Maximum brightness value; Lstd: Standard deviation of image brightness.
According to the test data, the diffusion plate made of the PC material has the smallest standard deviation of the image brightness in the four sets of data, indicating the best diffusion effect on the halogen lamp light beam. Additionally, the maximum brightness values of ten different wavelengths were significantly reduced compared to the blank control group, which can effectively reduce the possibility of overexposure and ensure the normal operation of the spectral camera. Therefore, the diffusion plate of the material is selected as the optical element to diffuse and homogenize the light in the optical path of the detection device.
3.2. Device Stability Test
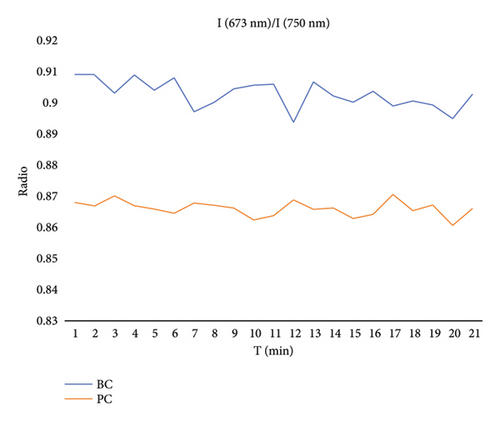
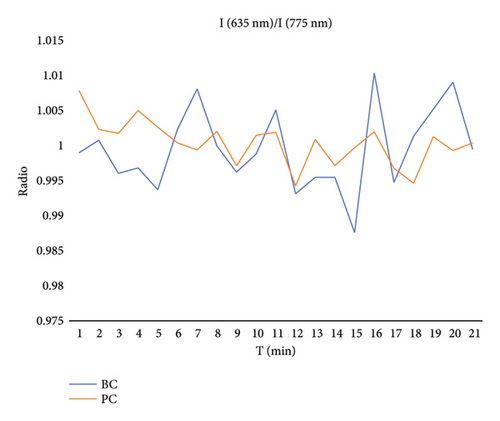
The stability of the optical path has a direct impact on the absorbance of liquid samples, and it is a prerequisite for accurate detection in the device. The stability of the dual-wavelength intensity ratio is one of the key indicators used to evaluate the stability of the optical path [19]. In order to test whether the optical path of the system meets the detection requirements, the spectrometer (ATP2002) is used to continuously collect the spectral data after the light source has stabilized. The ratio of light intensities at two wavelengths measured simultaneously was selected as the vertical coordinate, while time was used as the horizontal coordinate. A curve chart was then plotted to illustrate the variation of the dual-wavelength intensity ratio over time. By observing the trend of the curve, the stability of the system’s optical path can be assessed. Similarly, a blank control group was set to detect the stability of the optical path without the presence of a diffusion plate, and the data were acquired and graphed in the same step.
Within 20 minutes, the spectra were acquired. The light intensity ratio at 673 nm to 750 nm was taken as the ordinate of the first set of curves, and the light intensity ratio at 635 nm to 775 nm was taken as the ordinate of the second set of curves. As shown in Figure 3(a), in the first group of curves, the blank control group exhibited a curve fluctuation range from 0.8938 to 0.9090 with a relative standard deviation of 0.50%. However, as shown in Figure 3(a), upon the addition of the diffusion plate, the curve exhibited reduced fluctuations ranging from 0.8607 to 0.8706, resulting in a decreasing relative standard deviation of 0.29%. Similarly, in the second group of curves, the blank control group demonstrated a curve fluctuation range from 0.9876 to 1.0104 with a relative standard deviation of 0.61%. After adding the diffusion plate, the curve displayed narrower fluctuations ranging from 0.9943 to 1.0050 with a relative standard deviation of 0.29%. The fluctuation amplitude is significantly smaller and can be approximated as a constant. The results demonstrated that the use of a diffusion plate can significantly improve the stability of the optical path and provide important support for accurate liquid detection.
4. Application Examples
4.1. Experimental Design and Results
The molar absorbance coefficient k and sample thickness b are constants, and the absorbance (A) has a linear relationship with the concentration (c). Therefore, a linear equation expression can be constructed from the liquid sample with a known concentration and the measured absorbance value, and the concentration of the sample to be measured can be deduced from the expression.
Adjustments were made to ensure clear and accurate spectral images: the distance from the light source to the diffuser plate was set at 25 cm, the distance from the diffuser plate to the surface of the sample liquid was maintained at 25 cm, and the distance from the spectral camera to the bottom surface of the sample was set at 12 cm. After the design and construction of the device are completed, the detection accuracy of the device needs to be tested. Glucose has two characteristic wavelengths within 713–920 nm, so it can be selected for the calibration of the detection device [20]. Nine sets of glucose solution samples were prepared with a concentration gradient of 5 g/L, covering a concentration range from 5 g/L to 45 g/L, and all samples were maintained at a uniform thickness of 6 cm.
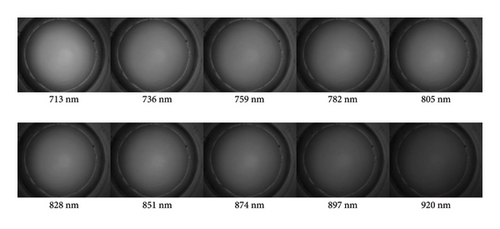
Nine groups of samples were detected by using the detection device, and 10 grayscale images of different bands were collected for each set of samples. These images are shown in Figure 4. The 100∗100 pixel region in the center of the image was selected as the ROI, and the average light intensity value in the region was obtained after image preprocessing, that is, the transmitted light intensity value of the sample solution at this wavelength, and the corresponding absorbance was calculated according to (1). The wavelength of 736 nm was selected as the characteristic wavelength, and the results are shown in Table 2. The absorbance showed a good linear change effect with the concentration.
| Concentration (g/L) | Absorbance |
|---|---|
| 5 | 0.00298 |
| 10 | 0.00729 |
| 15 | 0.00976 |
| 20 | 0.01409 |
| 25 | 0.0161 |
| 30 | 0.02041 |
| 35 | 0.02369 |
| 40 | 0.02341 |
| 45 | 0.03059 |
As shown in the data in Table 2, when the concentration gradually increases, the absorbance value at the characteristic wavelength also increases. A concentration-absorbance curve was then plotted with the concentration values depicted on the x-axis and the absorbance on the y-axis.
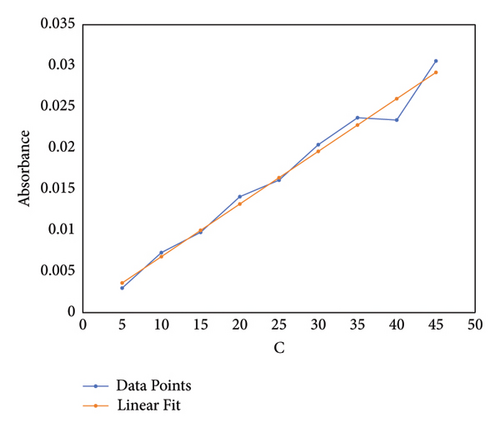
The goodness-of-fit between the graph and the fitting relationship, with a value of 0.98164, suggests that the observed values closely align with the relationship and can be well fitted by the data.
4.2. Accuracy Test
Five groups of glucose solution samples with different concentrations were configured and tested using the detection device. The above characteristic wavelengths were selected to calculate the corresponding predicted concentration values. The resulting test data are shown in Table 3.
| Absorbance | Predicted concentration (g/L) | Actual concentration (g/L) | Relative error (%) |
|---|---|---|---|
| 0.009 | 13.44137 | 13.5 | 0.43 |
| 0.01149 | 17.33332 | 17.5 | 0.95 |
| 0.01384 | 20.99549 | 21.5 | 2.35 |
| 0.0186 | 28.43893 | 27.5 | 3.41 |
| 0.02209 | 33.88333 | 33 | 2.68 |
The above results show that the relative error between the concentration values detected by the device and the actual concentration values is less than 4%, proving that the prediction model fitted by the device has high accuracy and can effectively detect the concentration of the solution to be measured.
5. Conclusions
A spectral imaging device based on the transmission NIR spectral imaging method was designed. Experiments were designed to compare the ability of different material diffusion plates to improve the uniformity and stability of the optical path. The device uses a halogen lamp that can stably provide sufficient light intensity and wide spectral coverage as a light source to irradiate NIR light to the configured solution sample and collects the spectral image of the transmitted sample through the NIR spectral camera. The average spectral value in the ROI is obtained through the image and spectral processing in the master machine; the relationship between concentration and absorbance is fitted with the least square method; and the concentration value of the tested solution is finally calculated by the relationship. The measured results show that the designed device has good optical stability. In the quantitative test of the example sample, the relative error between the tested solution concentration and the actual concentration value is less than 4%, indicating that the designed device has good analytical and detection performance.
Although experiments regarding sample thickness were not conducted in this study, it is acknowledged that sample thickness could influence the measurement outcomes of the multispectral imaging device. Firstly, an increase in sample thickness may augment the amount of scattered light, thereby affecting imaging clarity and resolution. Secondly, thicker samples may lead to attenuation of transmitted spectral signals, consequently reducing the signal-to-noise ratio of the system, which could impact the accurate measurement of substance concentrations within the samples. In conclusion, while sample thickness was not experimentally validated in this study, it is recognized that it could affect the performance and measurement outcomes of the multispectral imaging device. In our subsequent work, further research will be conducted in this regard.
Conflicts of Interest
The authors declare that there are no conflicts of interest.
Open Research
Data Availability
The spectral data used to support the findings of this study are available from the corresponding author upon request.


