Improved Deep Extreme Learning Machine for State of Health Estimation of Lithium-Ion Battery
Abstract
Prediction of state of health (SOH), a crucial aspect of battery management systems, necessitates accurate and reliable estimations for lithium-ion batteries. However, achieving high-precision SOH estimation using the deep extreme learning machine (DELM) in complex environments is challenging due to the instability caused by its random key parameters. To address this, we propose a novel approach that combines the improved bald eagle search (IBES) algorithm with DELM. By utilizing the IBES algorithm, we can extract highly relevant health indicators from the battery’s parameter curve during charging and discharging, as well as the incremental capacity curve. These indicators serve as inputs to the constructed estimation model, which predicts SOH under different working conditions. The proposed method has been validated using publicly available experimental data, with an overall error in SOH estimation of less than 1%. In comparison to the existing model, the proposed method achieves RMSE, MAE, and MAPE values lower than 0.35%, 0.26%, and 0.21%, respectively. These findings demonstrate that the proposed method excels in terms of both the speed and accuracy of SOH estimation, showcasing its enhanced robustness and reliability.
1. Introduction
Lithium-ion batteries (LiBs) are extensively used in various applications, including new energy vehicles and battery energy storage systems, due to their excellent energy efficiency, high power density, and prolonged self-discharge life [1]. The state of health (SOH) of LiBs is influenced by complex electrochemical reactions, resulting in internal irreversible changes [2]. Additionally, external factors such as ambient temperature, storage conditions, charge-discharge rate, and discharge depth can also impact the SOH [3, 4]. Since direct measurement of SOH using sensors is impractical, it is commonly characterized based on measurable parameters including voltage, current, temperature [5–7], and internal resistance [8]. Accurately and consistently estimating SOH is crucial as it enhances battery lifespan, reduces safety risks associated with battery aging and failure, improves battery energy storage system performance, and aids in the operation and maintenance of electrical equipment and ensuring driving safety.
There are two primary categories of existing methods for estimating the SOH: physical model-based methods and data-driven methods. The physical model-based methods establish effective physical models describing the degradation performance of LiBs through state-space equations or internal mechanisms. Examples of such models include equivalent circuit models [9] and electrochemical models [10]. Shi et al. [11] developed a second-order resistance-capacitance (RC) equivalent circuit model and employed an improved unscented particle filter (UPF) to estimate SOH. Sadabadi et al. [12] formulated a parameter-enhanced single-event model for predicting the remaining useful life, which can leverage electric vehicle charging data. Xiong et al. [13] simplified the P2D model using finite analysis and genetic algorithm optimization. Although physical models comprehensively consider lithium battery aging conditions and degradation mechanisms, offering high accuracy in SOH estimation, they are susceptible to battery load conditions, internal structure, and material quality [14]. The complexity of their principles and discretization of space make calculations computationally intensive, making them less suitable for practical applications.
The data-driven model eliminates the need to consider the complex mechanisms inside the battery. Instead, it establishes a nonlinear mapping relationship between the health factor and SOH in high-dimensional space using indicators that affect battery performance degradation as parameters [15]. By employing data processing and machine learning techniques [16], this model achieves SOH prediction for lithium-ion batteries. It offers strong flexibility and online scalability [17]. In recent years, data-driven methods such as support vector machines [18], Gaussian regression processes [19], logistic regression [20], random forest regression [21], artificial neural networks [22], and particle filters [23] have been widely applied in the estimation of the state of lithium-ion batteries. Li et al. [24] focused on short-term battery SOH estimation and long-term battery RUL prediction. They proposed a novel method called partial incremental capacity and double Gaussian process regression (GPR) fusion. Although GPR is an effective method for SOH estimation, its performance heavily relies on the selection of kernel function and hyperparameters. It is also sensitive to data noise and not suitable for high-dimensional data. Kumar et al. [25] estimated the SOH of a lithium-ion battery pack by analyzing capacity increment and combining it with the support vector regression (SVR) method. They verified the applicability and rationality of the framework through simulation. However, SVR involves numerous hyperparameters that profoundly impact the model’s prediction ability, generalization ability, and execution efficiency. Severson et al. [20] utilized logistic regression for predicting and classifying the cycle life of batteries. However, this method assumes linear relationships and is sensitive to outliers. Wang et al. [26] proposed a method that combines random forest (RF), empirical mode decomposition (EMD), and gated recurrent unit (GRU) to effectively estimate the SOH of lithium-ion batteries. Nonetheless, this approach is sensitive to the selection of hyperparameters. Based on the analysis of traditional particle filter algorithm (PF), Niu et al. [27] combined genetic algorithm to improve PF and established a mapping model of health index and SOH. To enhance the prediction performance of the PF, Ye et al. [28] proposed a prediction method based on chaotic particle swarm optimization particle filter (CPSO-PF).
In contrast to the aforementioned methods, the neural network model, due to its high fault tolerance and excellent stability, is more suitable for nonlinear and time-varying SOH estimation. Zhang et al. [29] proposed an online SOH estimation method for Li-ion batteries by incorporating attention mechanisms into long short-term memory (LSTM) neural networks. Catelani et al. [30] combined state-space estimation technique with recurrent neural network (RNN) to predict the remaining useful life of lithium-ion batteries. To overcome the limitation of RNN’s short memory, Li et al. [31] developed a model that combines recurrent neural networks with long short-term memory (LSTM-RNN) for accurate SOH estimation in Li-ion batteries. Based on the transfer learning method, Ma et al. [32] used convolutional neural network (CNN) to automatically extract features from raw charging voltage trajectories and then combined the improved domain adaptation method to construct the SOH estimation model. While the above-mentioned neural network models accurately predict SOH, they overlook the computational cost associated with the reverse fine-tuning process and the complexity of the network structure. It becomes challenging to strike a balance between network structure complexity and high-precision prediction. In comparison to traditional neural networks, extreme learning machines (ELM) achieve optimal model training without backpropagation [33]. ELM boasts advantages such as low computational cost, strong learning ability, minimal parameter adjustment requirements, and a simple structure. As a result, it finds numerous applications in Li-ion battery SOH estimation. For example, Ma et al. [34] designed an extensive learning extreme learning machine for battery SOH estimation. Nevertheless, ELM is still limited by its inherent model structure and may not fully capture feature information, particularly when dealing with higher dimensions and more complex data.
Deep learning methods have gained significant attention in the field of SOH estimation due to their powerful representation learning capabilities and advantages for handling large-scale data. Han et al. [35] introduced a novel deep learning framework that incorporates domain adaptation. They used a small number of target battery cycle data to establish a general capacity estimation model for differential batteries through deep LSTM. Xia and Qahouq [36] developed an index to quantify the aging behavior of batteries and used deep neural network (DNN) to extract and model the nonlinear complex correlation between the defined SOH index and SOH value of LiBs. Fei et al. [37] considered partial charging segments during incomplete charging based on two mainstream charging modes; then, an online SOH estimation method based on deep learning is proposed. To uncover the intricate connections between input and output, the deep extreme learning machine (DELM) combines the deep learning strategy with the ELM [38]. This integration facilitates the exploration of deeper relationships within the data. Compared to traditional deep learning models, DELM simplifies the complexity of the model, resulting in faster training speed and stronger generalization ability when processing large-scale and high-dimensional data. In the pursuit of high-precision SOH estimation, Li et al. [39] investigated the utilization of an improved sparrow search algorithm to optimize DELM. Similarly, Zhou et al. [40] incorporated the improved grey wolf optimization algorithm with DELM to predict remaining life and diagnose SOH in Li-ion batteries. While these methods have shown promising results, the identification of optimal initial weights and thresholds for the DELM network is still required. This enhances its ability to extract distinctive features and improve learning efficiency when handling vast amounts of data, ultimately enabling accurate and high-precision SOH estimation.
To overcome the challenges discussed earlier, this study proposes the utilization of the improved bald eagle search (IBES) algorithm to optimize key parameters within DELM for SOH estimation. The IBES algorithm addresses issues such as convergence towards suboptimal solutions and the balance between local and global search capabilities through corresponding enhancements. The proposed method extracts highly sensitive health indicators (HIs) from charge and discharge curves, as well as the incremental capacity curve, and employs them as input for the SOH estimation model based on IBES-DELM. Training and testing are performed using datasets encompassing various types of batteries under different operating conditions. The results showcase the superiority of the proposed method in terms of prediction accuracy, speed, and robustness. Consequently, it offers an effective approach to enhancing the reliability of battery systems.
2. Experimental and Methodology
2.1. Experimental Data Preparation
The charge and discharge characteristics vary among different types of batteries, which can lead to differences in the extraction of HIs and the prediction of SOH. To implement and validate the proposed method, this study selects two publicly available battery aging experimental datasets: the National Aeronautics and Space Administration (NASA) dataset [41] and the Center for Advanced Life Cycle Engineering (CALCE) dataset from the University of Maryland [42]. The specific details of the single cell tests are presented in Table 1.
| Battery number | Capacity (Ah) | Cycle | Charging current (A) | Charging cut-off voltage (V) | Charging cut-off current (mA) | Discharge current (A) | Discharge cut-off voltage (V) |
|---|---|---|---|---|---|---|---|
| B005 | 2 | 168 | 1.5 | 4.2 | 20 | 2 | 2.7 |
| B007 | 2 | 168 | 1.5 | 4.2 | 20 | 2 | 2.2 |
| B018 | 2 | 132 | 1.5 | 4.2 | 20 | 2 | 2.5 |
| CS2-35 | 1.1 | 717 | 1 | 4.2 | 50 | 2 | 2.7 |
| CS2-36 | 1.1 | 694 | 1 | 4.2 | 50 | 2 | 2.7 |
| CS2-37 | 1.1 | 758 | 1 | 4.2 | 50 | 2 | 2.7 |
| CS2-38 | 1.1 | 757 | 1 | 4.2 | 50 | 2 | 2.7 |
A set of 34 18650 lithium-ion batteries (LiBs), each with a nominal capacity of 2 Ah, was selected by the NASA research center for conducting experiments. Three batteries from this set were chosen to undergo charge and discharge experiments at an ambient temperature of 24°C, and the corresponding details of the testing procedure are provided in Table 1. During the experiments, the batteries were initially charged at a constant current of 1.5 A until reaching a voltage of 4.2 V. Subsequently, the charging process switched to constant-voltage mode until the current decreased to 20 mA, indicating the completion of the charging phase. Following this, the batteries were discharged at a current of 2 A until the voltages of the three battery groups reached 2.7 V, 2.2 V, and 2.5 V, respectively. Once these voltage thresholds were reached, the discharge process was terminated.
In addition, four batteries from the CALCE dataset, each initially with a capacity of approximately 1.1 Ah, are selected for further analysis. These batteries undergo a charging process with a constant current of 1 A until reaching a voltage level of 4.2 V. Subsequently, the batteries are kept at a voltage of 4.2 V while the charging current decreases to 0.05 A, indicating the completion of the charging phase. Once fully charged, the batteries are discharged at a constant current of 1 C until the voltage drops below the cut-off value of 2.7 V.
2.2. Health Indicator Extraction
Accurately estimating the SOH of LiBs is of utmost importance to ensure their safety and reliability. A crucial step in this process involves extracting HIs that reflect the level of battery degradation. The accuracy of this extraction directly impacts the precision of SOH prediction. To illustrate this, we use a NASA battery as an example. Figure 1(a) shows the capacity decay curve, while Figure 1(b) depicts the complete voltage and current curve of the B005 battery throughout a cycle, including the constant-current charge (CC Charge), constant-voltage charge (CV Charge), and constant-current discharge (CC Discharge) stages. In this study, HIs are extracted from parameter curves obtained during the battery’s charging and discharging processes. It is worth noting that the HI extraction process may produce some abnormal values, which are subsequently replaced with the average of the adjacent values.
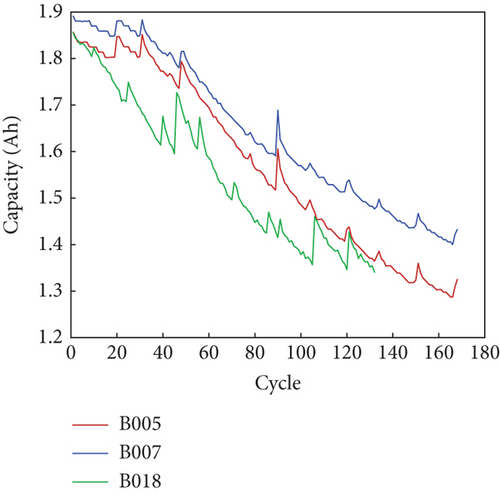
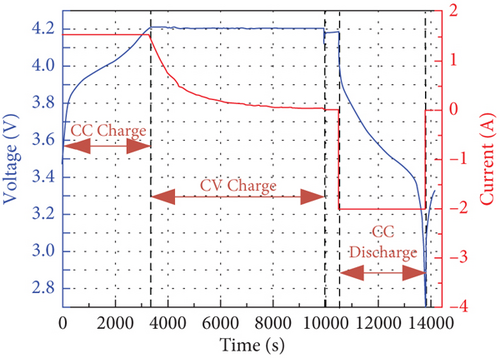
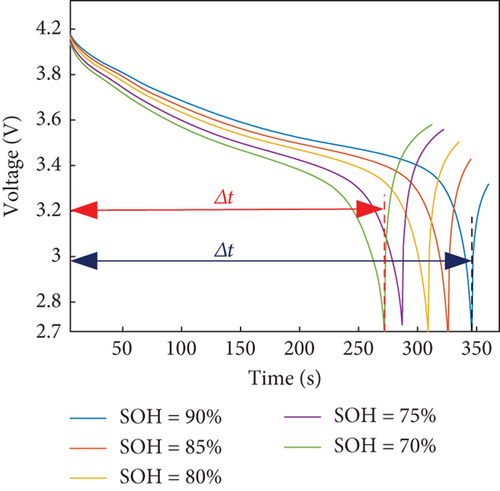
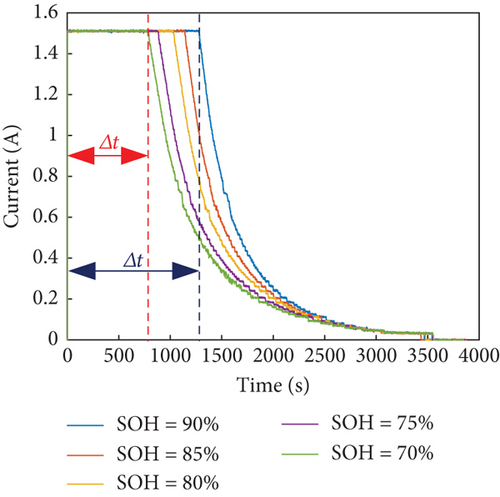
Figure 1(c) displays the voltage variation curve during the constant-current discharge (CC Discharge) stage, extracted from the B005 battery. Additionally, Figure 1(d) presents the extracted current change curve during the charging process from the B005 battery. It is evident from these figures that both the voltage and current curves undergo noticeable changes during the charge-discharge cycle. Moreover, the point at which the battery reaches the cut-off condition gradually shifts to an earlier time. This change exhibits a certain correlation with the SOH and follows a specific pattern that corresponds to the degradation of SOH.
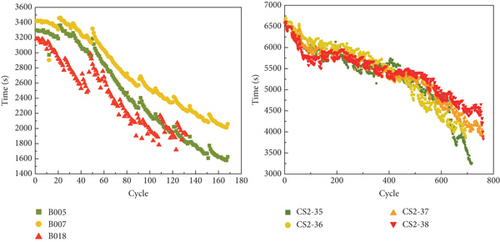
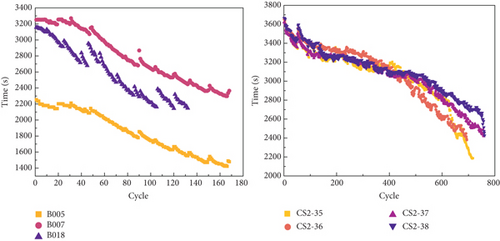
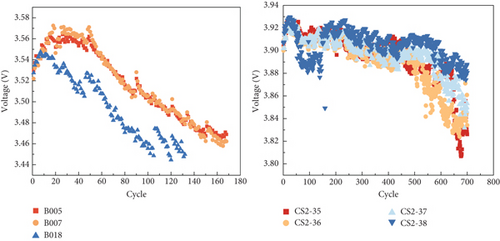
As the SOH diminishes, changes occur in the internal electrochemical reaction of the battery. This leads to a gradual reduction in the duration of constant-current charging during the charging process. Concurrently, as the batteries discharge, their capacity decreases while internal resistance increases. Consequently, the time taken for the voltage to drop from 4.2 V to 2.7 V becomes progressively shorter. To capture this phenomenon, the duration of constant-current charging during the charging process is denoted as HI1, while the duration of the same voltage drop in the discharge process is recorded as HI2. The change curves of these HIs for the two types of batteries are depicted in Figure 2. Moreover, Figure 2(c) illustrates that the average discharge voltage decreases with each cycle, exhibiting a trend similar to the decline in capacity. This observation suggests that the average discharge voltage, denoted as HI3, can be utilized as an additional HI to characterize the SOH.
Currently, the main methods employed for extracting HIs include incremental capacity analysis (ICA), differential voltage analysis (DVA), and isobaric energy analysis (IEA). The DVA method transforms the voltage curve platform into a valley on the DV curve, establishing a relationship between the internal and external changes of battery. However, it often introduces cumulative errors when utilizing the capacity obtained through current and time integration as the abscissa [44]. On the other hand, ICA converts the voltage platform into an IC peak, establishing a relationship between external characteristics and internal electrochemical characteristics [45]. By measuring the changes in current and voltage during battery charging and discharging, the residual capacity and performance state of the battery can be analyzed. Additionally, the IEA method is employed for HI extraction. IEA focuses on observing the energy change caused by the charging equivalent voltage during the constant-current charging process, effectively characterizing battery aging [46]. It estimates the SOH by measuring the voltage and current of the battery and analyzing the energy loss within it.
In the given formula, Q(k) denotes the charging capacity of the battery for the kth sample, while V(k) represents the corresponding charging voltage. For this calculation, we assume a value of n = 10, ensuring sufficient sampling points are considered.
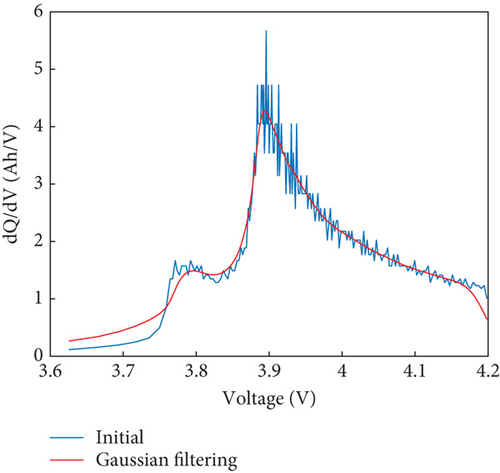
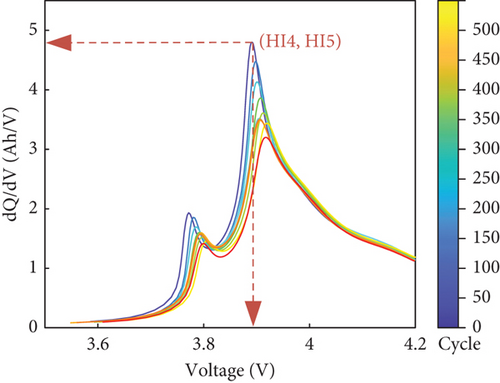
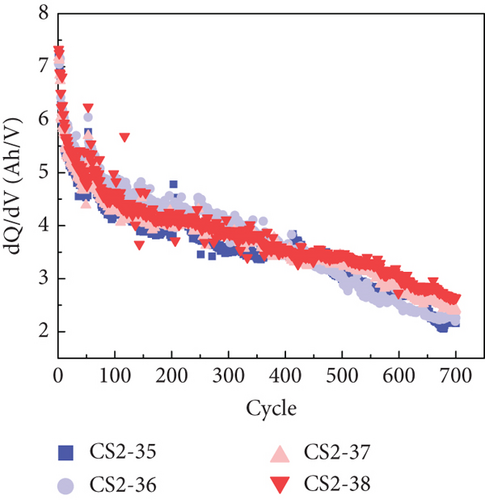
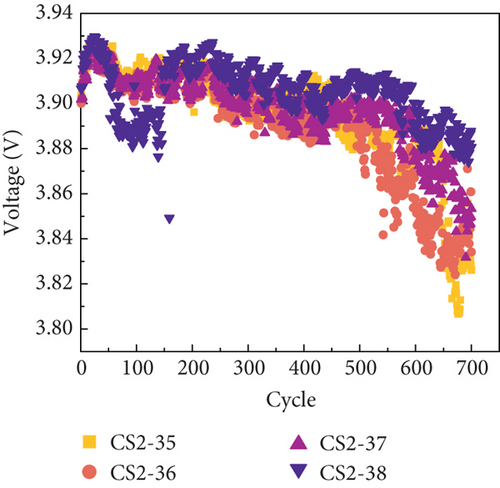
To minimize the impact of noise and enhance the clarity of the IC curve, the Gaussian filtering method is employed. This filtering technique effectively reduces noise and produces a smoothed curve, as demonstrated in Figure 3. The filtered curve clearly displays the peak positions, facilitating the extraction of health indicators. In the case of the CALCE dataset, Figure 3(b) represents the voltage variations observed at different charge levels in LiBs. The changes in the peak value of the IC curve directly correlate with the degradation of the active material inside the battery. This phenomenon effectively reflects the electrochemical reactions occurring during the charge and discharge stages. Hence, the health indicators extracted from the IC curve are the maximum peak value (HI4) and the corresponding maximum peak voltage (HI5). As depicted in Figures 4(a) and 4(b), both the maximum peak value and the maximum peak voltage exhibit a reduction as the number of cycles increases.
2.3. Correlation Analysis of Health Indicators
In the formula, r is the Pearson correlation coefficient, is the average value of the overall health indicator, and is the average value of the overall health states.
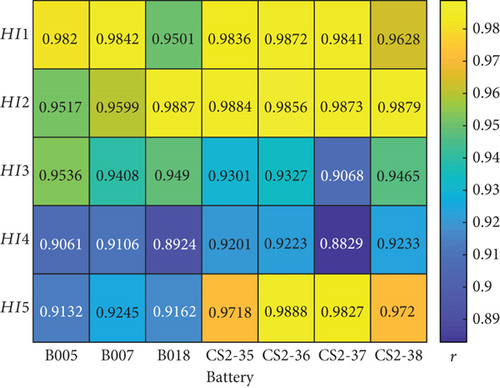
The correlation between the health indicators (HI1 to HI5) and the SOH can be assessed by examining the coefficient r. A stronger correlation is indicated by a higher absolute value of r closer to 1 or -1, while a value closer to 0 implies a weaker correlation. Figure 5 presents a heat map depicting the correlation coefficients between the selected health indicators and the SOH value. It is evident from the heat map that these health indicators exhibit a high correlation with the SOH, indicating their effectiveness in accurately reflecting the state of health in LiBs. This strong linear correlation provides robust support for the efficacy of the proposed IBES-DELM model.
2.4. DELM Battery Degradation Model
The degradation of LiBs is characterized by nonlinear and time-varying processes, coupled with intricate internal electrochemical reactions. Quantifying and modeling the degradation mechanism using specific spatial equations present significant challenges. Gated recurrent unit (GRU), broad learning system (BLS), and long short-term memory (LSTM) are commonly employed for constructing degradation models of lithium-ion batteries in the field of deep learning. LSTM, as a deep learning neural network, exploits the memory units in place of conventional hidden nodes and will not facing the issue of gradient disappearance [47]. Although it boasts high prediction accuracy, its convergence speed is relatively slow, and it incurs a high computational cost. GRU, as a variant of LSTM, simplifies the structure by employing only reset gate and update gate mechanisms. As a result, GRU significantly reduces complexity through a decreased number of parameters and can take into account both efficiency and accuracy [48]. However, it is vulnerable to the problem of gradient disappearance or gradient explosion. BLS, on the other hand, represents a single-layer neural network learning system, comprising random vectorization. Unlike certain neural networks, BLS eliminates the need for iterative parameter updates by effectively extracting crucial features from measurement data through random and enhanced feature mappings. This learning system demonstrates rapid learning speed and excellent generalization performance and avoids local optima issues [44]. However, due to its single-layer architecture, BLS depends significantly on the initial network parameters, and its capacity to express complex nonlinear relationships is relatively limited. Furthermore, while LSTM and GRU are well suited for handling sequential data and long-term dependencies, training and parameter tuning processes can be rather intricate.
DELM introduces a multilayer feedforward neural network, based on deep learning techniques. By extending the traditional ELM structure and incorporating multiple hidden layers, DELM enhances the model’s representation and learning abilities. This method benefits from rapid training speed, excellent generalization performance, and the lack of a need for extensive manual adjustment of hyperparameters. Compared to other deep learning neural networks, DELM exhibits lower structural complexity and offers strong applicability in SOH estimation. Consequently, the DELM method enables the establishment of a nonlinear mapping relationship between the input and output of LiB degradation features. This allows for effective SOH regression fitting through model training.
Figure 6(a) showcases the network structure of ELM, which serves as the foundation for DELM. By adhering to the principle of extreme learning machine, DELM preserves the rapid learning and strong generalization capabilities of ELM. Specifically, DELM consists of an extreme learning machine as autoencoder (ELM-AE) acting as the metastack. The weights within the network are initialized randomly and analytically solved, eliminating the requirement for layer-by-layer backpropagation. Despite its simpler structure, DELM achieves comparable performance to conventional deep neural networks while exhibiting faster convergence speed.
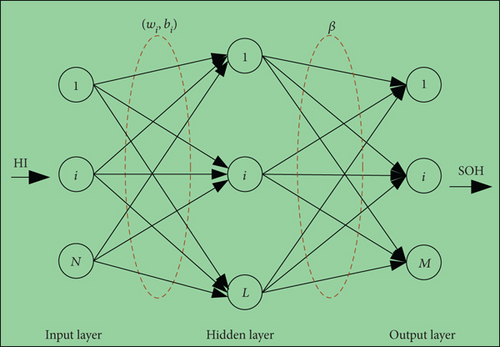
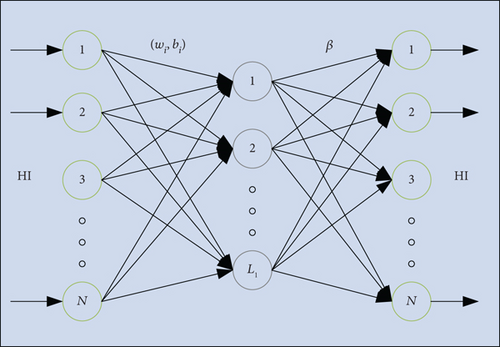
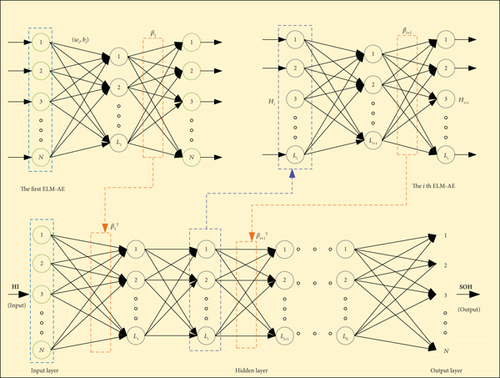
ELM-AE is a special neural network that can use autoencoder to extract and reduce the dimension of data features; its structure is shown in Figure 6(b). The training set consists of samples with features, denoted as S = {(HIi, SOHi), i = 1, 2, ⋯N}, where represents the feature vector of the ith training sample, HIi ∈ Rn. SOH denotes the regression value associated with the ith sample, SOHi ∈ Rm.
Here, βi represents the output weight of the ith hidden layer, β = [β1, β2, ⋯, βi]. H denote the output matrix of the hidden layer, H = [h1(HI), h2(HI), ⋯, hi(HI)]. I is the unit matrix.
The parameter k represents the number of stacks within the ELM-AE framework.
Building upon the preceding analysis, it can be concluded that DELM harnesses the power of matrix multiplication and exhibits orthogonal properties. This attribute enables DELM to expedite the training process of neural networks, minimize data loss during propagation, effectively capture intricate relationships within the data, and enhance the representation and nonlinear fitting capabilities of deep learning models. As a result, DELM emerges as a highly suitable method for SOH estimation.
Furthermore, in the original DELM approach, the initial weight wi and threshold bi hold significant importance as they significantly impact the accuracy of estimation and regression fitting during model training. In the conventional method, these parameters are randomly initialized. However, due to their dynamic nature during network training, this paper adopts the IBES method to determine an optimal initial parameter set (wi, bi). The objective of this approach is to enhance the ability and efficiency of network in learning feature inputs.
2.5. BES Optimization Algorithm
The bald eagle search (BES) optimization algorithm is a recently developed metaheuristic approach [49]. This algorithm possesses its own exploration and exploitation capabilities, allowing it to effectively search for globally optimal solutions to nonlinear optimization problems while exhibiting fast convergence speed and strong learning capabilities [50]. At the core of the BES algorithm lies the idea of mimicking the hunting behavior of bald eagles. By leveraging variations in their positions, this algorithm seeks to locate individual optimal solutions, thereby contributing to the search for a global optimum.
Here, m indicates the number of local variables, denotes the predicted value, and yi represents the actual value.
Here, Pbest denotes the current optimal position in the search, α is a parameter that controls the changes in position, α ∈ (1.5, 2], and Pmean represents the current average distributed position in the ongoing search.
In the given context, the shape change parameters are denoted as a and R, a ∈ (5, 10], R ∈ (0.5, 2). Further, θ1(i) represents the polar angle, while r1(i) represents the polar radius during the spiral flight of the bald eagle. The function rand generates a random value within the range of (0,1). Meanwhile, x(i) and y(i) represent the position of the bald eagle in polar coordinates, with values falling within the range of (-1,1). Pi+1 corresponds to the next updated position.
2.6. IBES Optimization Algorithm
The traditional BES algorithm demonstrates excellent optimization capabilities within the search space, requiring minimal adjustable parameters and offering ease of implementation. However, during the training process, the algorithm still encounters the following challenges: (1) As the number of iterations increases, the BES algorithm tends to become trapped in local optima, resulting in lower convergence accuracy. (2) In high-dimensional search spaces, the exploration and exploitation abilities of the BES algorithm can diminish. This imbalance negatively impacts both the local and global optimization capabilities, resulting in slow convergence speed and a need for enhanced search efficiency. These issues highlight areas that require improvement in order to enhance the effectiveness and efficiency of the BES algorithm during the training process.
2.6.1. Levey Flight Strategy
2.6.2. Dynamic Adaptive Inertia Weight
2.6.3. Golden Ratio Coefficients
The diving stage of the bald eagle, where it captures prey, plays a crucial role in determining the convergence speed of the BES algorithm. In this stage, the BES algorithm incorporates the golden ratio coefficients from the golden sine algorithm [51] as a local operator in the position updating formula. Furthermore, a warning threshold A is set to scan regions that are likely to yield favorable outcomes, effectively narrowing the search range.
Here, r1 denotes a randomly generated number within the range of [0, 2π], while r2 represents a random number in [0, π]. In addition, the threshold value A is set to 0.6, and Equation (25) needs to satisfy the condition A > r.
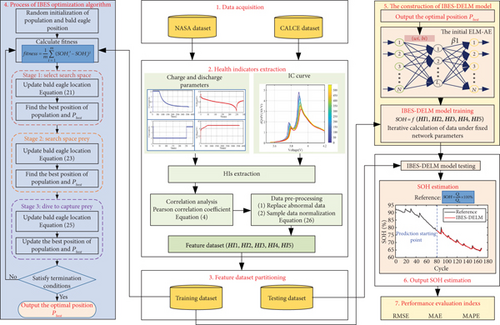
IBES assists DELM in automatically learning and extracting crucial features from data through parameter optimization, thereby enhancing the model’s expressiveness and accuracy. Through continuous iterations, the IBES algorithm systematically searches for the optimal individual and determines the optimal position, denoted as Pbest, within the solution space. This optimal position represents the best feature subset. This process not only reduces dimensionality but also improves the generalization ability of the model. The key parameters of DELM, such as the connection weights wi and thresholds bi between the initial input layer and the hidden layer of the initial ELM-AE, are then set to their optimal values corresponding to the optimal feature subset obtained through IBES. These adjusted parameters contribute to improving the training speed and learning capability of the DELM network.
To recapitulate, the SOH within LiBs undergoes a gradual and slow-varying change. In real-world scenarios, the choice of an appropriate model is crucial for accurately estimating SOH. The IBES-DELM model has displayed exceptional performance, making it an ideal selection for such purposes. The complete framework for SOH estimation is visually illustrated in Figure 7.
3. Results and Analysis
3.1. Parameter Settings and the Estimation Results of SOH Model
Here, the sample eigenvalues before and after data training are represented by y and y∗, respectively.
To evaluate the performance of the proposed method for SOH estimation, HI1~HI5 are utilized as input features for the estimation model, while the lithium-ion battery SOH values are considered as the output. The neural network architecture is configured with 5 neurons in the input layer, 6 neurons in the hidden layer, and 1 neuron in the output layer. In the IBES-DELM model, the population size of the bald eagles is set to 20, and the dimension of the fitness function D is 16. The maximum iteration times T is set to 100, while the position control parameter α is set to 2. The shape change parameters a and R are assigned values of 10 and 1.5, respectively. The motion intensities c1 and c2 are both set to 2. The upper and lower bounds for the inertia weight are set to 0.9 and 0.4, respectively. The search boundaries for the bald eagle are set to 1 and -1.
Figure 8 provides a visual representation of the SOH estimation results and error analysis for different models on the NASA battery dataset. On the other hand, Figure 9 depicts the performance of various models in estimating the SOH curve on the CALCE battery dataset. The analysis of the estimation results and errors highlights the superior performance of the IBES-DELM model in effectively capturing the SOH curve and delivering high fitting accuracy. The IBES-DELM model exhibits the capability to track the entire degradation process of LiBs accurately and capture local fluctuations well, showcasing enhanced accuracy and robustness. This signifies the optimization effect of IBES on DELM, achieving a balance between local and global searches, improving search efficiency, and enabling more accurate SOH estimation. In terms of error results, there may be a few individual data points with relatively large errors among the 7 battery samples. These errors could be attributed to complex internal electrochemical reactions within the batteries, environmental differences, and other factors. However, the errors for most data points are small and close to zero. The overall estimation error does not exceed 1%, further demonstrating the capability of the IBES-DELM model to accurately estimate the SOH.
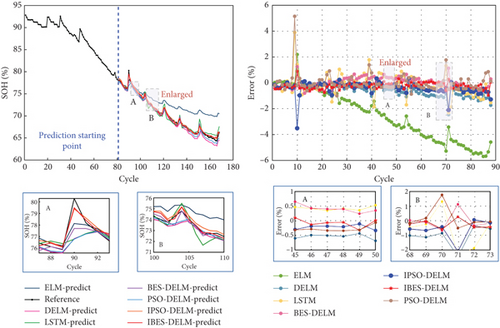
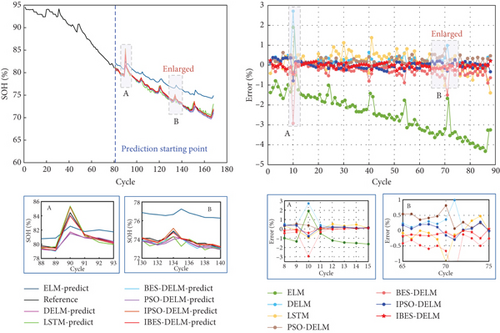
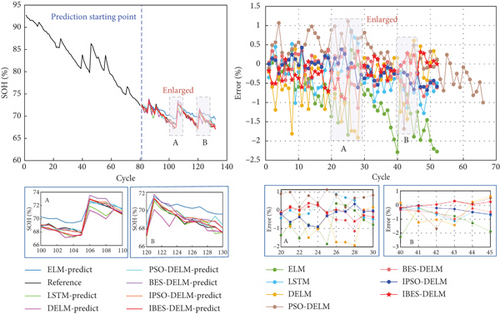
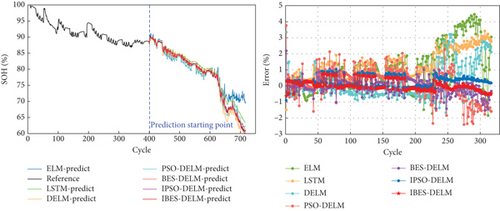
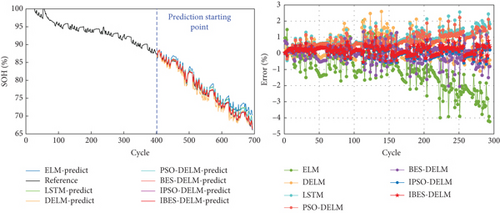
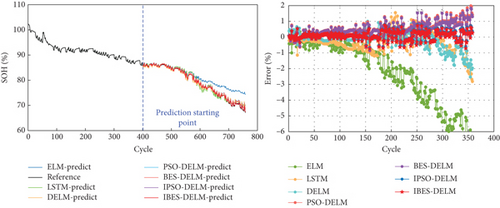
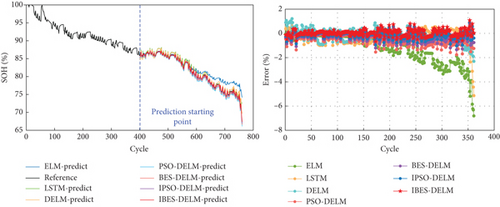
The ELM model is capable of effectively tracking the overall degradation trend of SOH in LiBs. However, it faces difficulties in promptly capturing localized capacity regeneration phenomena. This is mainly due to the randomly assigned weights wi and thresholds bi in the ELM model, which introduce instability in its later-stage predictions. Consequently, the ELM model gradually deviates from the actual values, resulting in the highest overall estimation error. In contrast, the DELM model exhibits comparable learning capabilities to LSTM and demonstrates superior generalization by effectively capturing complex relationships within large learning datasets. However, it is still susceptible to fluctuations caused by the randomly determined parameters. As a result, the prediction curve of the DELM model displays significant fluctuations, with a maximum error ranging from 3% to 4%.
The PSO-DELM and BES-DELM models slightly improve the accuracy of SOH estimation compared to the ELM and DELM models. However, they demonstrate excessive sensitivity to the positioning of the data and are less effective in capturing data fluctuations. In the later stages, these models may encounter overfitting or underfitting issues due to data fluctuations, resulting in an overall error ranging from 2% to 3%.On the other hand, the IPSO-DELM model performs well in terms of estimation accuracy, exhibiting relatively small errors. However, when compared to the IBES-DELM model, it shows relatively inadequate convergence and exhibits less stability in representing and fitting battery degradation data. Overall, the IBES-DELM model stands out by effectively capturing the complex degradation patterns of LiBs, displaying superior estimation accuracy, stability, and robustness.
3.2. Model Performance Analysis
Here, n represents the total number of samples, while SOHi and denote the true value and predicted value for the ith sample, respectively.
Table 2 presents the comparative results of evaluation indicators using different cycling data for LiBs. The findings clearly demonstrate that the IBES-DELM model outperforms other models in terms of fitting performance. Particularly, the IBES-DELM model excels in accuracy and stability for each battery sample, highlighting its superior advantages. Specifically, when compared to the BES-DELM estimation model, the IBES-optimized model reduces the RMSE indicators for the seven different battery samples by 0.12%, 0.23%, 0.30%, 0.36%, 0.36%, 0.34%, and 0.14%, respectively. The MAPE values are reduced by 0.05%, 0.12%, 0.05%, 0.11%, 0.19%, 0.18%, and 0.17%, respectively. The MAE values are reduced by 0.31%, 0.17%, 0.18%, 0.01%, 0.10%, 0.01%, and 0.01%, respectively. These results indicate that, under identical conditions, the IBES-DELM model achieves varying degrees of reduction in RMSE, MAE, and MAPE indicators, highlighting its superior fitting performance compared to other models. This advantage significantly facilitates accurate estimation and prediction of the health status of lithium-ion batteries, playing a vital role in battery management and maintenance. It provides robust support for extending battery life and enhancing system reliability.
| Battery | ELM | LSTM | DELM | PSO-DELM | BES-DELM | IPSO-DELM | IBES-DELM |
|---|---|---|---|---|---|---|---|
| RMSE | |||||||
| B005 | 2.110 | 0.859 | 0.726 | 0.504 | 0.437 | 0.333 | 0.319 |
| B007 | 2.641 | 0.478 | 0.392 | 0.274 | 0.243 | 0.188 | 0.154 |
| B018 | 1.137 | 0.603 | 0.539 | 0.456 | 0.400 | 0.308 | 0.105 |
| CS2-35 | 2.804 | 1.453 | 1.087 | 0.944 | 0.469 | 0.177 | 0.107 |
| CS2-36 | 1.544 | 0.862 | 0.753 | 0.699 | 0.530 | 0.240 | 0.169 |
| CS2-37 | 2.386 | 0.727 | 0.594 | 0.477 | 0.410 | 0.081 | 0.071 |
| CS2-38 | 1.721 | 0.665 | 0.553 | 0.451 | 0.204 | 0.098 | 0.063 |
| MAE | |||||||
| B005 | 1.163 | 0.618 | 0.674 | 0.403 | 0.305 | 0.269 | 0.251 |
| B007 | 2.469 | 0.242 | 0.371 | 0.339 | 0.217 | 0.145 | 0.097 |
| B018 | 0.938 | 0.658 | 0.567 | 0.561 | 0.315 | 0.239 | 0.265 |
| CS2-35 | 2.053 | 1.300 | 0.788 | 0.777 | 0.360 | 0.323 | 0.254 |
| CS2-36 | 1.222 | 0.733 | 0.645 | 0.564 | 0.396 | 0.308 | 0.205 |
| CS2-37 | 2.224 | 0.571 | 0.568 | 0.526 | 0.390 | 0.225 | 0.209 |
| CS2-38 | 1.213 | 0.571 | 0.449 | 0.427 | 0.364 | 0.236 | 0.192 |
| MAPE | |||||||
| B005 | 2.410 | 0.516 | 0.380 | 0.332 | 0.318 | 0.110 | 0.010 |
| B007 | 2.931 | 0.433 | 0.278 | 0.255 | 0.167 | 0.010 | 0.002 |
| B018 | 0.703 | 0.539 | 0.456 | 0.235 | 0.179 | 0.019 | 0.004 |
| CS2-35 | 1.977 | 1.561 | 1.474 | 1.260 | 0.017 | 0.010 | 0.003 |
| CS2-36 | 1.865 | 1.037 | 0.980 | 0.642 | 0.098 | 0.082 | 0.004 |
| CS2-37 | 2.107 | 1.607 | 1.053 | 0.009 | 0.008 | 0.007 | 0.003 |
| CS2-38 | 2.049 | 1.832 | 1.436 | 0.009 | 0.007 | 0.005 | 0.002 |
Figure 10 depicts the estimation performance of different models on SOH through a visual representation using the numerical values derived from Table 2. This bar chart provides a concise and clear comparison of the models’ performance based on the indicators. The IBES-DELM model showcases exceptional accuracy in estimating SOH, with RMSE values below 0.4% and MAE values below 0.3% across all seven battery samples. Moreover, the MAPE values remain consistently low, not exceeding 0.1%. Remarkably, the IBES-DELM model exhibits outstanding performance in MAPE values for the CS2-36, CS2-37, and CS2-38 battery samples, approaching an error margin of 0. This noteworthy achievement indicates the highly accurate estimation of model and prediction of SOH for these samples. Such results hold great practical significance in real battery management systems, especially in applications where precise estimation of battery states is critical.
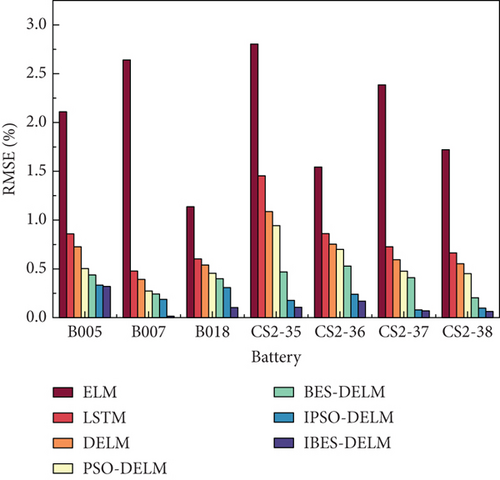
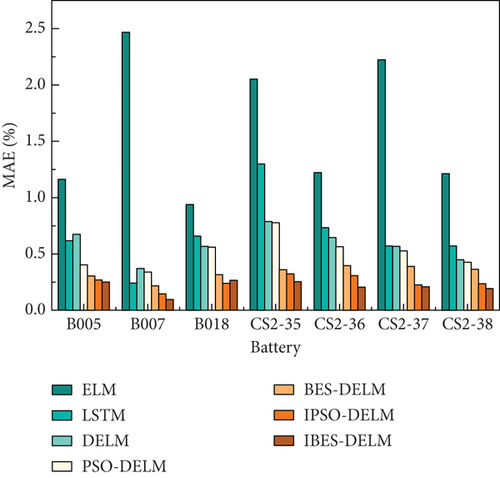
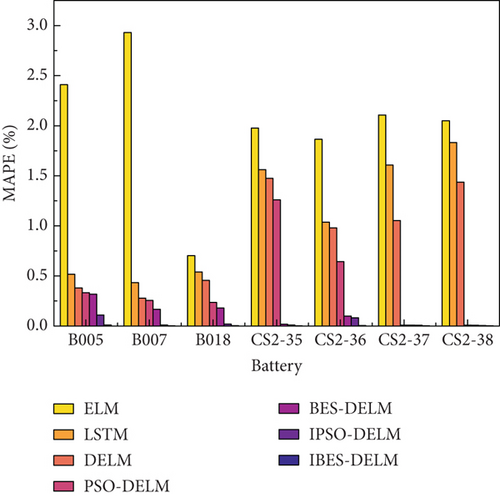
Table 3 presents a comparison of different methods using the NASA dataset. In Reference [52], the improved quantum particle swarm optimization (IQPSO) algorithm was employed to optimize the hyperparameters of the LSTM model, resulting in the IQPSO-LSTM model for SOH estimation. Reference [53] proposed an improved particle swarm optimization (IPSO) algorithm to optimize the SOH estimation model of GPR, providing only RMSE and MAE values. Upon careful examination, it is evident that the IBES-DELM model exhibits superior estimation results when applied to the NASA dataset. Its MAPE value is significantly lower compared to the value reported in Reference [52], while its RMSE and MAE values are lower than those of the other two methods. It is noteworthy that the method utilized in this paper yields smaller errors, effectively enhancing the accuracy of SOH estimation.
| RMSE (%) | MAE (%) | MAPE (%) | |||||||
|---|---|---|---|---|---|---|---|---|---|
| Battery | IBES-DELM | Ref. [52] | Ref. [53] | IBES-DELM | Ref. [52] | Ref. [53] | IBES-DELM | Ref. [52] | Ref. [53] |
| B005 | 0.319 | 0.6454 | 0.3505 | 0.251 | 0.4931 | 0.2663 | 0.010 | 0.6485 | — |
| B007 | 0.154 | 0.5219 | 0.4668 | 0.097 | 0.419 | 0.375 | 0.002 | 0.5296 | — |
| B018 | 0.105 | 0.6085 | 0.8055 | 0.265 | 0.4658 | 0.6196 | 0.004 | 0.608 | — |
Table 4 illustrates the comparison results of various methods using the CALCE dataset. In Reference [54], a layer-wise relevance propagation-driven (LRP-driven) CNN model was proposed for SOH estimation. Reference [55] utilized an improved bidirectional gated recurrent unit method with an attention mechanism (BiGRU-AM) for SOH prediction. The comparative analysis reveals that the estimation method employed by the IBES-DELM model outperforms others when applied to the CALCE dataset, with lower RMSE, MAE, and MAPE values in comparison to Reference [54, 55]. For instance, the IBES-DELM model reduces the RMSE, MAE, and MAPE values of the CS2-37 battery by 1.74%, 1.24%, and 2.0%, respectively, in comparison to Reference [55]. Furthermore, compared to Reference [55], the IBES-DELM model decreases the RMSE, MAE, and MAPE values of the CS2-37 battery by 0.52%, 0.25%, and 0.57%, respectively. These findings further emphasize the minimal estimation error of the IBES-DELM model on these samples, effectively enabling accurate prediction of SOH.
| RMSE (%) | MAE (%) | MAPE (%) | |||||||
|---|---|---|---|---|---|---|---|---|---|
| Battery | IBES-DELM | Ref. [54] | Ref. [55] | IBES-DELM | Ref. [54] | Ref. [55] | IBES-DELM | Ref. [54] | Ref. [55] |
| CS2-35 | 0.107 | 1.233 | 0.34 | 0.254 | 1.076 | 0.55 | 0.003 | 1.336 | 0.45 |
| CS2-36 | 0.169 | 2.301 | 0.63 | 0.205 | 1.838 | 0.52 | 0.004 | 2.383 | 0.68 |
| CS2-37 | 0.071 | 1.816 | 0.59 | 0.209 | 1.446 | 0.46 | 0.003 | 2.020 | 0.58 |
| CS2-38 | 0.063 | 9.303 | 0.41 | 0.192 | 9.216 | 0.33 | 0.002 | 11.072 | 0.40 |
4. Conclusion
To tackle the nonlinear and time-varying challenges of LiBs in practical operations, we propose an innovative approach that integrates the DELM and IBES algorithms. This integration is aimed at achieving reliable and accurate prediction of state of health (SOH) for LiBs. By addressing the limitations encountered in traditional DELM models, such as unstable network behavior and low convergence accuracy due to randomly generated key parameters, we incorporate the IBES algorithm. This integration optimizes the key parameters of the DELM model, resulting in the development of the IBES-DELM model. Consequently, improved network stability and enhanced convergence accuracy are achieved. Additionally, we extract five physically meaningful HIs that are suitable for real-world conditions and daily LiB operations. The Pearson correlation coefficient analysis demonstrates a strong correlation between the extracted HIs and SOH. Finally, the proposed method is validated using NASA and CALCE battery datasets. Experimental results demonstrate that compared to other models, the IBES-DELM estimation model has advantages in exploration ability, high convergence accuracy, and effectively improving the precision and stability of model predictions, achieving accurate SOH estimation and reliable forecasting. These results highlight the superior performance of the IBES-DELM model, aiding in timely detection of battery performance degradation trends, implementing corresponding maintenance and optimization measures to extend battery life, and enhancing system reliability.
In future work, it would be valuable to gather and utilize a wider range of lithium-ion battery datasets to evaluate the performance of model across different types of batteries and operating conditions, enhancing the diversity of the dataset. This would involve conducting performance tests under varying temperature changes, discharge rates, cycles, and usage environments. By expanding the dataset and improving the generalization ability of model, its applicability to real-world scenarios can be ensured. Furthermore, this study only extracts five HIs to train the prediction model. In future endeavors, we can explore the extraction of more concise, physically meaningful, and highly effective indirect characteristic variables. By thoroughly understanding the working principle, electrochemical processes, and degradation mechanisms of lithium-ion batteries, we can identify multiple physical parameters closely associated with changes in SOH. These parameters can then undergo multivariate correlation analysis to evaluate their physical interpretability and operational suitability in relation to SOH changes. This approach will enhance current research methods and improve the performance of SOH estimation.
Conflicts of Interest
The authors declare no conflict of interest.
Authors’ Contributions
Yan Chen was responsible for the funding acquisition and project administration and wrote, reviewed, and edited the manuscript. Junli Meng wrote the original draft, reviewed and edited the manuscript, and was responsible for the methodology. Shunyang Ming was responsible for the validation. Gengxin Tong was responsible for the resources and visualization. Ziyi Qi was responsible for the resources and visualization.
Acknowledgments
This research has received support from the Science and Technology Project of Chongqing Municipal Education Commission (KJZD-M202301104).
Open Research
Data Availability
The data supporting the findings of this study are openly accessible and can be obtained from the NASA PCOE Research Center (https://ti.arc.nasa.gov/tech/dash/groups/pcoe/prognostic-data-repository/#battery) and CALCE Battery Data (https://web.calce.umd.edu/batteries/data.htm).


