Early Warning Simulation of Urban Vulnerability in Coal-Resource-Based Cities Based on System Dynamics
Abstract
Coal-resource-based cities, as one of the important types of typical resource-based cities in China, have strong characteristics of instability, sensitivity, and fragility, exhibiting a series of vulnerability features of the human-land system. Previous studies have lacked a deeper investigation into the vulnerability of such cities from the perspective of coupling feedback mechanisms among various elements or subsystems. This paper adopts Bohle et al.’s “Dual Structure Model” of vulnerability to establish an indicator system for vulnerability warning in coal-resource-based cities. Using Fushun City as a sample, a dynamic simulation model of vulnerability in coal-resource-based cities is constructed based on system dynamics for warning simulation calculations, analyzing the evolution trend of vulnerability in Fushun City from 2010 to 2022. The results show the following: (1) from 2010 to 2022, the urban vulnerability of Fushun City transitioned from a medium warning level to a relatively safe level, showing a trend of annual reduction and improvement, undergoing three development stages of significant reduction, fluctuation stabilization, and slight rebound. (2) Due to the causal relationships among various elements within the vulnerability subsystems of Fushun City, differences exist in the contribution levels of vulnerability subsystems during the period 2010–2022, under the combined effects of sensitivity and adaptability factors. The contribution rate of the natural subsystem was the highest from 2010 to 2014, while, from 2016 to 2019, urban vulnerability began to shift towards an economically and socially dominant type. Influenced by the pandemic, Fushun City’s overall vulnerability has shown an upward trend since 2020 compared to the previous stage. Finally, specific policy suggestions are proposed for Fushun City to cope with vulnerability changes based on the analysis results, providing a theoretical basis for achieving sustainable development in such coal-resource-based cities.
1. Introduction
Coal-resource-based cities have always played a crucial role in promoting national construction and social development and improving people’s livelihoods. However, after experiencing long-term large-scale mining, coal-resource-based cities in China are facing serious problems such as resource depletion, industrial decline, and ecological degradation. There are 136 coal-resource-based cities in China, accounting for 15% of the total number of cities in the country. 67 of the 262 defined resource-based cities in the country tend to be exhausted, including 38 coal-resource-based exhausted cities. These cities have entered a stage of transformation and development. The sustainable development of resource-based cities has always been highly concerned by the State Council. Since 2013, the central government has successively issued relevant plans and policies, clarifying that resource-based cities should actively explore and implement transformation, while ensuring development and also paying attention to sustainability. In order to ensure the sustainable economic and social development of coal-resource-based cities, conducting vulnerability research on typical coal-resource-based cities has enormous academic and practical value for the survival and development of coal-resource-based cities in China [1].
In 1945, White put forward the viewpoint of “adaptation and adjustment” through the study of floods, which opened the study of vulnerability [2]. In 1974, White provided the initial definition of vulnerability [3]. After the 21st century, research on vulnerability has begun to diversify, and the concept of vulnerability has been continuously enriched and expanded. Relevant scholars and the fourth IPCC report have also defined vulnerability from different research backgrounds and perspectives [4–7]. From the initial single connotation of “risk,” it has gradually expanded to a collection of multiple elements such as exposure, sensitivity, resilience, and adaptability. The widely recognized definition of vulnerability is as follows: an inherent attribute determined by the internal structure of a system, group, or organism that is sensitive to external interference or infringement and is difficult to restore to its original state after being violated. In addition, the successive entry of science and technology, such as measurement techniques and quantitative analysis models, has further standardized the research on vulnerability. The research objects, fields, and methods of vulnerability are also constantly iteratively updated. Vulnerability is gradually being applied in the economic and social system, sustainable development, and even the global ecological environment [8–12].
With the increasingly serious global urban problems and urban diseases, cities have become the places where the contradictions and conflicts between economic development and ecological environment protection are most intense. Cities are a complex “human-land” system composed of multiple subsystems such as the environment, economy, and society. People and land are interconnected and interact with each other in this specific region of the city, forming a dynamic structure. It is a dynamic and open coupling system that exists through the joint action of subsystems such as the economy, society, and ecological environment. Urban vulnerability is a relatively new research topic, and its concept is derived from the traditional concept of vulnerability. Urban vulnerability refers to the possibility that within a specific area of a city, due to the instability of its internal structure and the interference of external forces dominated by human activities, it exhibits sensitivity to disturbances and lacks the ability to respond, making it prone to evolving towards an uncoordinated development direction between humans and nature, economy, society, and ecological environment. Vulnerability, as an inherent attribute of a city, accompanies the entire development process of the urban system. Urban vulnerability can be divided into external vulnerability and internal vulnerability, with a focus on exploring the response capabilities of regions, cities, and populations to changes in the external environment. The internal vulnerability of cities is mainly studied for single- or multiple-coupled systems [13–15]. Coal-resource-based cities, as a typical type of resource-based city, are greatly affected by factors such as a single industrial structure, unemployment, resource depletion, and ecological damage. These factors make the economic, social, and resource and ecological environment subsystems of coal-resource-based cities highly sensitive. In addition, coal-resource-based cities have weak response capabilities, leading to a series of urban vulnerability problems such as stagnant economic development, serious social contradictions and poverty among residents, low resource utilization rates, and frequent geological disasters, making the urban structure and function vulnerable to damage. By conducting research on urban vulnerability, we can effectively curb the further development and amplification of urban vulnerability. At present, many international scholars have carried out a lot of research on urban vulnerability, and these research results are also of practical significance, providing reference for the vulnerability research and sustainable development of resource-based cities in China [16–19]. Due to the diversity of resources and the actual situation of cities, scholars have different understandings and focus on the vulnerability of resource-based cities, and the concept of urban vulnerability can be defined from three perspectives: the economic system, the ecological and human-land coupling system, and the social system. When conducting corresponding research, there are also differences in the types and quantities of subsystems selected, which is reflected in the selection of indicators, and it is often necessary to first determine which indicators to select and how to determine the weights of these indicators. Currently, there are methods such as the information content method, the data analysis method, the principal component analysis method, the entropy weight method, the empirical method, the grey correlation method, and the DRASTIC standard method [20–23]. According to different types of resources, evaluation indicators for the vulnerability of resource-based cities are also selected from different perspectives, such as ecological vulnerability, coal and oil economic system vulnerability, and social vulnerability [24–27], and the vulnerability assessment of the human-land system has become a new research field for the sustainable development of resource-based cities. Scholars have proposed many effective evaluation models or methods for vulnerability assessment of different cities, which are relatively rare in research specifically targeting the vulnerability of resource-based cities. The existing evaluation methods also have their own advantages [28, 29]. Although some methods are simple, they do not fully consider the complexity, multilevel nature, and uncertainty of the human-land system in resource-based cities, and their effectiveness and accuracy are worth exploring. Some methods can obtain comprehensive conclusions, but their model structure is complex and requires many parameters. In addition, with the rapid development of geographic information systems and remote sensing systems, some scholars have applied them to the study of urban vulnerability [30–33].
Summarizing the previous research, it was found that the overall problems in existing research on vulnerability of resource-based cities include the following: firstly, there is no unified standard for the evaluation index system of vulnerability of resource-based cities; there are various evaluation index systems; and there is a lack of universal and reliable comprehensive evaluation index elements, resulting in research results that are not comparable. The current major challenge could be solved by enriching evaluation indicator elements to minimize evaluation imbalance. Secondly, scholars have conducted more research on the vertical dynamic evolution process of a resource-based city or static horizontal comparison of cities, and existing research on the dynamic evolution and early warning prediction of vulnerability in resource-based cities at different periods is rarely involved, and the research results lack the perspective of a natural economic social coupling system, revealing the laws of human-land system movement in resource-based cities and the root causes of multiple problems in resource-based cities. Therefore, when evaluating the comprehensive vulnerability of resource-based cities, the evolution characteristics of the vulnerability of each subsystem should be analyzed to reveal the spatiotemporal evolution mechanism of their comprehensive vulnerability and provide assistance for the economic transformation and social development issues of such resource-based cities from a more detailed microperspective.
It is considered that the human-land system in coal-resource-based cities is a complex, multilevel nonlinear system that is a natural economic and social composite system. The changes in system behavior are influenced by multiple elements and subsystems and have strong characteristics of human-environment interaction. Due to the complex characteristics of the human-land system, the system is divided into natural, economic, and social subsystems. Through an in-depth analysis of the vulnerability coupling process and mechanism between various subsystems and system elements of the human-land system, a vulnerability warning model for this type of special urban human-land system is established. Based on an in-depth analysis of the process and mechanism of vulnerability coupling in the human-land system, this paper adopts a new research framework of the dynamic vulnerability early warning model for the human-land system of resource-based cities, and a vulnerability warning model for this type of special urban human-land system is established. Then, Fushun, a case city with coal resource depletion, was selected to reveal the evolution trend and early warning results of human-land system vulnerability in the city from 2010 to 2022. Furthermore, the vulnerability and problems of the human-land system in Fushun from different perspectives were analyzed, pointing out the direction for Fushun to pursue sustainable development and providing decision-making support and the basis for the development of other coal cities.
2. Construction of the Early Warning Indicator System
In the process of enriching the connotation of vulnerability and expanding its application fields, vulnerability research has emerged with numerous analytical frameworks that explore the interaction between vulnerability causality and its influencing factors [34–37]. This is the methodological basis for conducting in-depth vulnerability analysis and establishing vulnerability assessment and early warning indicators. Typical of these frameworks is the work of Chambers [38], who proposes that vulnerability encompasses both “internal” and “external” aspects. The external aspect refers to the system’s exposure to disturbances and stress, while the internal aspect represents the system’s ability to respond to external pressures and disturbances. Bohle [39] believes that adaptability is a very complex issue, and he has established the “Dual Structure Model” for vulnerability analysis based on Chambers’ perspective. A comprehensive analysis of vulnerability components and their functional relationships has been conducted from both internal “response” and external “exposure” aspects, taking a significant step forward in the research of the vulnerability analysis framework (Figure 1). The “Dual Structure Model” can better reflect the causal and interactive relationships formed by vulnerability, gradually becoming a new paradigm and analytical tool for exploring the mechanism of human-land relationship, and has been widely recognized by the academic community. Therefore, the “Dual Structure Model” was chosen as the theoretical framework to construct an urban vulnerability evaluation and early warning indicator system in this paper.
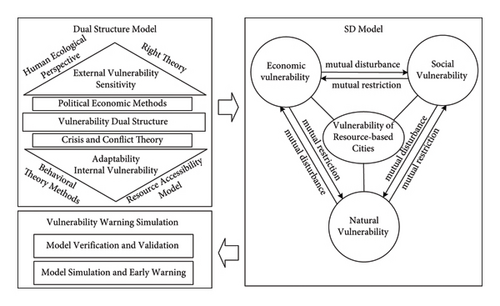
This paper is based on the concept of the “Dual Structure Model,” with sensitivity and adaptability as the factor layer and society, economy, and nature subsystems as the scheme layer to construct a specific indicator system. Among them, sensitivity refers to the response degree of the system to interference factors, which is a prerequisite for the vulnerability of resource-based cities to be manifested. Adaptability refers to the ability of resource-based cities to recover or adapt to the effects of disturbances. The indicators corresponding to the factor layer and the scheme layer mainly come from two aspects: (1) High-frequency indicators: sort out the early warning indicators for urban vulnerability evaluation in the literature database and select the high-frequency indicator. These indicators are mainly used to retrieve the representative relevant literature from the Chinese social science citation index (CSSCI), the science citation index (SCI), the engineering index (EI), and other management core journals from 2001 to 2023 [40–43]. (2) Characteristic indicators: mainly referring to construction requirements of the “Several Opinions of the State Council on Promoting Sustainable Development of Coal-Resource-Based Cities” formulated and issued by the State Council, some characteristic indicators were selected from it. It is ensured that the entire indicator system not only conforms to the standards recognized by the academic community but also reflects the national strategic direction and the overall development characteristics of resource-based cities.
After merging the above two types of indicators and eliminating duplicate indicators, 47 indicators, including the target layer, the scheme layer, the factor layer, and the indicator layer, were finally determined based on the principles of operability, integrity, hierarchy, and dynamism. The specific early warning indicator system is shown in Table 1.
| Target layer | Scheme layer | Factor layer | Indicator name and unit | Attribute | Weights Wi |
|---|---|---|---|---|---|
|
|
|
Number of mining workers① (10,000 people) (D11) | − | 0.0145 |
| Coal production① (10,000 tons) (D12) | − | 0.0103 | |||
| Proportion of coal to industrial output value① (%) (D13) | − | 0.0144 | |||
| Proportion of state-owned enterprise output value to GDP① (%) (D14) | − | 0.0157 | |||
| Number of state-owned enterprises① (unit) (D15) | − | 0.0331 | |||
| Proportion of primary industry output value to GDP② (%) (D16) | − | 0.0178 | |||
| Energy consumption per unit of GDP② (Tons of standard coal/10,000 Yuan) (D17) | − | 0.0142 | |||
| Electricity consumption per unit of GDP② (KWh/10,000 Yuan) (D18) | − | 0.0173 | |||
|
GDP② (100 million Yuan) (D21) | + | 0.0182 | ||
| Primary industry output value② (100 million Yuan) (D22) | + | 0.0149 | |||
| Fixed assets investment② (100 million Yuan) (D23) | + | 0.0121 | |||
| Number of patent authorizations② (unit) (D24) | + | 0.0108 | |||
| Tertiary industry output value② (100 million Yuan) (D25) | + | 0.0244 | |||
| Nonstate-owned enterprises output value① (100 million Yuan) (D26) | + | 0.0153 | |||
| Fiscal self-sufficiency rate① (%) (D27) | + | 0.0168 | |||
| Proportion of tertiary industry employment② (%) (D28) | + | 0.0108 | |||
|
|
Industrial SO2 production② (tons) (D31) | − | 0.0332 | |
| Production of industrial solid waste② (10,000 tons) (D32) | − | 0.0232 | |||
| Soil erosion area① (square kilometer) (D33) | − | 0.0433 | |||
| Production of industrial wastewater② (10,000 tons) (D34) | − | 0.0332 | |||
| Production of industrial soot② (10,000 tons) (D35) | − | 0.0166 | |||
| Chemical fertilizer usage② (10,000 tons) (D36) | − | 0.0480 | |||
| Area of abandoned land① (km2) (D37) | − | 0.0110 | |||
|
Per capita environmental construction funds② (Yuan) (D41) | + | 0.0079 | ||
| Industrial sulfur dioxide removal rate② (%) (D42) | + | 0.0259 | |||
| Per capita cultivated land area② (hectare/person) (D43) | + | 0.0366 | |||
| Comprehensive utilization rate of industrial solid waste② (%) (D44) | + | 0.0164 | |||
| Industrial wastewater compliance rate② (%) (D45) | + | 0.0256 | |||
| Greening rate of built-up areas② (%) (D46) | + | 0.0200 | |||
| Per capita water supply② (km3/person) (D47) | + | 0.0147 | |||
| Forest coverage② (%) (D48) | + | 0.0280 | |||
| Domestic sewage treatment rate② (%) (D49) | + | 0.0160 | |||
|
|
Urban unemployment rate① (%) (D51) | − | 0.0257 | |
| Proportion of employees in the coal industry① (%) (D52) | − | 0.0144 | |||
| Engel’s coefficient of rural households② (%) (D53) | − | 0.0142 | |||
| Engel’s coefficient of urban households② (%) (D54) | − | 0.0113 | |||
| CPI② (%) (D55) | − | 0.0182 | |||
| Urban-rural income ratio① (%) (D56) | − | 0.0274 | |||
| Urban population density① (people/km2) (D57) | − | 0.0123 | |||
|
Natural population growth rate② (%) (D61) | + | 0.0502 | ||
| Proportion of nonagricultural population② (%) (D62) | + | 0.0163 | |||
| Per capita living area① (km2/person) (D63) | + | 0.0248 | |||
| Post and telecommunication business volume① (100 million Yuan) (D64) | + | 0.0330 | |||
| Total social consumer goods② (100 million Yuan) (D65) | + | 0.0149 | |||
| Per-capita disposable income of urban residents② (Yuan) (D66) | + | 0.0149 | |||
| Net income of farmers② (Yuan) (D67) | + | 0.0149 | |||
| Ending deposit balance② (100 million Yuan) (D68) | + | 0.0473 |
- Notes. ①Characteristic indicators; ②high-frequency indicators.
3. System Dynamics Early Warning Simulation
System dynamics (SD) can effectively feedback on the interaction of internal elements in a system and complete the thinking and research of complex problems through computer modeling. It is particularly suitable for analyzing and solving a series of nonlinear complex large-scale system problems, such as those in society, economy, ecology, and biology. Based on the aforementioned urban vulnerability assessment and warning indicator system, the system flow diagram, equations, and simulations are used to reveal the changing trends of economic, natural, social, and other factors in the urban system and predict the value of urban vulnerability warning indicators.
3.1. Research Object and Data Source
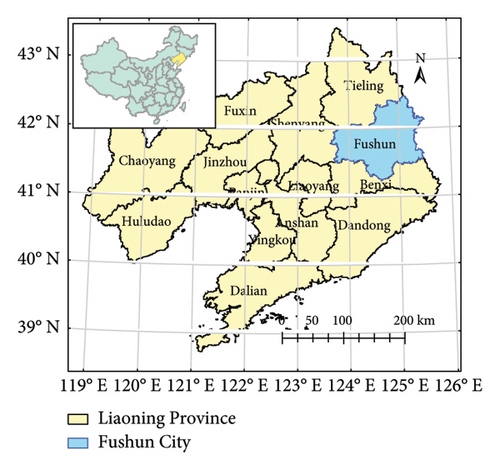
Fushun is a city that thrives on coal and is known as the “coal capital,” which is located in the northeast of Liaoning Province in China, with geographical coordinates of 123°39′–125°29′ E and 41°14′–42°29′ N, with a total area of 11,271.03 km2 (Figure 2). Fushun has a history of coal mining for hundreds of years, and there is Fushun West Open-pit Mine, the largest open-pit coal mine in Asia. At present, Fushun’s coal reserves have been mined by two-thirds, and the annual mining capacity is less than 3 million tons. How to find a new development path and get rid of dependence on coal while maintaining economic development is a difficult problem faced by the Fushun municipal government.
According to the characteristics of the urban system in Fushun, this paper selects data from the fields of economy, environment, resources, and society to carry out urban vulnerability evaluation and early warning research. The raw data in the model are sourced from the “China Urban Statistical Yearbook,” the “Fushun Statistical Yearbook,” and the “Fushun National Economic and Social Development Statistical Bulletin” in 2010–2012. For the convenience of research, some indicator data were processed, such as dividing the total social electricity consumption by the total GDP to represent the electricity consumption value of 10 000 RMB of GDP and dividing the number of beds in health institutions by the number of permanent residents to represent the number of beds per 10 000 people. To facilitate the calculation between variables, the units of the original data are converted to standard units. Partial missing data are filled in with interpolation from adjacent years. The parameters involved are derived based on historical data using methods such as arithmetic mean, development trend calculation, and regression analysis.
3.2. System Dynamics Flow Diagram and Equations
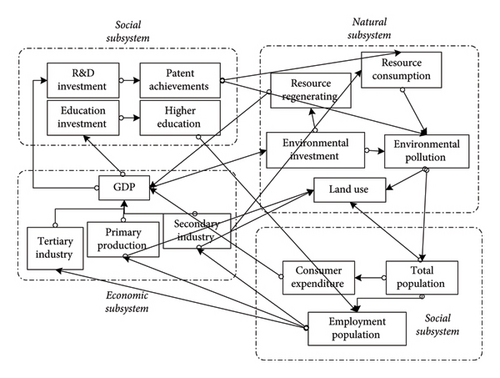
The resource-based urban system includes economic, social, and natural subsystems. In this large and complex system, the relationships among subsystems are complex and interrelated [44, 45]. Firstly, based on the interrelationships and input-output mechanisms between each subsystem, they are combined into a causal feedback structure of the entire complex system. The specific causal relationships and analysis between each subsystem are shown in Figure 3.
Secondly, based on the causal feedback relationship of the system, the Vensim software is applied to construct a resource-based city system structure flow diagram, as shown in Figure 4.
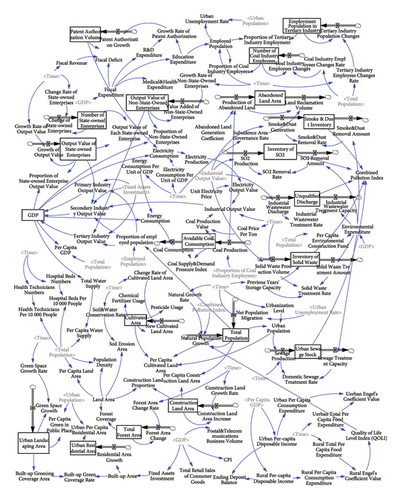
The model takes 2010 as the base year and 1 year as the step to simulate the main variable values from 2010 to 2022. In terms of model equation setting, for the quantity that remains unchanged or changes little, it is treated as a constant, such as unit electricity price = 0.5 Yuan/kWh and land area = 11,271.03 km2. For setting the initial values of the model, such as the initial values of state variables and some auxiliary variables, the statistical values of Fushun are adopted. Other equations are obtained by the multiple linear regression method, logical relationships between variables, or referring to the previous literature.
3.3. Model Verification
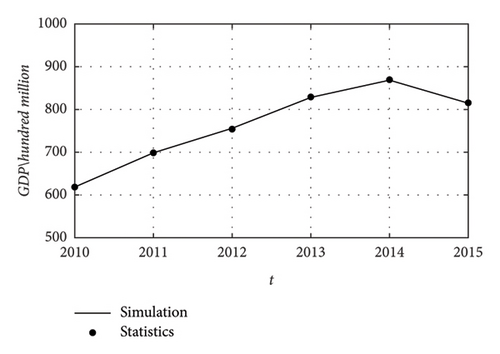
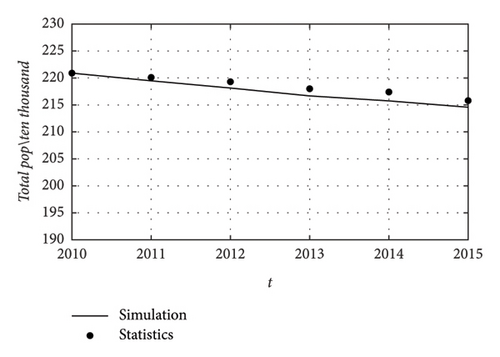
In this paper, the Vensim software developed by Ventana Systems, Inc. of the United States is used to model the vulnerability of resource-based urban systems. In order to verify the consistency between the calculated results of the model and the objective reality, the model was tested using historical data from Fushun (2010–2015), with 2010 as the reference year and 1 year as the step size. The data from 2010 to 2015 were used as the model validation data, and the simulated data were compared and analyzed with the actual data. The error between the simulated and actual values of various indicators is less than 10%, and the model can be used to alert the urban vulnerability data of Fushun for future several years (2016–2022). In order to verify the applicability and correctness of the model, this paper conducted applicability and consistency checks on the model.
3.3.1. Model Structure Verification
When establishing the system dynamics model, this paper made an in-depth study of the economic, social, and natural subsystems of the urban vulnerability system, established the structure and variable equation of this model based on the parameter correlation and characteristics of the actual system, and repeatedly confirmed that the model system was in line with the real situation of the actual system. The model is consistent with the structure of the actual system and conforms to the consistency rule.
3.3.2. Model Structure Stability Test
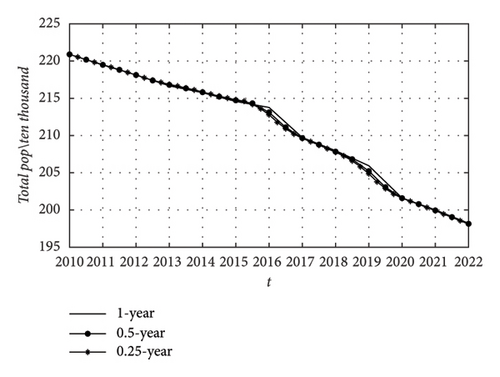
Using the method of the integral error test, taking the Total Population as an example, take ① STEP TIME = 0.25; ② STEP TIME = 0.5; and ③ STEP TIME = 1 different discrete time steps to test the model stability, and the result is shown in Figure 5(a). As can be seen from Figure 5(b), the change trend of the Total Population after the time interval change is consistent, and there is no obvious abnormality. Similarly, other variables also passed the same test.
3.3.3. Model Behavior Sensitivity Test
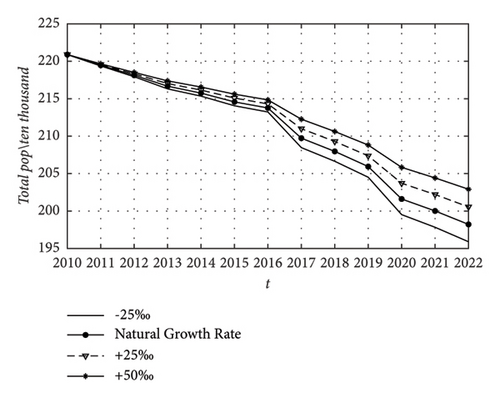
This part mainly tests whether the model is sensitive to numerical changes in parameters. Taking the Total Population as an example, the initial values are taken as follows: ① the natural growth rate is reduced by 25%; ② normal natural growth rate; ③ the natural growth rate is increased by 25%; and ④ the natural growth rate increases by 50%, and the test results are shown in Figure 5(b), which shows that the change of a parameter value will not have a great influence on the running results of the model, and the sensitivity of the model is good.
3.3.4. Model Behavior Consistency Test
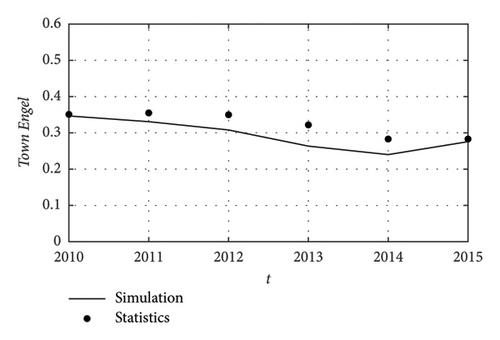
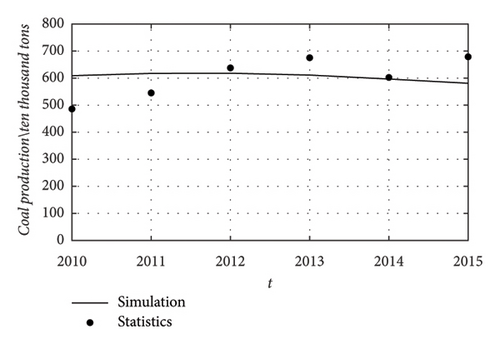
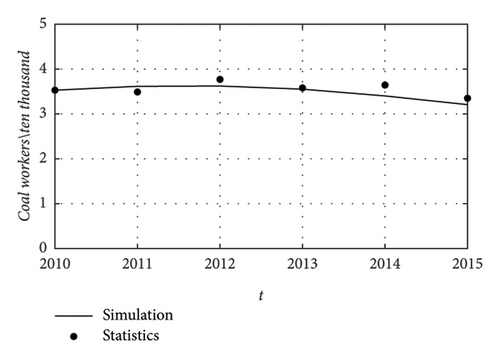
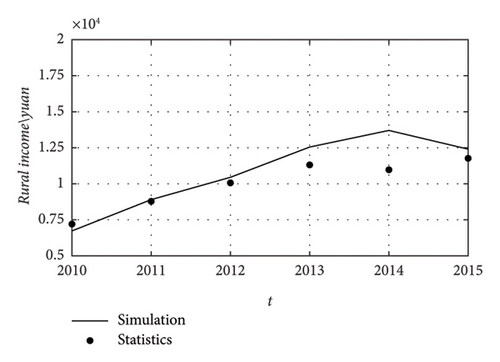
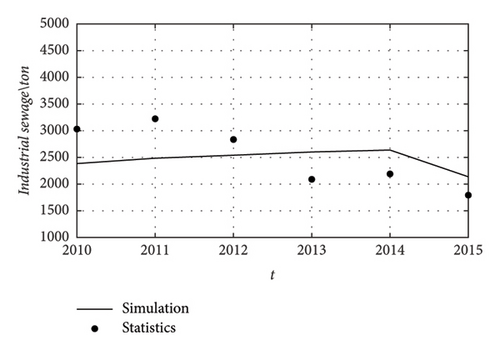
Among the 143 variable values simulated by this model from 2010 to 2015, 126 simulated values were within 10% of the actual values; that is, 88.11% of the simulated values met the consistency requirements, indicating that the consistency of the model is relatively high and the model is close to the actual situation. Figure 6 provides a visual comparison between the simulation and historical statistics of some indicators. The above tests show that the model has high applicability and stability and can be used for the urban vulnerability simulation of the early warning year (2016–2022) in Fushun.

3.4. Model Simulation
Using the historical data from 2010 to 2015, the established urban system dynamics model is simulated by the Vensim software, and the early warning values of urban indicators in Fushun from 2016 to 2022 are obtained. Table 2 shows some indicators predicted by urban system simulation from 2016 to 2022 in Fushun.
| Indicator name and unit | 2016 | 2017 | 2018 | 2019 | 2020 | 2021 | 2022 |
|---|---|---|---|---|---|---|---|
| GDP (100 million yuan) | 792.79 | 833.07 | 881.39 | 847.45 | 828.30 | 870.54 | 928.17 |
| Total population (10,000 people) | 213.76 | 209.73 | 207.96 | 205.94 | 201.60 | 200.01 | 198.21 |
| Coal production (10,000 tons) | 556.46 | 531.67 | 492.07 | 450.58 | 410.94 | 370.37 | 338.51 |
| Engel’s coefficient of urban households (%) | 0.32 | 0.30 | 0.28 | 0.31 | 0.32 | 0.315 | 0.28 |
| Per-capita GDP (Yuan) | 37086.7 | 39720.7 | 42381.2 | 41150.5 | 41084.9 | 43525.3 | 46827 |
| Industrial SO2 production (tons) | 101156 | 105529 | 109145 | 106768 | 105448 | 109732 | 113168 |
| Production of industrial wastewater (10,000 tons) | 2125.01 | 2176.53 | 2219.11 | 2191.12 | 2175.57 | 2226.02 | 2266.5 |
| Number of mining workers (10,000 people) | 2.96 | 2.70 | 2.29 | 1.87 | 1.47 | 1.06 | 0.73 |
| Per-capita disposable income of urban residents (yuan) | 25490.2 | 28585.8 | 31712.5 | 30266.1 | 30189 | 33057.1 | 36937.4 |
| Fixed assets investment (100 million yuan) | 180.247 | 172.273 | 162.706 | 169.424 | 173.217 | 164.852 | 153.442 |
4. Urban Vulnerability Early Warning
4.1. Data Standardization
4.2. Calculation of Index Weight
In a comprehensive evaluation, whether the weights are properly determined directly determines the accuracy of the evaluation results. Subjective weighting methods mainly include the AHP and Delphi methods, but they are subjective and cannot reflect the changes in weights with time. The entropy weight method is a commonly used objective weighting method that can not only reflect the effect value of index information but also overcome the information overlap among index factors has strong objectivity and is less affected by subjective judgment [46]. In this paper, the entropy weight method is used to calculate the weight of each index in Fushun (see Table 1). The numerical value of the weight of each early warning index in Table 1 represents the degree of influence of the index on vulnerability, and the determination of the weight of the early warning index provides a basis for the subsequent vulnerability early warning work.
4.3. Calculation of Urban Vulnerability
4.4. Early Warning Results and Analysis
4.4.1. Early Warning Interval Division
In current research, there is no unified standard for the classification of vulnerability levels in the academic community. Based on the analysis and summary of the comprehensive vulnerability calculation and evaluation of resource-based cities by scholars in the past, the vulnerability of resource-based cities is sequentially divided into five levels: low vulnerability, lower vulnerability, medium vulnerability, higher vulnerability, and high vulnerability. The vulnerability warning characterization states correspond to Safety Level I, Relatively Safe Level II, Warning Level III, Medium Alarm Level IV, and Heavy Alarm Level V.
Using the historical vulnerability assessment results from 2010 to 2015 and the vulnerability assessment results predicted by the above model from 2016 to 2022, the comprehensive vulnerability index of Fushun City in the study area from 2010 to 2022 was obtained, as shown in Figure 7.
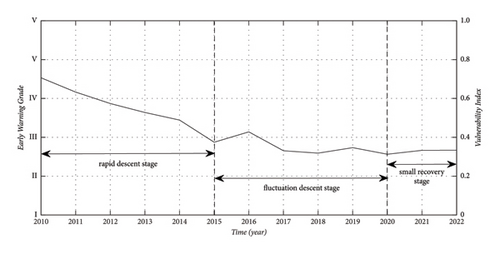
From the changes in urban comprehensive vulnerability in Figure 5, it can be seen that from 2010 to 2022, the urban comprehensive vulnerability index of Fushun decreased from 0.706 to 0.313, indicating that Fushun has transitioned from Medium Alarm Level IV to Relatively Safe Level II. The vulnerability development trend of the human-land system in the study area is good, and the vulnerability index has left the alarm state.
- (1)
The first stage (2010–2015) is a rapid decline stage. The vulnerability of the human-land system in Fushun has decreased from a moderate alarm state of 0.706 to a relatively safe state of 0.375. Over the past five years, the comprehensive index of urban vulnerability has decreased by 0.331, with an average annual decrease of 0.066. This stage is a rapid decline, and the urban vulnerability reduction is relatively significant. The warning situation has quickly been alleviated with significant improvements. Analyzing the reasons, Fushun City has comprehensively promoted the development of urbanization in Shenyang and Fushun since 2008 and has improved the construction of general social infrastructure. From 2008 to 2011, Fushun City received more than 1 billion RMB in general transfer payments from the central government. At this stage, the ecological environment and infrastructure of Fushun City have been greatly improved, resulting in a significant improvement in the overall vulnerability of Fushun City.
- (2)
The second stage (2016–2019) is the fluctuation decline stage. The vulnerability alarm situation of the urban system in Fushun shows a certain degree of volatility, with the comprehensive vulnerability index rebounding from 2016 to 0.428. Then, in 2017 and 2018, this index decreased to 0.331 and 0.318, respectively. The index also rose to 0.347 in 2019. The overall urban vulnerability index of Fushun remained stable, with an average annual decrease of 0.027 from 2016 to 2019. Although there were fluctuations during the 2016–2019 period, the vulnerability of the urban system in Fushun basically transitioned to a safer warning zone and left the alert state. The main reason is that the investment in ecological environment governance and infrastructure maintenance and construction gradually stabilized during this stage in Fushun City, while the adjustment of the urban economic structure is also steadily being implemented, and the comprehensive vulnerability of Fushun City also tended to stabilize.
- (3)
The third stage (2020–2022) is a slight rebound stage, and the vulnerability index of the city has shown a slight upward trend. Analyzing the reasons, this is mainly due to the overall economic downturn in China during the COVID-19 epidemic period, which has affected the overall urban development of Fushun.
4.4.2. Analysis of the Results from the Scheme Layer
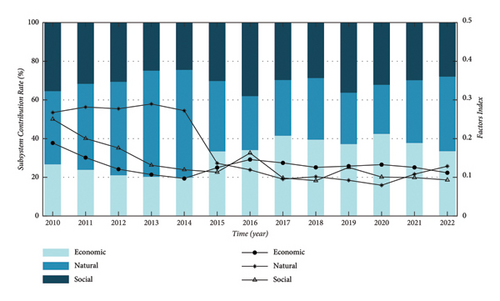
During the period from 2010 to 2022, the vulnerability index of each subsystem in Fushun showed a downward trend, but there were differences in the speed of changes in the vulnerability index of each subsystem and the contribution to the decline of the vulnerability index. The decline rate of the social subsystem is the fastest, at −5.379%, and its index score decreased by 0.16, with a decrease of 62.8%. This indicates that the negative impact of the social subsystem on Fushun is significantly reduced, with a contribution rate of 42.1% to the reduction of vulnerability, which is the main factor leading to the reduction of the vulnerability index. The economic and natural subsystems also showed a decrease, with a decrease of 36.82% and 34.09%, respectively, with contribution rates of 20.64% and 37.26%, totaling 57.9%. During the research period, the coefficient of variation of the descent rate of the natural subsystem was −6.109 (Table 3), which was not only significantly higher than the overall vulnerability but also higher than the economic and social subsystems with the largest dispersion of changes.
| Economy | Nature | Society | Vulnerability | |
|---|---|---|---|---|
| Average speed | −3.365 | −3.479 | −5.379 | −5.419 |
| Standard deviation | 14.389 | 21.260 | 24.008 | 11.502 |
| Coefficient of variation | −4.275 | −6.109 | −4.462 | −2.122 |
- (1)
From 2010 to 2014, the contribution rate of natural subsystems to scores was the highest, significantly higher than that of economic and social subsystems. Before 2015, the average contribution rate was 46.27%, and in 2014, the contribution rate was the highest, reaching 55.71%. Analyzing the reasons, it is mainly due to the fragility of Fushun City before the transformation, which is mainly affected by the natural ecological environment, and the urban ecological pressure is relatively high. During this period, Fushun City as a whole exhibited the typical characteristics of a coal-resource-based city before the transformation.
- (2)
During the period from 2016 to 2019, the level of urban vulnerability remained fluctuating and stable, and the contribution rate of economic vulnerability to urban comprehensive vulnerability began to increase, with the most significant reduction in natural ecological vulnerability. The proportion of economic vulnerability and social vulnerability in urban comprehensive vulnerability shows an upward trend, rising from the lowest of 19.82% and 24.46% to the highest of 41.48% and 38.04%, respectively (Figure 6). The main reason is that the transformation of building a consumer-oriented city, initiated by Fushun City in 2014, after several years of government support and market mechanism improvement, has begun to show results. At this stage, the overall economy of Fushun has also experienced certain fluctuations, and the urban vulnerability of Fushun City has shifted from natural ecological dominant vulnerability to economic and social dominant vulnerability.
- (3)
By 2020, the overall vulnerability of Fushun City had reached its lowest level, with a slight increase since 2020. This is mainly due to the overall economic downturn caused by the COVID-19 pandemic, which has affected the overall urban development of Fushun City. However, the overall operation of the human-land system in the research area has gradually been coordinated, and the comprehensive reduction of natural and social vulnerability has compensated for the negative impact caused by the depletion of coal resources.
4.4.3. Analysis of the Results from the Factor Layer
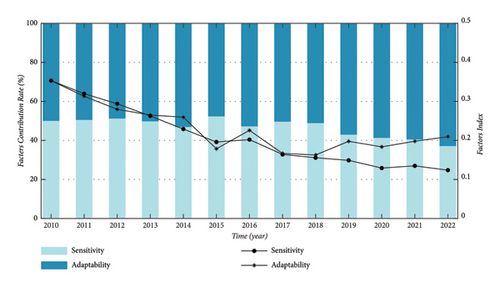
During the period from 2010 to 2022, the sensitivity index and adaptability index of Fushun showed a downward trend, but there were also differences in the contribution to the decline of the vulnerability index. The sensitivity index decreased the fastest at −8.140%, with a score decrease of 0.23, or 65.2%, indicating a significant reduction in the adverse impact of the sensitivity index on Fushun, with a contribution rate of 61.66% to the reduction in vulnerability. It is the leading factor leading to the reduction in the vulnerability index. The adaptability index also decreased by 40.8%, contributing 38.34% to the reduction of vulnerability. During the study period, the coefficient of variation of the decline rate of adaptability factors was −5.876 (Table 4), which was not only significantly higher than the overall vulnerability but also significantly higher than the sensitivity factor, with the largest dispersion of changes.
| Sensibility | Adaptability | Vulnerability | |
|---|---|---|---|
| Average speed | −8.140 | −2.878 | −5.419 |
| Standard deviation | 6.853 | 16.914 | 11.502 |
| Coefficient of variation | −0.842 | −5.876 | −2.122 |
Figure 7 shows that the scores of both sensitivity and adaptability factors have decreased. Although sensitivity factors have increased at two time points, their overall trend of change is most similar to the vulnerability index, with a correlation coefficient of 0.98. The adaptability index has generally decreased; however, there has been a significant fluctuation compared to the overall vulnerability from 2014 to 2019 and a significant increase after 2020, indicating that the adaptability of cities has decreased during the COVID-19 epidemic period, which has a significant impact on the overall vulnerability of cities.
From 2010 to 2015, there was no significant difference in the proportion of contribution between the sensitivity index and adaptability index scores in Fushun. The reduction of urban vulnerability in Fushun before and after transformation was attributed to the joint contribution of the two factors. In terms of reducing vulnerability, the city mainly relied on reducing its sensitivity to the external natural ecological environment and strengthening its own adaptability at the same time.
After 2016, the level of urban vulnerability in Fushun maintained a certain level of fluctuation and stability. During this stage, the contribution rate of adaptability to urban comprehensive vulnerability began to increase. From 2010 to 2022, the proportion of urban adaptability in urban comprehensive vulnerability has increased from 49% to 62.87%, an increase of 13.87 percentage points (Figure 9). The urban vulnerability of Fushun is transitioning towards an internal adaptability-dominated vulnerability. After the transformation, Fushun needs to rely more on improving its internal conditions for reducing urban vulnerability.
5. Conclusions and Recommendations
5.1. Conclusions
- (1)
Taking Fushun as a sample, the dynamic evolution model of urban vulnerability has been constructed to predict and simulate the state of urban vulnerability. The research results indicate that the comprehensive vulnerability index of Fushun has shown a trend of decline year by year from 2010 to 2022, indicating that Fushun has transitioned from Medium Alarm Level IV to Relatively Safe Level II. The vulnerability development trend of the human-land system in the study area is good, and the vulnerability index has already left the alert state. The vulnerability development of Fushun has generally gone through three stages of development: the first stage (2010–2015) is a rapid decline stage; the second stage (2016–2019) is the fluctuation decline stage; and the third stage (2020–2022) is a slight rebound stage.
- (2)
Through a system dynamics model, the causal relationship between various elements within the subsystems of urban vulnerability was analyzed, and it was believed that this was the result of the combined effects of sensitivity and adaptability factors in the urban system. During the period from 2010 to 2022, the vulnerability index of various subsystems in Fushun City showed a downward trend, but there were differences in the degree of vulnerability contribution of each subsystem. In the first stage (2010–2014), the natural subsystem had the highest contribution rate and was significantly higher than the economic and social subsystems. During this period, Fushun City as a whole had the typical characteristics of a coal-resource-based city before the transformation. In the second stage (2016–2019), the level of urban vulnerability maintained a certain level of fluctuation and stability, and the proportion of economic and social vulnerability in the overall urban vulnerability showed an upward trend. Fushun’s urban vulnerability shifted towards an economic and socially dominant vulnerability. From 2010 to 2019, the reduction in urban natural vulnerability was the most significant. In the third stage (2020–2022), due to the impact of the epidemic on the overall economy of Fushun City, the overall vulnerability of Fushun City has slightly increased since 2020, but the natural and social vulnerabilities have been comprehensively reduced, making up for the negative impact caused by the economic decline. The internal operation of Fushun’s human environment coupling system has been gradually coordinated; the system structure has been optimized; and the overall adaptability of the urban system has been improved.
5.2. Recommendations
- (1)
In the early stage of transformation, Fushun City underwent significant improvements in its ecological environment and infrastructure, resulting in a significant improvement in its overall vulnerability. Fushun City needs to continuously improve the ecological and living environment, increase ecological governance and land reclamation in mining areas, optimize the investment environment, use systems as guarantees, strengthen environmental supervision, increase punishment for behaviors that damage the ecological environment, and strictly control the emissions of industrial sulfur dioxide, industrial exhaust gas, and industrial smoke and dust. Maoming City and Fushun City are both resource-depleted cities [47]. Maoming City has achieved a relatively successful economic transformation and can serve as a benchmark city for Fushun City’s transformation. The experience of open-pit mine management and urban transformation and development in Maoming City can be used as a reference for Fushun City.
- (2)
The current urban vulnerability in Fushun City is shifting from a natural ecologically dominant vulnerability to an economic and socially dominant vulnerability. Fushun City launched the transformation work of building a consumer-oriented city in 2014, and after several years of government support and market mechanism improvement, it has shown effectiveness. Fushun City needs to adhere to the adjustment of the industrial structure in the economy, attach importance to the development of a circular economy and a service economy, and increase local fiscal revenue and per capita GDP. We need to fully utilize the preferential policies and transfer payment funds of the country for the transformation of resource-depleted cities, deepen the reform of state-owned enterprises, strengthen the coordinated development of related industries in Fushun City and neighboring Shenyang City, and expand the space for industrial transformation in Fushun City.
- (3)
Compared with Fushun City, Maoming City, which has successfully transformed, has significant advantages in terms of the proportion of education expenditure, the number of students per 10,000 people, urban maintenance and construction expenditure, the number of doctors per 10,000 people, and the proportion of people under 17 and over 60 years old [48]. The problem of population loss is the top priority in Fushun City. Industrial transformation should be used to solve social employment problems, with a focus on increasing the per capita GDP and savings of urban and rural residents, driving population retention, and promoting population structure optimization and adjustment. Infrastructure and higher education construction were continuously strengthened, and investment in medical and social security development funds was increased.
Conflicts of Interest
The authors declare that they have no conflicts of interest.
Acknowledgments
This work was supported by the key project of the Ministry of Science and Technology of the People’s Republic of China (no. 2017YFC1503102), Liaoning Provincial Education Department Social Science Project (no. LJKR0141), and Liaoning Technical University (no. 55230010A032).
Open Research
Data Availability
The data used to support the findings of this study are available from the corresponding author upon request.


