Towards Robust Evaluation of Aesthetic and Photographic Quality Metrics: Insights from a Comprehensive Dataset
Abstract
In recent years, the development of metrics to evaluate image aesthetics and photographic quality has proliferated. However, validating these metrics presents challenges due to the inherently subjective nature of aesthetics and photographic quality, which can be influenced by cultural contexts and individual preferences that evolve over time. This article presents a novel validation methodology utilizing a dataset assessed by individuals from two distinct nationalities: the United States and Spain. Evaluation criteria include photographic quality and aesthetic value, with the dataset comprising images previously rated on the DPChallenge photographic portal. We analyze the correlation between these values and provide the dataset for future research endeavors. Our investigation encompasses several metrics, including BRISQUE for assessing photographic quality, NIMA aesthetic and NIMA technical for evaluating both aesthetic and technical aspects, Diffusion Aesthetics (employed in Stable Diffusion), and PhotoILike for gauging the commercial appeal of real estate images. Our findings reveal a significant correlation between the Diffusion Aesthetics metric and aesthetic measures, as well as with the NIMA aesthetics metric, suggesting them as good potential candidates to capture aesthetic value.
1. Introduction
The pervasive trend towards digitization, coupled with the increasing reliance on image-based decision-making platforms like Tinder [1, 2], underscores the growing importance of intelligent systems capable of making aesthetic or commercial judgments based on photographs. This is particularly pertinent in the digitization of artistic works, such as architectural structures or sculptures, where capturing their aesthetic qualities through images for online dissemination is indispensable. In such scenarios, the use of artificial intelligence (AI) techniques to identify the most aesthetically valuable viewpoints of 3D objects becomes crucial.
While artists are traditionally regarded as possessing an innate aesthetic sensibility, driving their ability to make aesthetic judgments about their creations, there is a burgeoning field of AI research dedicated to emulating this aesthetic judgment [3]. With the emergence of sophisticated image generation models like DALL ⋅ E [4] and Stable Diffusion [5], there is a pressing need to advance systems capable of predicting the aesthetic preferences of groups or individuals.
Aesthetic preferences extend beyond human artists to encompass preferences that influence daily decision-making for everyone. Notably, AI’s commercial applications in aesthetics are gaining traction, exemplified by systems as PhotoILike, which automatically sequence real estate advertisement images using AI techniques and specialized datasets [6].
Since the inception of complexity-based aesthetic judgment systems by Machado and colleagues [7], there have been numerous attempts to develop automatic mechanisms for generating aesthetic preferences aligned with human aesthetic trends. Early efforts were grounded in traditional aesthetic theories, followed by systems incorporating ad-hoc metrics with regression or classification mechanisms. Recent endeavors leverage deep learning techniques, either directly or as a foundation for other learning systems, as discussed in state of the art.
Validating aesthetic prediction systems poses challenges due to their subjective psychological nature, leading to potential cultural biases. Consequently, a system designed within a particular cultural context may not be transferable to a different one.
This article proposes a novel approach using a dataset where identical images are assessed by individuals from two different countries (Spain and the USA) using diverse evaluation methods (online and face-to-face) and criteria (aesthetics and photographic quality). This dataset facilitates the determination of whether a metric correlates more closely with photographic quality (more objective) or aesthetic value (more subjective) and allows for an initial performance assessment across cultural contexts. Sourced from a photography portal where images have been evaluated, this dataset offers valuable additional data. We present this dataset, including detailed evaluations from USA participants, and analyze correlations between different evaluations.
We investigate five computational metrics (BRISQUE, NIMA aesthetic, NIMA technical, PhotoILike, and Stable Diffusion Aesthetics) in two ways: first, by examining their correlation with different values from the reference dataset, and second, by analyzing positively and negatively rated images by each metric, enabling a visual trend analysis of the dataset.
The article is organized as follows: The next section provides a concise review of studies proposing or analyzing computational aesthetics or photographic quality metrics. Metrics introduces the metrics analyzed in this study, while Proposed Dataset details the validation method and the proposed dataset, including an analysis of correlations between different image metrics. Analysis of Metric Performance presents the findings, followed by a discussion of the conclusions and future directions of this research.
2. State of the Art
The quantification of image quality and aesthetics has long been a focal point in image processing and computer vision research. Technical quality assessment primarily concerns the measurement of low-level degradation, including image noise, blur, compression, among others, while aesthetic assessment delves into the more subjective characteristics associated with emotions and beauty perceived by observers [8–11].
In terms of aesthetics and photographic quality evaluation, one of the pioneering endeavors was undertaken by Datta et al., who created one of the first aesthetics datasets based on images from the Photo.net photo portal [8]. Notably, this portal facilitated separate evaluations for originality and aesthetic value. Intriguingly, the researchers discovered a remarkably high correlation between these two aspects, indicating that users of the website often assessed images based on a combined factor. The dataset was specifically crafted to validate binary classifiers capable of distinguishing between low- (rating < 4.2) and high- (rating > 5.8) quality images. Subsequently, Data et al. proposed an expanded dataset with similar characteristics, further contributing to the advancement of research in this domain [12].
Similarly, Ke et al. created a dataset based on the DPChallenge photo website, known for hosting thematic photography contests [10]. However, this dataset’s evaluation metric remains undefined, making it challenging to ascertain its exact link to aesthetics or photographic quality.
Building upon these datasets, subsequent works have employed various approaches, including binary classification [13–15] and prediction of aesthetic values [16, 17] or related factors such as visual complexity [18]. Recent advancements have seen the adoption of complex models, such as deep convolutional neural networks (CNNs), to address the subjectivity inherent in aesthetic taste [3, 19–27].
As the field continues to advance with the development of increasingly sophisticated aesthetic prediction systems, the need for robust validation methodologies becomes paramount. It is crucial to determine whether a given metric correlates more strongly with aesthetic value or other subjective factors such as photographic quality, perceived image quality, visual complexity, or commercial appeal. Hence, we propose the creation of a dataset explicitly designed for this purpose.
3. Metrics
This section provides an in-depth analysis of five metrics, each serving distinct purposes. Among these metrics, two (Diffusion Aesthetics and NIMA Aesthetics) focus on aesthetic evaluation, while two others (NIMA Technical and BRISQUE) are geared towards assessing photographic image quality. Additionally, one metric (PhotoILike) is tailored to evaluate the commercial attractiveness of real-estate images.
Following this expression, the new range for scores implies that 1 indicates the worst quality, while 10 indicates the best, making the metric comparable.
The Neural Image Assessment (NIMA), proposed by Talebi and Milanfar [27], is a reference-free IQA tool based on a CNN. Our study utilizes two variants of NIMA: NIMA Aesthetic and NIMA Technical. These models predict the rating distribution for each image, assigning scores on a Likert scale from 1 to 10, where 1 denotes the lowest and 10 the highest quality.
The NIMA models utilized in this study are MobileNet variants extracted from the work of Lennan et al. [30]. These models underwent transfer learning, where ImageNet pretrained CNNs were adapted and optimized for the regression task. NIMA Aesthetic was trained on the AVA dataset, consisting of 255,000 images rated by at least 200 amateur photographers across multiple photography contests, to evaluate image aesthetics and emotional response. Meanwhile, NIMA Technical was trained on the TID2013 dataset, which comprises 3,000 images rated by observers for perceptual image quality, assessing image technical quality. Further information on the datasets and model architectures can be found in the original work by Talebi and Milanfar [27].
The LAION-Aesthetics predictor v2 (Stable aesthetics) is an estimator that leverages CLIP (Contrastive Language–Image Pretraining) to predict the aesthetic quality of images. This model estimates aesthetics based on CLIP image embeddings extracted from the original image. Its training dataset comprises various sources, including the Simulacra Aesthetic Captions (SAC) dataset with over 176,000 synthetic images generated using AI models such as CompVis latent GLIDE and Stable Diffusion. Additionally, it incorporates LAION-Logos, a dataset of 15,000 logo image-text pairs with aesthetic ratings, and the Aesthetic Visual Analysis (AVA) dataset [31], containing 250,000 photos from DPChallenge.com. This estimator was utilized to rank images in LAION-5B [32], and it serves as a filter in Stable Diffusion, accepting only images scoring >0.5 points to ensure a certain aesthetic quality in the results.
PhotoILike (PhIL) [33] is an IQA service designed for evaluating real estate photographs based on commercial appeal [34]. This AI-powered service conducts large-scale studies on real estate images through crowd-sourced surveys. Each image receives a score from 1 to 10, where 1 indicates the lowest commercial attractiveness and 10 the highest. The scoring considers not only the image’s aesthetics but also various other characteristics crucial for real estate marketing. For instance, images featuring amenities like swimming pools typically receive higher scores than images showcasing bathrooms.
4. Proposed Dataset
As highlighted earlier, human assessments of qualities such as aesthetics, visual complexity, and commercial appeal inherently involve subjectivity [35]. Unlike image recognition, where algorithms provide consistent results, individuals may assign varying scores to an image based on diverse factors such as cultural background, social context, and personal experience.
This section delves into the proposed dataset, building upon a previously published dataset [36]. The earlier work defined original images and conducted evaluations with students pursuing degrees in Audiovisual Communication at a Spanish university. However, the evaluation’s homogeneity among participants raises concerns about the presence of a significant bias, difficulting its generalizability.
The dataset comprises 130,000 images obtained from DPChallenge through brute force. DPChallenge scores range from 1 to 10 and have been widely utilized in previous studies for aesthetic assessments [10, 37, 38]. However, statistical information was available for only 44,047 images (the subset of the dataset taken in consideration for this study). Images were evaluated by an average of 233 subjects, with a mean rating of 5.23 ± 0.78 [36].
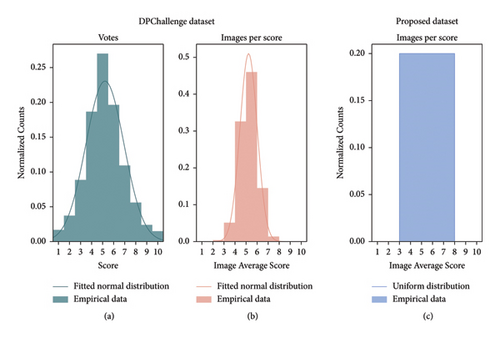
The initial subset publicly available online, including the URLs of the images together with the number of votes per score [39]. For this dataset, a simple characterization is shown in Figure 1. Panel (a) shows the normalized histogram of votes, while panel (b) depicts the normalized histogram of images as a function of their average score. Similarly to other studies [17, 40], the empirical distribution on panel (b) follows a normal distribution such that . Further descriptive statistical data for panel (b) can be seen in Table 1.
| Images | 44.047 |
| Average | 5.2305 |
| Deviation | 0.7821 |
| Variance | 0.6117 |
| Kurtosis | 0.2480 |
| Bias | −0.0182 |
| Minimum | 1.9951 |
| Maximum | 8.3900 |
To have a representative sample, we need to include images in our dataset both with enough evaluations and spanning the whole range of scores. To do so, images with more than 100 evaluations were then organized into subsets according to their average score. Sets were defined by discretizing the score range using natural numbers as edges. We defined a minimum number of images (200) that each subset had to gather to consider the subset in the study. Only the five groups belonging to the average score range [3, 8] could then be considered. For each of the selected sets the 200 images with the lowest standard deviation were selected, ensuring internal rating consistency. Following this insight, we went from a Gaussian distribution over the sets on the original dataset (Figure 1) towards a uniform distribution (see Figure 1(c)) on a 1,000 images new dataset. We made this processed dataset available online [41], including the scores resulting from applying all the metrics to the images.
5. Aesthetic and Quality Evaluations in Spain
The evaluation process of the proposed dataset was conducted by students enrolled in the Audiovisual Communication Degree at the Universidade da Coruña, Spain. A cohort of at least 10 students provided assessments, culminating in a total of 10,000 evaluations. These assessments were systematically carried out in a controlled environment within the Faculty of Communication Sciences’ dedicated space, ensuring uniformity in evaluation conditions. Specifically, participants utilized 19-inch monitors under consistent lighting conditions, dedicating two hours to assess a set of 200 images. Participation in this survey was voluntary, with no financial incentive offered. For the task, participants had to assign a score (1–5) for both aesthetics and quality of the images presented.
Amazon Mechanical Turk (AMT) was employed to distribute the survey. AMT, a platform by Amazon, offers both commercial and noncommercial versions, the latter of which was used for the in-place evaluation in Spain. AMT streamlines survey execution by enabling survey programming within its system. Furthermore, it manages participant data by anonymizing responses, allowing us to focus solely on data analysis rather than data handling.
Table 2 presents a summary of the statistical data gleaned from this initial evaluation conducted by the Spanish student cohort.
| Aesthetics | Quality | |
|---|---|---|
| Minimum | 1.154 | 1.231 |
| 1st quartile | 2.500 | 2.769 |
| Median | 3.083 | 3.376 |
| Mean | 3.021 | 3.244 |
| 3rd quartile | 3.538 | 3.823 |
| Maximum | 4.538 | 4.727 |
We made this processed dataset available online [41], including the scores resulting from applying all the metrics to the images.
6. Aesthetic and Quality Evaluations in USA
The Spanish study, while conducted under controlled conditions, exhibited a high degree of participant homogeneity. To address this limitation and introduce greater cultural diversity, a second study was conducted using the same images and recruiting respondents from the USA—to ensure a more heterogeneous sample—by means of the AMT commercial version.
The commercial AMT allows the online execution of surveys. It also enables the specification of criteria that participants must meet and determines the requisite number of respondents for each task. Unlike the controlled setting with Spanish students, the commercial AMT process does not guarantee that the same individuals evaluate all images; however, it ensures that each image receives a consistent number of evaluations.
We employed the commercial version of the AMT tool and recruited respondents from the USA to ensure a more heterogeneous sample.
Table 3 summarizes the US participant demographics compared to the previous Spanish dataset [36]. Each image received 30 unique evaluations, though not necessarily from the entire participant pool. A total of 878 people participated (41.1% men and 58.9% women) with a mean age of 33.5 and an age range of 18 to 79 years. The age distribution was as follows: 68.6% under 33, 20.3% between 33 and 47, 9.5% between 48 and 62, and 1.7% over 63.
| USA | Spain | |
|---|---|---|
| Total participants | 878 | 240 |
| Men | 361 | 112 |
| Women | 517 | 128 |
| Mean age | 33,5 | 22.03 |
- (i)
Aesthetics-Related Background: 565 individuals possessed studies or experience in fields related to aesthetics (e.g., architecture and design), while the remaining 313 had no related experience.
- (ii)
Mean Monthly Salary: $1905.
- (iii)
Environment: 20.7% lived in a rural environment, 23.1% in a semiurban environment, and 56.2% lived in an urban area.
- (iv)
Museum Attendance: 47.8% always, 31.3% frequently, and 20.7% never.
- (v)
Art Purchasing: 36.8% never, 37.4% frequently, and 25.7% always.
- (vi)
Photography Blogs: 492 people follow photography blogs.
- (vii)
Photography Magazines: 472 people follow photography magazines.
- (viii)
Photography Practice: 52.8% frequently take photos, 27.4% always, and 19.7% never.
- (ix)
Photography Manual Adjustment: 31.9% of them were manually modifying parameters for taking photographs.
- (x)
Photography Social Networks: 481 people are active in photography social networks and 397 do not.
The US study incorporated a considerably more diverse participant pool, encompassing a broader range of ages, socioeconomic backgrounds, and experience related to aesthetics.
- (1)
Nationality: Participants were drawn from the USA and Spain, introducing distinct cultural perspectives.
- (2)
Participant background: The US dataset includes individuals with diverse ages, social status, and academic levels. In contrast, the Spanish dataset consists of Audiovisual Communication students with similar ages and a degree of aesthetic knowledge.
- (3)
Evaluation conditions: The Spanish study was conducted in a controlled setting with identical devices and researcher supervision. The US study employed an online survey with less control over viewing devices and no direct supervision.
Table 4 provides a statistical analysis of the study carried in USA.
| Aesthetics | Quality | |
|---|---|---|
| Minimum | 2.680 | 2.700 |
| 1st quartile | 5.360 | 6.140 |
| Median | 6.480 | 7.220 |
| Mean | 6.348 | 6.979 |
| 3rd quartile | 7.380 | 8.060 |
| Maximum | 9.100 | 9.280 |
6.1. Correlation of Human Evaluations
Upon completing the evaluations from both the United States and Spain, we calculated the Pearson correlation coefficient (hereafter referred to as “correlation”) among various evaluation metrics: DPChallenge (D), Spanish Aesthetics (SA), Spanish Photographic Quality (SQ), USA Aesthetics (UA), and USA Photographic Quality (UQ). The correlations are detailed in Table 5 and visually represented in Figure 2, showcasing scatter plots for pairs of evaluation variables alongside Kernel Density Estimation for individual variables’ distributions.
| D | SA | SQ | UA | UQ | |
|---|---|---|---|---|---|
| D | — | 0.691 | 0.748 | 0.751 | 0.777 |
| SA | 0.691 | — | 0.787 | 0.789 | 0.725 |
| SQ | 0.748 | 0.787 | — | 0.738 | 0.863 |
| UA | 0.751 | 0.789 | 0.738 | — | 0.899 |
| UQ | 0.777 | 0.725 | 0.863 | 0.899 | — |
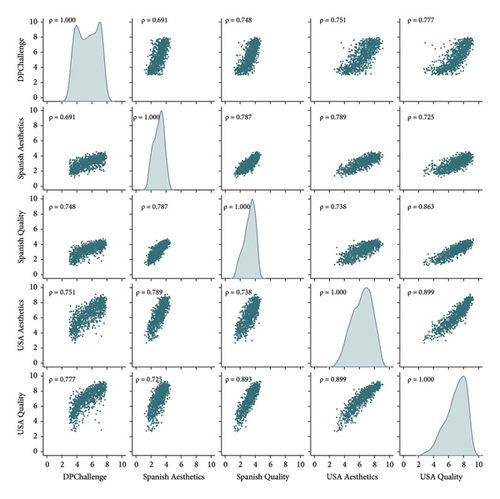
Analysis of these correlations yields several insights. Notably, the DPChallenge scores exhibit stronger correlation with photographic quality than with aesthetic value across both studies, raising questions about the direct application of DPChallenge scores in aesthetic evaluations.
A higher correlation is observed with the US evaluations compared to the Spanish ones for DPChallenge scores, possibly reflecting the US’s greater DPChallenge user base or the diverse demographics of the study participants.
The correlation between aesthetics and quality in Spain is remarkably lower than in the US, suggesting a more pronounced difficulty in differentiating between aesthetics and quality among US participants. This may be attributed to the Spanish participants’ higher artistic acumen, being students in a visually-oriented discipline.
Furthermore, the cross-study comparison reveals a stronger consensus on photographic quality (0.863) than on aesthetic value (0.751), indicating a universal tendency to agree more on technical aspects than on aesthetic judgments.
Interestingly, within-study correlations reveal that aesthetic values between the US and Spanish studies align more closely with each other than their quality assessments. Conversely, the Spanish study’s aesthetic values exhibit a closer correlation with the US study’s photographic quality than with its own aesthetic assessments, highlighting nuanced perceptual differences between the groups.
7. Analysis of Highest and Lowest Rated Images across Studies
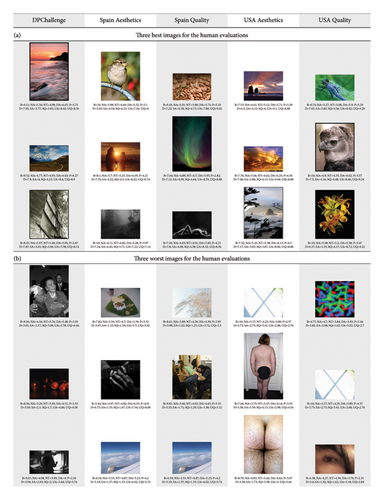
Figure 3 showcases the images receiving the highest and lowest scores within each study.
- (1)
Commonality among the lowest-rated images is observed across the studies. Specifically, there are two instances where the same images are identified as the lowest-rated in terms of both aesthetics and quality, with one instance in the Spanish evaluations and another in the US evaluations.
- (2)
Landscapes, along with flora and fauna imagery, predominantly feature among the highest-rated images. This preference suggests a universal appreciation for natural elements and scenes within the context of the studies.
- (3)
There exists a discrepancy between the highest and lowest rated images according to DPChallenge scores and those determined through our studies. This divergence indicates that the criteria applied within the DPChallenge community may not align with the assessment criteria used in our structured evaluations.
These observations provide valuable insights into aesthetic preferences and the evaluation of photographic quality, underscoring the importance of context in the assessment of visual materials. They also highlight the potential for divergence between community-based ratings and structured academic evaluations, suggesting the need for careful consideration when utilizing public domain scores for research purposes.
8. Analysis of Metric Performance
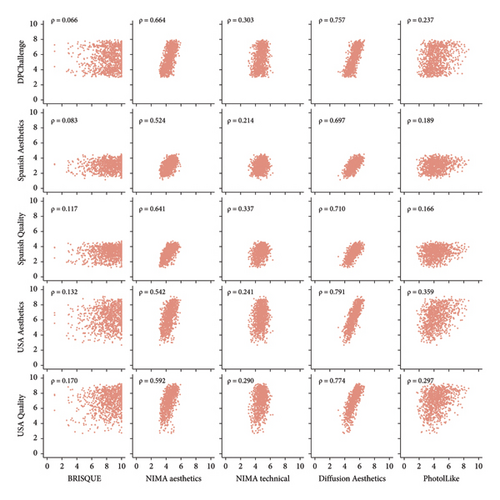
The dataset of 1,000 images from the DPChallenge was assessed using five metrics: BRISQUE, NIMA aesthetic, NIMA technical, Diffusion Aesthetics, and PhotoILike. The correlations between these metrics and both quality and aesthetic evaluations in the dataset are detailed in Figure 4 and Table 6.
| B | NA | NT | DA | P | |
|---|---|---|---|---|---|
| D | 0.066 | 0.664 | 0.303 | 0.757 | 0.237 |
| SA | 0.083 | 0.524 | 0.214 | 0.697 | 0.189 |
| SQ | 0.117 | 0.641 | 0.337 | 0.710 | 0.166 |
| UA | 0.132 | 0.542 | 0.241 | 0.791 | 0.359 |
| UQ | 0.169 | 0.592 | 0.290 | 0.770 | 0.297 |
- BRISQUE (B), NIMA-aesthetic (NA), NIMA-technical (NT), LAION Diffusion Aesthetics (DA), and PhotoILike (P), DPChallenge (D), Spanish aesthetics (SA), Spanish photographic quality (SQ), USA aesthetics (UA), and USA photographic quality (UQ).
Diffusion Aesthetics exhibits the strongest correlations across the board, notably 0.757 with DPChallenge, 0.770 with the USA photographic quality, and 0.791 with the USA aesthetics evaluations. Its significant correlation with DPChallenge is anticipated due to the inclusion of DPChallenge images in its training dataset (through the ADA dataset). Nevertheless, its highest correlation with the USA Aesthetics evaluation underscores its potential for aesthetic assessment, consistently showing stronger correlations with aesthetics over photographic quality metrics.
PhotoILike, while not specifically designed for aesthetic prediction in conventional imagery, demonstrates correlations ranging from 0.189 to 0.359. It exhibits a greater affinity with aesthetic evaluations (0.359 for USA Aesthetics) than with quality assessments, suggesting its nuanced applicability beyond its intended real estate focus.
Conversely, BRISQUE shows relatively low correlations, peaking at 0.169 with the USA photographic quality assessment. It generally aligns more closely with quality metrics, reflecting its design focus on technical image analysis rather than aesthetic judgment.
NIMA technical aligns more with quality assessments, mirroring BRISQUE’s trend, and its highest correlation occurs against Spanish photographic quality. NIMA aesthetic, however, achieves higher correlations similar to Diffusion Aesthetics but still leans towards quality over aesthetics, challenging its presumed focus on aesthetics. NIMA aesthetics highest correlation happens with DPChallenge.
The international comparisons reveal that the USA evaluations correlate more strongly than those from the Spanish cohort, possibly hinting at cultural influences or the diverse composition of the participant group.
The initial study of this dataset [42] used six different regression techniques to predict metrics’ evaluations: Support Vector Machines Recursive Feature Elimination (SVM-RFE), Generalized Linear Model (GLM) with Stepwise Feature Selection, k-Nearest Neighbors (k-NN), and Generalized Boosted Models (GBM) trained on the same dataset. The highest performance (understood as correlation on the test set) was achieved using SVM-RFE, with values of 0.578 for DPChallenge, 0.456 for aesthetics, and 0.539 for photographic quality. The values obtained in the present study derive from metrics using DPChallenge images in their training dataset, leading to much higher correlations in test evaluations.
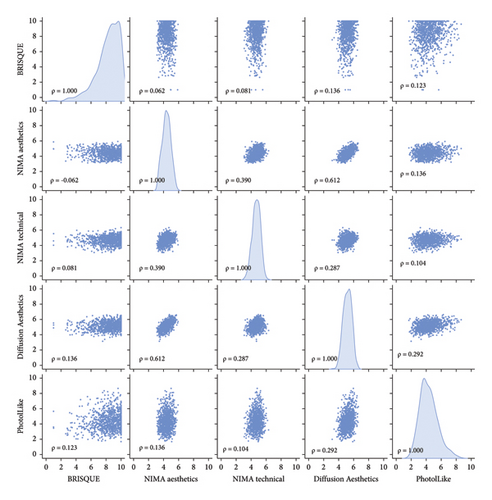
The analysis of intermetric correlations, as depicted in Figure 5 and summarized in Table 7, uncovers significant relationships between the computational metrics evaluated in this study. Notably, Diffusion Aesthetics and NIMA aesthetic metrics exhibit the highest correlation, with a coefficient of 0.612. This strong correlation is likely attributable to the use of the AVA dataset in their respective training processes, suggesting that shared training resources can lead to metrics that assess aesthetic qualities in similar ways.
| B | NA | NT | DA | P | |
|---|---|---|---|---|---|
| B | −0.062 | 0.081 | 0.136 | 0.123 | |
| NA | −0.062 | 0.390 | 0.612 | 0.136 | |
| NT | 0.081 | 0.390 | 0.287 | 0.104 | |
| DA | 0.136 | 0.612 | 0.287 | 0.292 | |
| P | 0.123 | 0.136 | 0.104 | 0.292 |
- BRISQUE (B), NIMA-aesthetic (NA), NIMA-technical (NT), LAION Diffusion Aesthetics (DA), and PhotoILike (P).
NIMA aesthetic further demonstrates a substantial correlation (0.39) with NIMA technical, indicating that aesthetic and technical assessments, while distinct, share a degree of commonality in their evaluative criteria. Additionally, Diffusion Aesthetics shows moderate correlations with both PhotoILike (0.291) and NIMA technical (0.286), suggesting its broader applicability in assessing both aesthetic appeal and technical quality.
Conversely, the BRISQUE metric, designed primarily for technical quality assessment, exhibits low correlation with the aesthetic-focused metrics. This underscores the metric’s focus on technical aspects of image quality rather than aesthetic appeal.
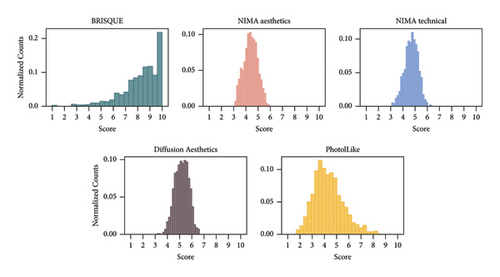
Figure 6 illustrates the distribution of metric scores, providing insight into the variability and range of each metric. Data summarized in Table 8 gathers statistical descriptors of such distributions. BRISQUE and PhotoILike display wider scoring ranges. In contrast, NIMA technical and Diffusion Aesthetics metrics are characterized by a narrower range of less than 4 points. Remarkably, the highest scoring image according to the Diffusion Aesthetics metric achieves a value of 6.63, emphasizing the metric’s sensitivity to high-quality aesthetics. Such sensitivity emerges from the fact of being trained with images with a very high and very low rating on DPChallenge photo portal.
| BRISQUE | NIMA aesthetics | NIMA technical | Diffusion aesthetics | PhotoILike | |
|---|---|---|---|---|---|
| Min. | 1 | 3.091413 | 3.078766 | 3.140555 | 1.691002 |
| Max. | 10 | 5.928813 | 6.33433 | 6.63024 | 8.65518 |
| Mean | 8.25933 | 4.395189 | 4.694919 | 5.17725 | 4.343795 |
| Median | 8.575151 | 4.393596 | 4.721652 | 5.192661 | 4.20731 |
| Std | 1.567008 | 0.5596168 | 0.5427929 | 0.5656328 | 1.196419 |
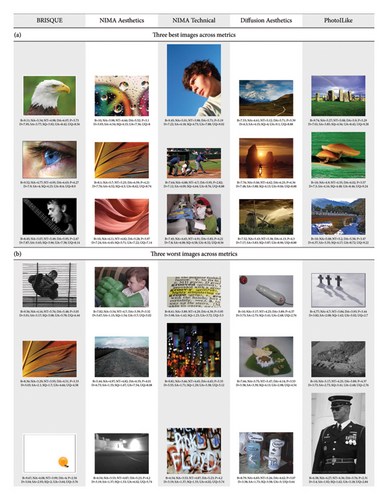
In the delineation of computational metrics’ performance, Figure 7 elucidates the distinctive preferences inherent to each metric by showcasing the three highest and three lowest scored images. This visual comparison, juxtaposed with quantitative evaluations from both dataset studies, unveils the nuanced criteria applied by different metrics in assessing image aesthetics and quality.
- (i)
NIMA Technical gravitates towards images that showcase realism with minimal digital manipulation for its top-rated selections. In contrast, its lower-rated images often feature heavy processing or emphasize specific details, such as vibrant colors or textual elements.
- (ii)
NIMA Aesthetic and ∗∗Diffusion Aesthetics∗∗ metrics display a preference for high-quality, aesthetically pleasing images. The lowest-rated images under these metrics typically appear more amateurish, with less processing and lower overall photographic quality. Conversely, the top-rated images are characterized by their superior aesthetic and photographic quality. Notably, Diffusion Aesthetics, similar to PhotoILike, favors landscape images for its highest scores. NIMA Aesthetic leans towards abstract compositions and textures for its top selections.
- (iii)
PhotoILike’s lower-rated images predominantly include black and white photographs. This trend likely stems from the scarcity of black and white images in its real-estate focused training dataset, indicating a bias towards color images.
- (iv)
The analysis provides limited insights into BRISQUE’s evaluative tendencies.
9. Discussion
This study developed a comprehensive methodology for validating metrics related to aesthetics and image quality. Additionally, it explored the underlying aesthetic preferences encoded within these metrics, identifying the types of images that are most and least valued. The methodology was applied to two aesthetic metrics (NIMA Aesthetics and Diffusion Aesthetics), two quality metrics (BRISQUE and NIMA Technical), and a commercial appeal metric for real estate images (PhotoILike).
A dataset comprising 1,000 images sourced from the DPChallenge photographic portal was curated and made publicly available [41]. Evaluated by participants from two distinct countries, this dataset serves as a reference for validating computational metrics, facilitating an analysis of the correlation between these metrics and the images rated highly or poorly by each metric.
Among the findings, the Diffusion Aesthetics metric exhibited the highest correlation with human evaluations, particularly with aesthetic values rather than quality, achieving its most significant correlation (0.791) with the aesthetic evaluations from the USA study. The NIMA Aesthetics metric also showed high correlation values with evaluations, though it tended more towards photographic quality than pure aesthetics. NIMA Technical presents lower correlations with human evaluations, being more aligned with photographic quality than aesthetics. As expected, PhotoILike shows lower correlations with human evaluations, given its focus on a real-estate commercial appeal. BRISQUE correlations, however, were not considered significant to be taken into account. Notably, all metrics demonstrated higher correlations with the USA study than with the Spanish study, suggesting cultural or methodological influences on the evaluation process.
These correlations exceed those found in prior research [42], indicating that extensive training datasets can significantly enhance the efficiency of regression methods. The study also revealed that evaluations from the DPChallenge (widely used in several scientific papers [17, 43–46] and datasets, such as the AVA [31] or IDEA [47]) are more aligned with photographic quality than with aesthetic value, a finding that extends to the NIMA Aesthetics metric, which was trained on the AVA dataset.
Analysis of the highest and lowest valued images within the dataset further elucidates the preferences of each metric. For example, the highest-rated images according to the Diffusion Aesthetics metric—which showed the strongest correlation—were highly rated by humans in both aesthetic value and photographic quality, often depicting landscapes. This preference was similarly observed in the NIMA Aesthetics metric, while NIMA Technical favored more natural, untreated images. The PhotoILike metric favored images with high photographic quality and aesthetic appeal in its high-value set, and predominantly black-and-white images in its low-value set—a likely artifact of its training dataset’s composition.
The metrics have been trained on specific datasets and do not necessarily need to perfectly generalize, particularly for NIMA Aesthetics, Diffusion Aesthetics, and PhotoILike, as they measure a concept of aesthetics that may not conform to a universal average (assuming such an average can even be defined). This limitation should not affect NIMA Technical and BRISQUE as significantly, since they are oriented towards quality, which is often defined in objective terms such as resolution, luminance, and other measurable attributes. Although we acknowledge that some metrics are sensitive to cultural values, we believe that this study points future research in the right direction.
Amazon Mechanical Turk (AMT) offers significant advantages for this study by enabling the extension of surveys online without geographical limitations. However, it is crucial to recognize that AMT samples may not fully represent the entire population of each country, potentially introducing a bias towards the lower economic subset (considering that surveys are economically rewarded). This means we are capturing the aesthetic preferences of this specific group, which might differ from the broader population. Despite this, AMT ensures high response quality by rewarding honesty and severely penalizing dishonesty. Overall, we believe the benefits of using AMT far outweigh its limitations.
Another primary limitation of this study is its focus on two specific countries, each with its own cultural biases. Biological aspects of aesthetics have been investigated in neuroscience, revealing that aesthetic experiences emerge from the interaction between sensory-motor, emotion-valuation, and meaning-knowledge neural systems [48]. However, concepts like “knowledge,” “meaning,” “value,” and “emotions” are not absolute across cultures—in fact, art varies significantly worldwide [49]. Thus, while the biological basis of aesthetic perception is similar across humans, the specific concepts the brain uses vary with cultural background. To define worldwide general aesthetic values, future research should include more cultures, appropriately extending the present study.
Additional future research directions include employing Generative AI techniques to produce images with high aesthetic valuations, leveraging genetic programming engines as proposed in previous works [50, 51]. Additionally, the development of individual aesthetic models aims to capture personal tastes more accurately than the general models evaluated in this study, addressing such limitation.
This work lays the groundwork for further exploration into computational aesthetics, suggesting avenues for the development of more nuanced and personalized metrics in the years to come.
Conflicts of Interest
The authors declare that they have no conflicts of interest.
Authors’ Contributions
IS performed formal analysis, proposed the methodology, contributed to visualization, and wrote the original draft. MAC performed formal analysis, proposed the methodology, supervised the study, contributed to visualization, and reviewed and edited the article. JC performed formal analysis, contributed to data curation, and proposed the methodology. AT-P contributed to data curation, proposed the methodology, and reviewed and edited the article. PM supervised the study and reviewed and edited the article. JR conceptualized the study, provided funding acquisition, supervised the study, reviewed and edited the article, and performed investigation. Iria Santos and Miguel A. Casal are the co-first authors.
Acknowledgments
CITIC, as a Research Center of the Galician University System, was funded by the Department of Culture, Education and University of the Xunta de Galicia through the European Regional Development Fund (ERDF) with an 80% Operational Program ERDF Galicia 2014–2020. This work was supported by the General Directorate of Culture, Education and University Management of Xunta de Galicia (Ref. GRC2014/049) and the European Fund for Regional Development (FEDER) allocated by the European Union, the Portuguese Foundation for Science and Technology for the development of project SBIRC (Ref. PTDC/EIA–EIA/115667/2009); I.P./MCTES through national funds (PIDDAC), within the scope of CISUC R&D Unit—UIDB/00326/2020 or project code UIDP/00326/2020 and under the grant SFRH/BD/143553/2019; Xunta de Galicia (Ref. XUGA-PGIDIT-10TIC105008-PR); and the Spanish Ministry for Science and Technology (Ref. TIN2008–06562/TIN). Also, this work received funding with reference PID2020–118362RB-I00 from the State Program of R + D + i oriented to the Challenges of the Society of the Spanish Ministry of Science, Innovation, and Universities. We gratefully acknowledge the support of NVIDIA Corporation with the donation of the Titan Xp GPU used for this research.
Open Research
Data Availability
The dataset proposed for the present study can be downloaded from https://figshare.com/articles/dataset/dataset-aest-qual-completo_csv/21836589.


