Characteristics and Mechanism of Gas Production from Kitchen Waste Using Dielectric Barrier Discharge Nonthermal Plasma
Abstract
Dielectric barrier discharge (DBD) nonthermal plasma is applied for the gasification of kitchen waste. The gas production performance of kitchen waste gasification based on DBD under different reaction ambientes is studied. Density functional theory (DFT) simulations are used to investigate the gas production mechanism via glucose and aspartate. Scanning electron microscopy (SEM) and Raman spectroscopy are used to investigate the physicochemical properties of the produced carbon materials and reveal the plasma reaction mechanism. The plasma treatment of millet and soybean has good gasification effect and can inhibit tar production. N2 and CO2 ambientes are more conducive to the gasification of millet and soybean. The H2 concentration in plasma-treated millet gasification under plasma in N2 ambient can reach 4%. Glucose is finally decomposed through ring-opening reaction, decarbonylation reaction, dehydration reaction, and carbon–carbon bond breaking. And the decomposition process of aspartic acid mainly includes decarbonylation and deammonia reaction. With the increase of gas ionization energy, the surface pore structure of the carbon material after plasma treatment is more developed, which indicates that the reaction between plasma and solid is on a layer by layer basis with the solid surface facing the inner surface. This paper aims to provide valuable theoretical support for the application of DBD in the treatment of kitchen waste.
1. Introduction
Biomass energy is the energy stored in biomasses from solar power into the form of chemical energy. It has always been one of the important energy sources for human survival and is the fourth largest energy source after coal, oil, and natural gas. It occupies an important position in the entire energy system. The pyrolysis of biomass not only produces energy gases such as H2, but also results in carbon materials that may be utilized as catalyst carrier [1], battery electrode [2, 3], adsorption material [4], and so on [5]. Traditional biomass utilization methods are cantered upon biomass pyrolysis [6, 7]. Zhang et al. [8] investigated the gas production characteristics of the pyrolysis processes of five different types of biomasses, including Wong Lo Kat pharmaceutical residue, livestock and poultry waste, mushroom growing fungus sticks, sugarcane bagasse, and barks. They found that sugarcane bagasse had the best gas generation performance during the pyrolysis process. Cheng et al. [9] discovered that the addition of catalyst K2CO3 during the pyrolysis of cotton stalk can improve the pyrolysis efficiency by changing the bond breaking mode of xylose. Zhang et al. [10] claimed that iron oxide catalytic pyrolysis of red mud can further increase the energy efficiency of copyrolysis by 20%. Although the gas production capacity of biomass pyrolysis can be improved by adding alkali metals, the traditional biomass pyrolysis methods not only consume a large amount of energy, but also lead to tar production, which is substantially to the environment and human health. Therefore, whether the resulting tar can be rationally disposed has become a biggest challenge for the efficient utilization of biomass.
As a high energy state, plasma can interact with biomass tar through higher energy electrons. Saleem et al. [11] used toluene as a tar model compound and degraded it by plasma. They found that the conversion rate of toluene was as high as 99%, and the products were mainly CO and hydrocarbons. Xiao et al. [12] investigated the effect of Mn-based catalyst on tar decomposition under the action of plasma and explored the reaction mechanism. They made clear that biomass gasification by plasma could reduce tar production due to the lower reaction temperature. Even if tar was produced in the reaction, it could be directly decomposed under the action of plasma. Wang et al. [13] studied the reaction characteristics of cellulose in pyrolysis under plasma treatment, where a 26.6 mmol/g H2 yield was obtained at 550°C. In the previous study, we also explored the effect of alkali metal on the gas production characteristics of biomass in the process of plasma treatment and studied the role of alkali metal during the pyrolysis by dielectric barrier discharge (DBD) treatment [14]. The treatment of biomass pyrolysis with DBD can effectively solve the problem of the resultant tar production. To note, different types of biomasses can also lead to differences in their reaction characteristics.
At present, the most widely used methods of disposing kitchen waste include landfill technology, composting technology, and incineration technology [15, 16]. Although the cost of landfill technology is the lowest, the treatment efficiency of this method is also minimal, and it is easy to cause secondary pollution of groundwater and air. Incineration technology can deal with kitchen waste in large quantities and high efficiency, but it will produce dioxins, SO2 and NOx, which will cause serious damage to the environment [17]. Currently, few researches have been found to focus on plasma thermal hydrolysis of kitchen waste, and the interaction mechanism between plasma and kitchen waste is still unclear. DBD plasma treatment technologyis an effective measure to solve the above problems. By using it, not only will beneficial syngas and carbon materials be produced in the plasma-treated process, but also the production of toxic substances can be avoided [18, 19]. Kitchen wastes such as millet and soybeans have regular shapes and simple structures, which also give advantages to the exploration of the action of plasma and the reaction mechanism of plasma-treated process.
Millet and soybeans are used as samples of food waste, and low temperature plasma is used to help pyrolyze them. The pyrolysis law of kitchen waste under different reaction ambientes is studied. In order to further explore the principle of gas production of millet and soybeans under the action of plasma, glucose and glyceride are used as model compounds, which are treated by plasma and combined with density functional theory (DFT) simulation calculation to determine the gas production mechanism of millet and soybeans under plasma treatment. Further, Raman and SEM are used to characterize the physical and chemical properties of the produced carbon materials after pyrolysis. At the same time, the macroscopic reaction characteristics of plasma-induced biomass materials are explored. The macroscopic action rules of plasma-induced biomass materials are also analyzed according to the different properties of products under different ambientes.
2. Experimental and DFT Simulation
2.1. Experimental Method
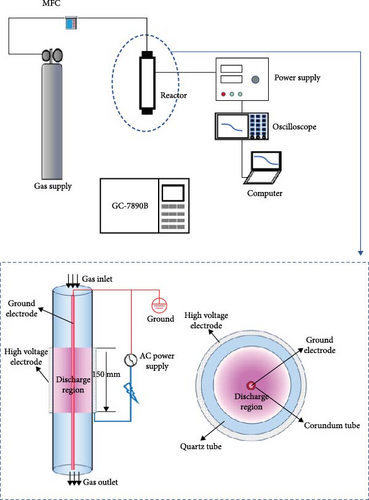
In the plasma treatment of biomass, the input voltage of 225 V and the frequency of 10.5 kHz were used. The discharge power and output voltage under different reaction conditions is shown in Table 1. About 0.2 g of the sample was placed on top of the sieve plate, which was in the middle of the quartz reactor. Before the experiment, the carrier gas, including Ar, N2, and CO2, respectively, with a flow rate of 40 ml/min was used to purge the sample for 10 min to remove air in the reactor, and then the plasma power supply was turned on. During the experiment, the plasma reactor was kept at room temperature and atmosphere pressure. Gas production from plasma treated biomass was detected using an Agilent 7890B gas chromatograph equipped with two TCD detectors as well as an FID detector. As GC does not allow for real-time analysis of gas components, the exhaust gas was first collected in a gas bag, followed by a detailed analysis of its composition. Gas samples were collected and analyzed every 5 min during the first 30 min, and subsequently every 15 min after the experiment 60 min.
| Samples | Ambient | Discharge frequency (kHz) |
Discharge power (W) |
Output voltage (kV) |
|---|---|---|---|---|
| Millet | N2 | 10.5 | 96 | 21.6 |
| Ar | 34 | 18.0 | ||
| CO2 | 95 | 20.8 | ||
| Soybeans | N2 | 99 | 22.4 | |
| Ar | 34 | 17.6 | ||
| CO2 | 96 | 21.6 | ||
| Glucose | N2 | 98 | 21.2 | |
| Ar | 37 | 18.8 | ||
| CO2 | 98 | 20 | ||
| Aspartic acid | N2 | 98 | 22.4 | |
| Ar | 36 | 17.6 | ||
| CO2 | 97 | 20.8 |
In order to further investigate the physical and chemical properties of the carbon materials after the reaction, a series of characterization methods were used. Scanning electron microscopy (SEM; ZEISS Sigma HD) was used to study the surface morphology and pore structure of the carbon materials produced after pyrolysis. Raman spectroscopy (LabRAM HR Evolution) was used to investigate the degree of graphitization and the degree of surface defects of carbon materials produced after pyrolysis. Raman spectra were used with an Ar laser, and the wave number ranging between 500 and 3,500 cm−1.
2.2. Calculation Method
DFT is a quantum mechanical modeling method used to investigate the electronic structure (principally, the ground state and transition state) of many-body systems, particularly atoms and molecules. Quantum chemistry calculations using the DFT were performed using the Gaussian 09 software. All the atoms were described by B3LYP/6-31G (d) base set [20, 21, 22], the structures of reaction products, transition states (ts), intermediates, and products were optimized. The accuracy of each optimized structure is verified by frequency calculation, and no virtual frequency is determined. The TS method was employed to calculate the transition state in the pyrolysis reaction process to make sure that the transition state had the unique imaginary frequency [23, 24, 25]. The intrinsic reaction coordinates (IRC) were used to track the reaction path of the searched transition state, which ensures the rationality of the structural connection before and after the reaction process. By comparing the energy barrier to be overcome under different reactions, the path with the minimum energy barrier is the possible path.
3. Results and Discussion
3.1. Gasification Characterization
The gas production characteristics of millet and soybeans under different ambientes were studied. At the same time, the gasification characteristics of millet and soybean model compounds (glucose and aspartic acid) under the same experimental conditions were also studied. Figure 2 shows the gas distribution of millet and soybeans treated by plasma under different ambientes. The gas distribution of millet during plasma gasification under N2, CO2, and Ar ambientes, respectively, are shown in Figures 2(a), 2(b), and 2(c). It can be found that the concentration of each gas component showed a similar trend with time. With the progress of the reaction, the gas concentration showed a reaction trend of first increasing and then decreasing. Under N2 and Ar ambient, when the experiment was carried out for about 15–20 min, the concentration of these four gases reached the peak and gradually decreased, and the largest gas production was H2, followed by CO gas. The total concentration of CO2 gas was not much different from that of CO gas, but the concentration of CH4 was always lower than that of the other three gases. Since the carrier gas ambient is CO2, the CO2 concentration is not marked in the gas production distribution in Figure 2(b). Because CO2 will decompose into CO under the action of plasma, CO content is the highest in the gas products of millet after plasma treatment under CO2 ambient [26, 27]. For the gasification under N2 and Ar ambientes, CO and CO2 gases still existed in the gasification product although there was no oxidizing gas in the reaction ambient, which was caused by the reaction between the oxygen-containing functional group existing in the structure of millet itself and the O2 adsorbed on the surface. The gas production of millet in Ar ambient was much smaller than that in N2 ambient, because the metastable state energy of the Ar is lower than that of the N2, less of the energetic metastable (or excited states) through the Ar are transferred to the sample than N2 [28, 29, 30], which on the one hand hindered the propagation of high-energy electrons, and also reduced the interaction between high-energy electrons and plasma generated after carrier ionization. It is noted that the temperature of the reactor was measured using an infrared thermometer during the reaction, and the core temperature was about 250°C, which did not cause tar to be produced.
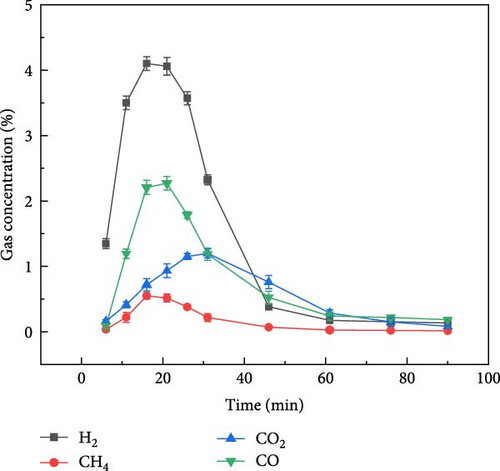
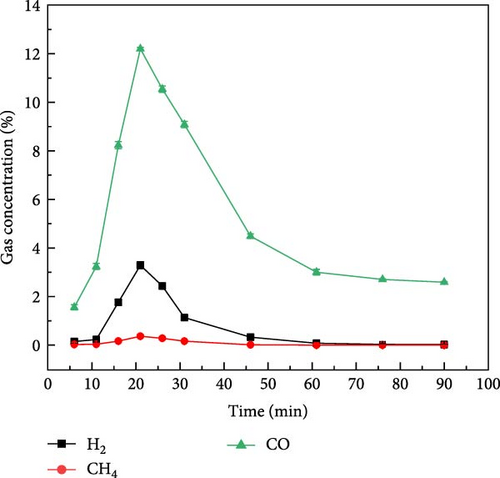
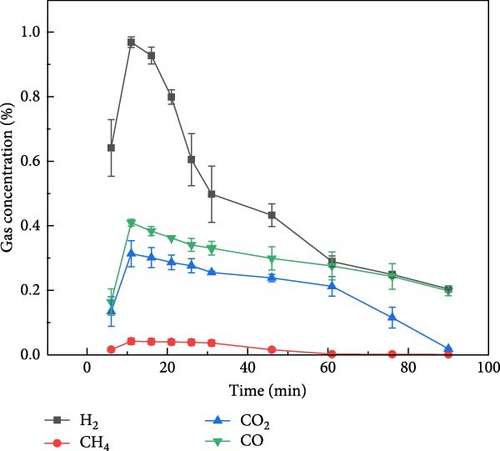
Figure 3 shows the gas production distribution of soybean gasification process under N2, CO2, and Ar ambient, respectively. The gas production of soybean under N2 and CO2 ambient was similar to that of millet. When soybean was gasification by plasma under N2 and CO2 ambient, the gas production rate of H2 was still the highest, and the gas production rate of CH4 was the lowest. After the reaction exceeded 50 min, the gas concentration of each component basically reached a stable state. Figure 3(c) shows the gas production distribution of soybeans during plasma treatment under Ar ambient. It can be found that the time when the gas concentration of each component reaches the highest value was about 47 min, which was later than that of soybean in the other two gases (N2 and CO2) and millet under the same ambient. On the one hand, due to the weak ionization energy of Ar itself and fewer high-energy electrons, the gasification rate is reduced compared with N2 and CO2, so the gas production rate is weakened, resulting in the peak gas production concentration extending to the middle and later stages of the reaction. On the other hand, it shows that different grain substances have different gas production rates under the same reaction conditions, which may be caused by the composition of the grain itself and the shape of the grain.
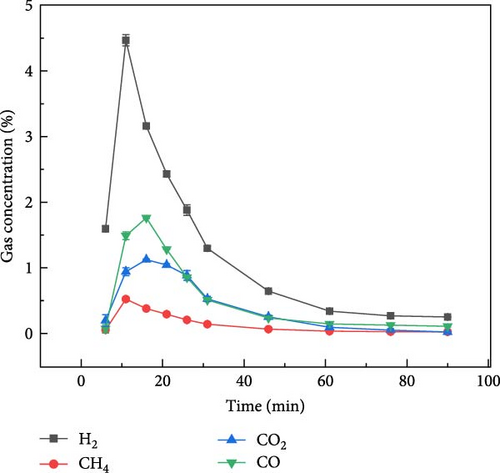
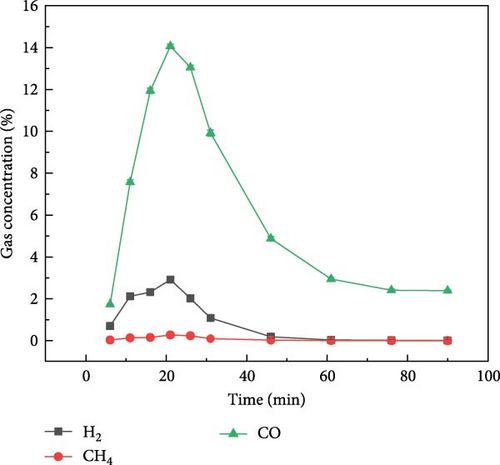
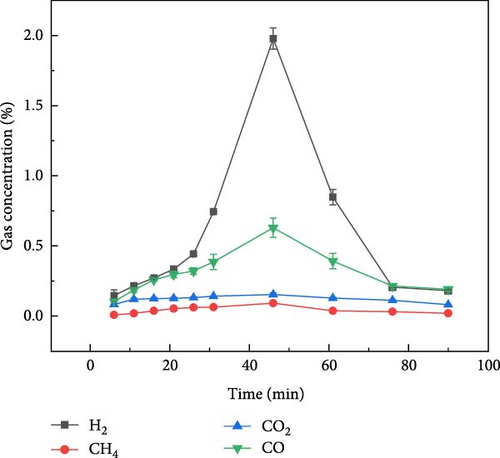
By analyzing the data in Table 1 and the gas production characteristics of biomass gasification above, it can be found that there is little difference in plasma discharge power under N2 and CO2 atmosphere, but the gas production concentration of millet and soybeans after plasma treatment under N2 atmosphere is much higher than that under CO2 atmosphere, indicating that plasma is not directly interacting with biomass and gasification. At the same time, when CO2 is used as carrier gas, there is a large amount of CO in the tail gas, which indicates that the high-energy electrons produced by the plasma fully interact with the carrier gas and produce a large number of plasma gas species. It can be inferred that during biomass gasification under plasma influence, gases are transformed into plasma gas species through plasma action. Subsequently, these plasma gas species interact with the biomass to facilitate gasification. Du et al. [31] also found that after the introduction of water vapor in the experiment, under the action of high-energy electrons, the water vapor in the plasma discharge region will produce OH·, H·, O·, and other active free radicals.
In order to further explore the gas production mechanism of food waste under different ambientes by plasma action, glucose and aspartic acid were selected as the model compounds of food waste, and their gas production characteristics by plasma were studied in experiment, and their decomposition paths were explored by DFT simulation.
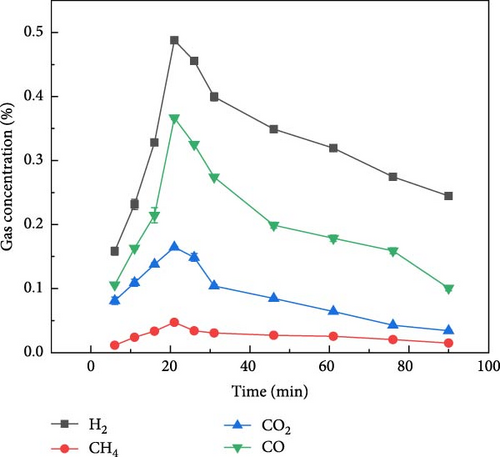
Figure 4 shows the gas distribution of glucose during plasma gasification under N2, CO2, and Ar ambientes, respectively. Figure 4(a) shows the gas production of glucose during gasification under N2 ambient. It can be found that the peak gas production of glucose during plasma treatment gasification under N2 ambient occurred between 20 and 25 min, and the overall gas production concentration was in the order of H2 > CO > CO2 > CH4 from high to low. The time of the maximum gas production was later than that of millet and soybean, but the overall gas production law was similar to that of millet and soybean. Figure 4(b) shows the gas distribution of glucose during plasma treatment under CO2 ambient. Under the action of CO2 ambient, when glucose is treated by plasma, the maximum concentration of CO output can reach 10%, and part of CO comes from the ionization of CO2. The maximum concentration of hydrogen production can reach 1.0%. Figure 4(c) shows the distribution of gas production during plasma treatment of glucose under Ar ambient. The peak time of gas production concentration of glucose under Ar ambient is earlier than that of N2 and CO2, but the gas production is significantly lower than that of the other two ambientes, and the output of H2 is only 1.3%.
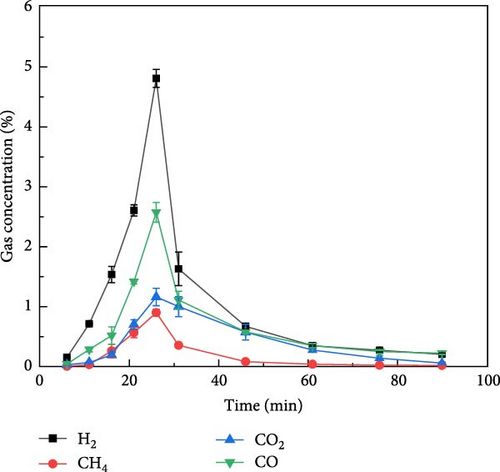
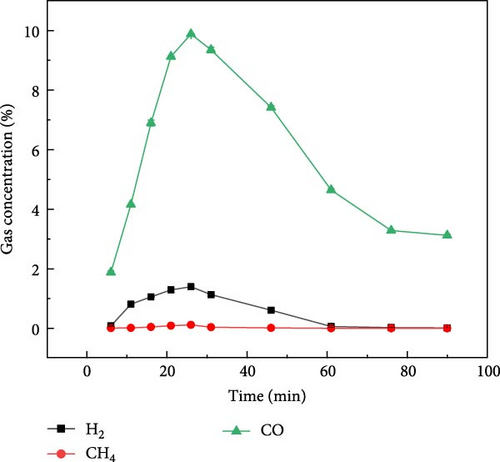
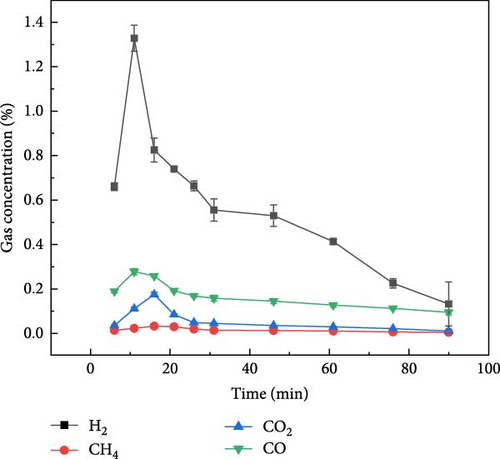
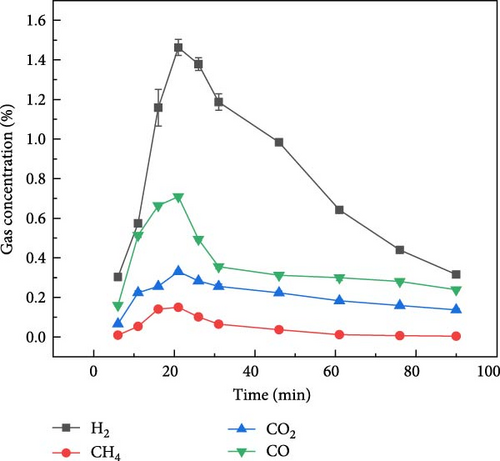
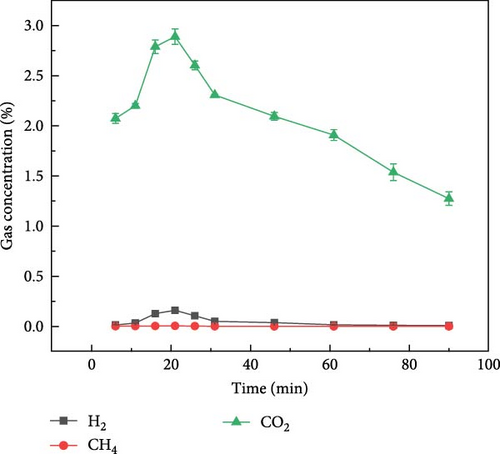
Figure 5 shows the gas production distribution of aspartic acid in N2, CO2, and Ar ambientes under plasma treatment gasification process. It can be found that the gas concentration of aspartic acid produced by plasma treatment under the three ambientes is lower than that of glucose. Figure 5(a) shows the gas production of aspartic acid during gasification under N2 ambient. It can be found that compared with glucose, the gas production time of aspartic acid is longer, and H2 gas production starts after plasma treatment and lasts for about 80 min. The gas production of CO, CO2, and CH4 lasted for about 30 min after the reaction. Figure 5(b) shows the gas distribution of aspartic acid during plasma treatment under CO2 ambient. Aspartic acid gasification basically only produces CO, H2, and CH4 concentrations less than 0.25%. Figure 5(c) shows the gas production distribution of aspartate in Ar ambient by plasma treatment. Similar to the gas production rule under the other two ambientes, the gas production time is also extended, and the gasification process basically ends after about 80 min of reaction. The gas production law of the two model compounds is basically consistent with that of millet and soybean. Therefore, the gas production mechanism of millet and soybean under the action of plasma can be explored by studying the gas production mechanism of the model compounds.
3.2. Mechanism of Gas Production
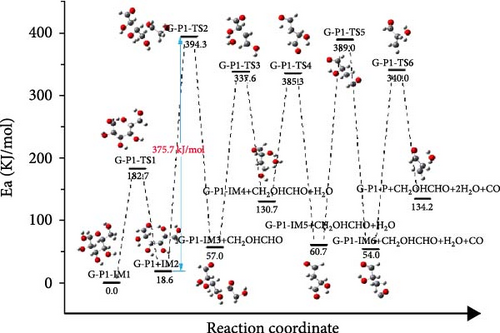
In order to further understand the mechanism of gasification of kitchen waste model compounds, DFT simulation was used to study the decomposition pathways of glucose and aspartic acid. According to where the glucose molecule breaks the bond, three different pathways (G-P1, G-P2, and G-P3) are considered. Figure 6 shows the reaction path and Gibbs free energy of glucose decomposing. The molecular structure formula corresponding to the glucose decomposition path is shown in Figure 7. For G-P1 pathway shown in Figure 6(a), the glucose molecule with ring structure first underwent the ring-opening reaction to produce glucose with chain structure (G-P1-IM2). This process needs to cross an energy barrier of 182.7 kJ/mol and absorb 18.6 kJ/mol of energy in the reaction. G-P1-IM2→G-P1-IM3 had C–C bond breaking and hydrogen transfer. The process of G-P1-IM3→G-P1-IM4 was elimination reaction, and H2O was formed at the same time. This process needs to cross an energy barrier of 280.6 kJ/mol and absorb 725 kJ/mol of energy in the reaction. G-P1-IM4 has an enol-like structure, which is extremely unstable and will produce products with a stable ketone structure. Then, it underwent decarbonylation and elimination to form CO and H2O. It can be found that the speed control step of the G-P1 path is the breaking of C─C bond and the transition of H (G-P1-IM2→G-P1-IM3).
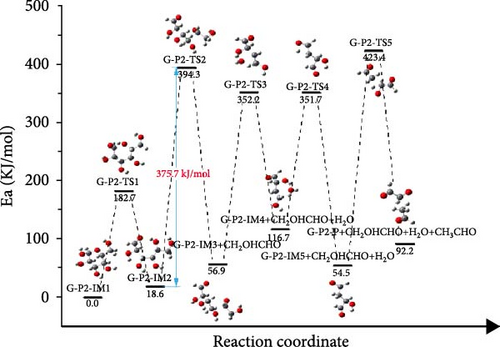
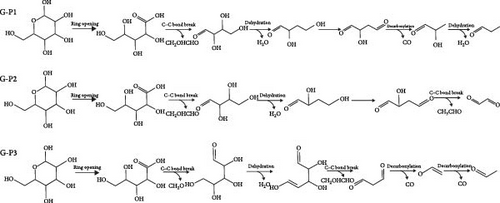
As shown in Figure 6(b), in the G-P2 pathway, the glucose molecule underwent ring-opening reaction, elimination reaction, hydrogen transfer reaction, C─C bond breaking, and other processes to finally decompose. After the ring-opening reaction, the G-P2-IM3→G-P2-IM4 process was the elimination reaction, which removes one molecule of water from glucose. The G-P2-IM4→G-P2-IM5 process was a hydrogen transfer reaction, and the energy barrier that need to be overcome for the G-P2-IM4→G-P2-IM5 process was 235.0 kJ/mol. Finally, C─C bond breakage and hydrogen transfer occurred, and the decomposition of glucose molecules was completed.
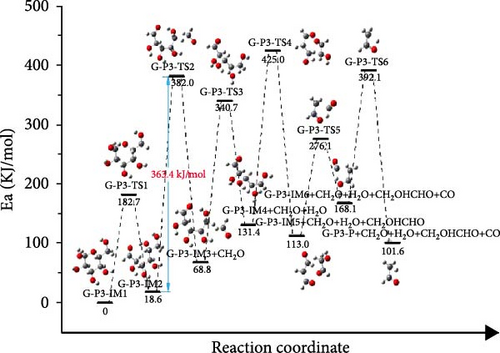
Figure 6(c) depicts the reaction path and Gibbs free energy of G-P3, the glucose molecule first underwent the ring-opening reaction, and then decarburization reaction formed G-P3-IM3 and formaldehyde. The activation energy of this process is 362.2 kJ/mol. G-P3-IM3 underwent elimination again and produced H2O. G-P3-IM4 was decomposed by carbon─carbon bond breaking, decarbonization reaction, hydrogen transfer, and so on. Finally, the glucose molecule was broken down. By comparing the rate-controlling steps of the three paths, it can be found that the G-P3 path is the most likely path, and the activation energy of G-P3 to be overcome in the rate-controlling step is 363.4 kJ/mol. The decomposition process of glucose is shown in Figure 7, mainly includes four parts, which are ring opening reaction, decarbonylation reaction, dehydration reaction, and carbon─carbon bond breaking. And the rate-controlling step is the formation of H2O.
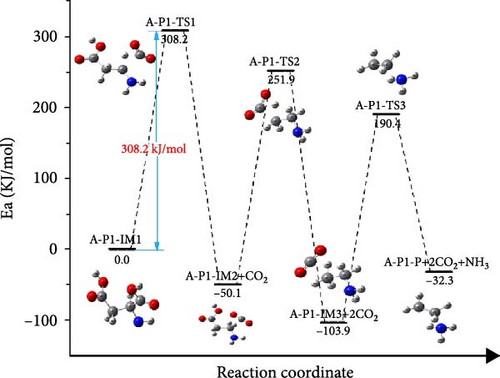
The reaction pathway and Gibbs free energy of aspartic acid decomposing are shown in Figure 8. Also, three different pathways (A-P1, A-P2 and A-P3) of aspartic acid decomposing are considered. The molecular structure formula corresponding to the aspartic acid decomposition path is shown in Figure 9. Figure 8(a) shows the reaction path and Gibbs free energy of A-P1 path, aspartic acid was decarbonized to produce A-P1-IM2 and CO2, which released 50.1 kJ/mol of energy. A-P1-IM2 was decomposed into A-P1-IM3 and NH3, and the activation energy of this process was 208.7 kJ/mol. A-P1-P and CO2 are the products of the decarbonylation of A-P1-IM, which overcomes the energy barrier of 268.3 kJ/mol and releases 34.7 kJ/mol of energy. It can be found that the speed control step of A-P1 path is A-P1-IM1→A-P1-IM2+CO2, and the energy barrier overcome by this process is 308.2 kJ/mol.
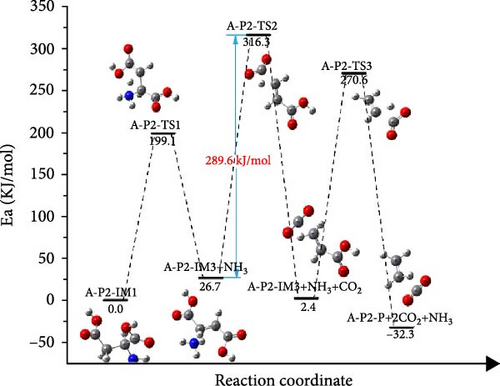
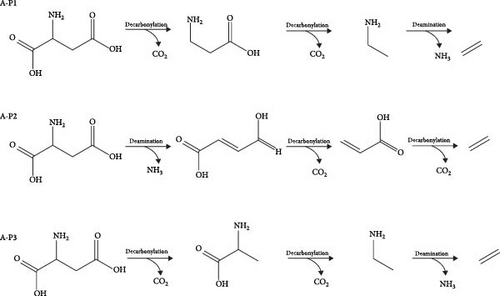
For A-P2 shown in Figure 8(b), A-P2-IM1 is first decomposed into ammonia and A-P3-IM2, which requires an energy barrier of 199.1 kJ/mol to overcome, and 26.7 kJ/mol is absorbed in the reaction. The decarbonylation of A-P2-IM2 could form A-P2-IM3 and CO2, which the activation energy is 289.6 kJ/mol. Finally, A-P3-IM3 is decarbonized to produce CO2 and ethylene with an energy barrier of 268.2 kJ/mol. It can be found that the speed control step of the P2 path is A-P2-IM2→A-P2-IM3 process, and the activation energy of the reaction is 289.6 kJ/mol.
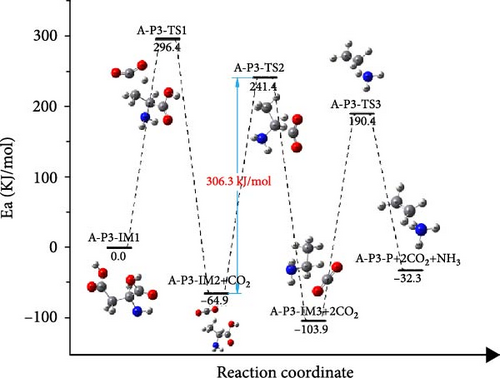
In the Figure 8(c), A-P3-IM1 first underwent decarbonylation to form A-P3-IM2. The energy barrier of this process is 296.4 kJ/mol, and the energy released by the reaction is 64.9 kJ/mol. The decomposition of A-P3-IM2 to form A-P3-IM3 and CO2, which is the rate-controlled step of the reaction, and the activation energy is 306.3 kJ/mol. At least, the A-P3-IM3→A-P4-P reaction could form NH3 and ethylene with the energy barrier value of 294.3 kJ/mol. By comparing the activation energy of three different path control steps, it is found that A-P2 path is the best path for the decomposition of aspartic acid. The decomposition process of aspartic acid mainly includes decarbonylation and deammonia reaction. And the decarbonylation process controlled the decompose of aspartic acid.
3.3. Characterization of Gasification Solid Product
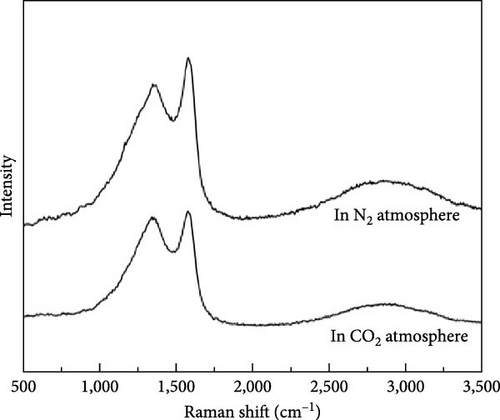
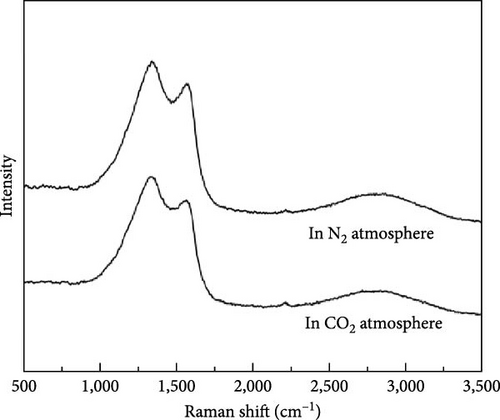
In order to use the solid products produced by gasification with DBD treatment efficiently, the physicochemical properties of the solid product carbon material after kitchen waste gasification were also studied by some characterization methods. Figure 10 shows the Raman spectra of carbon materials of millet and soybean treated by plasma under different reaction ambientes, and Table 2 presents the value of ID/IG of the carbon materials prepared by millet and soybean. The Raman spectra of the carbon material prepared by millet is shown in Figure 10(a). It can be found that the typical G and D peaks of graphite materials appear at 1,582 cm−1 and 1,350 cm−1, respectively, indicating that biomass materials are transformed into carbon materials after plasma treatment under N2 and CO2 ambientes [32, 33]. Among them, peak D represents structural defects or impurities present in the carbon material. Peak G represents the lattice vibration or pure isomer of the carbon material, resulting from the surface vibration of the sp2 carbon atom [34]. From Table 2, the graphitization degree of the carbon material produced by the plasma treatment of millet in N2 ambient is smaller than that of the carbon material produced in CO2 ambient. It can be seen that the biomass carbon material treated in the CO2 ambient has a higher degree of chaos, which is caused by the continuous reaction of the carbon material generated in the reaction process with the CO2 ambient and the active oxygen generated by ionization.
| Species | ID/IG |
|---|---|
| Millet in N2 atmosphere | 0.92 |
| Millet in CO2 atmosphere | 0.97 |
| Soybean in N2 atmosphere | 1.12 |
| Soybean in CO2 atmosphere | 1.15 |
The Raman spectra of carbon materials of soybean treated by plasma under different reaction ambientes are shown in Figure 10(b). It can be found that there are still two characteristic peaks, peak D and peak G, but the intensity of peak D was much higher than that of peak G. The results indicated that the graphitization degree of soybean after plasma treatment was higher than that of millet [35, 36]. Compared with the carbon materials produced by plasma treatment of soybean in N2 ambient and CO2 ambient, the graphitization degree of the samples of millet and soybean in N2 ambient is greater than that of the samples in CO2 ambient. However, although the carbon material produced by plasma treatment of soybean has the highest degree of graphitization, its gas production under N2 and CO2 ambient is lower than that of millet, which may be due to the influence of the mechanism of plasma treatment of biomass related to the particle size of biomass.
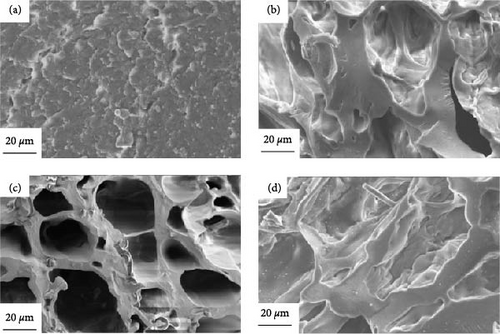
Figure 11 shows the SEM images of the raw materials of millet and the carbon materials treated by plasma under different reaction ambientes. As shown in Figure 11(a), it is the original material of, the surface of the original millet was complete and there were many bumpy small particles. Figure 11(b) shows the SEM image of the millet treated by plasma under N2 ambient. Compared with the original material surface, convex particles disappeared, and a small number of pore structures appeared. The pore structure was mainly large, with a diameter of about 40 μm. Figure 11(c) shows the SEM diagram of the millet treated by plasma in CO2 ambient. Similar to the carbon material treated by N2, a small number of pore structures appeared on the surface, but the pore structure was more developed, which may be due to the oxidizing ambient of CO2 itself caused a more developed pore structure was produced. Figure 11(d) shows the SEM image of the millet treated by plasma under Ar ambient, which was quite different from the morphology of the products under the other two ambientes. There were still a small number of particles on the surface of the millet treated under Ar ambient, and the traces of particles eroded on the surface of the carbon material can also be obviously observed. This is due to the weak ionization energy of Ar ambient, the production of less active ions, resulting in weak biomass gasification performance. It can also further reveal the reason for the low gas production of millet after plasma treatment in Ar ambient. At the same time, through the above microscopic appearance, it can also be inferred that the mechanism of plasma treatment of biomass is layer by layer erosion. First, high-energy electrons react with particles present on the surface of the biomass. When the biomass surface is flat, high-energy electrons further interact with it, producing syngas and forming pore structures on the solid surface.
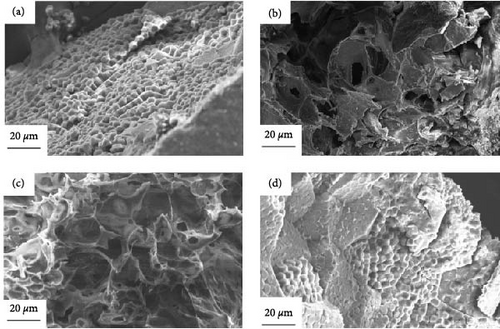
Figure 12 shows the SEM images of soybean raw materials and carbon materials treated by plasma under N2, CO2, and Ar ambientes. Figure 12(a) shows the morphology of soybean surface, the surface structure shows a scaly structure, and the surface is relatively flat as a whole. As shown in Figure 12(b), the surface of the sample treated by plasma under N2 ambient is not smooth and a pit-like structure appears. This may be due to the high energy electrons produced by the plasma action and the gasification of the reactants layer by layer, the soybean particle size is large and the effect is weak under the same action time. Therefore, only pit-like structure appeared on the surface of soybean and no pore structure appeared. It is again proved that the mechanism of plasma action is the interaction of high energy electrons with reactants layer by layer. Figure 12(c) shows the SEM image of soybean products treated by plasma under CO2 ambient. It can be found that the morphology of soybean products under N2 conditions is similar, and only pit-like structure is produced on the surface, which is similar to that of another biomass. The pit structure of carbon materials produced by soybean under CO2 is more obvious than that under N2 ambient. Through the physical and chemical properties of the above carbon materials, it can be found that the high-energy electrons generated by the plasma will react layer by layer after contact with the biomass surface. Figure 12(d) depicts the SEM images soybean products treated by plasma under Ar ambient. It can be found that the surface of soybean after Ar treatment is not much different from the surface of the original soybean.
4. Conclusions
In this paper, the effects of plasma treatment of kitchen waste in different ambientes were studied. At the same time, the gas production mechanism and action mechanism of millet and soybean under the action of plasma were also investigated. The gasification effect of millet and soybean under N2 and CO2 ambient by plasma treatment is much better than that under Ar ambient. The concentration of hydrogen produced by millet gasification by plasma in N2 and CO2 ambientes can reach 4% and 3%, respectively, while in Ar ambientes, it is only 0.75%. No tar was produced in the treatment of kitchen waste with DBD under any carrier gas ambient. For glucose and aspartic acid, two typical food waste model compounds, decarbonylation controls the decomposition of glucose, and decarbonylation controls the decomposition of aspartic acid. Due to the weak ionization energy of Ar ambient, the gasification performance by plasma is poor. The surface pore structure of carbon materials produced by gasification under N2 and CO2 ambientes is more abundant than that under Ar ambientes. The interaction mechanism between plasma and biomass is layer by layer. Plasma treatment of kitchen waste can not only inhibit the tar production while producing gas, but also the solid product has excellent physicochemical properties and can be further used efficiently.
Conflicts of Interest
The authors declare that they have no conflicts of interest.
Acknowledgments
This work was supported by Key Technologies Research and Development Program (2022YFE0208100), National Natural Science Foundation of China (U1910215), 2023 Youth Project of Liaoning Department of Education (JYTQN2023237), and Liaoning Provincial Engineering Research Centre for Advanced Coking and Coal Utilization.
Open Research
Data Availability
All the data can be provided on request.


