Controllability of Functional and Structural Brain Networks
Abstract
Normal and aberrant cognitive functions are the result of the dynamic interplay between large-scale neural circuits. Describing the nature of these interactions has been a challenging task yet important for neurodegenerative disease evolution. Fusing modern dynamic graph network theory techniques and control theory applied on complex brain networks creates a new framework for neurodegenerative disease research by determining disease evolution at the subject level, facilitating a predictive treatment response and revealing key mechanisms responsible for disease alterations. It has been shown that two types of controllability—the average and the modal controllability—are relevant for the mechanistic explanation of how the brain navigates between cognitive states. The average controllability favors highly connected areas which move the brain to easily reachable states, while the modal controllability favors weakly connected areas representative for difficult-to-reach states. We propose two different techniques to achieve these two types of controllability: a centrality measure based on a sensitivity analysis of the Laplacian matrix is employed to determine the average controllability, while graph distances form the basis of the modal controllability. The concepts of “choosing the best driver set” and “graph distances” are applied to measure the average controllability and the modal controllability, respectively. Based on these new techniques, we obtain important disease descriptors that visualize alterations in the disease trajectory by revealing densely connected hubs or sparser areas. Our results suggest that these two techniques can accurately describe the different node roles in controlling trajectories of brain networks.
1. Introduction
Novel concepts in dynamic graph networks theory derived from modern network controllability have proven to be useful in understanding and describing the dynamics of large-scale neural circuits or networks and deriving theory-driven imaging biomarkers for disease prediction at the patient level. It differs significantly from static graph theory, heavily now used in brain studies, since it considers the structural or functional connectivity matrix and models the dynamics of state changes of that structure.
While the study of communication principles applied to neural systems has developed in parallel with our understanding of the brain, the application of control theory to support the dynamical analysis of brain systems is in its incipient phase. Furthermore, modern control theory including dynamic graph networks is an unchartered territory in brain research offering a huge potential for providing simplified computer models for predicting disease evolution and identifying disease epicenters and thus supporting longitudinal study with a-priori information for many neurogenerative diseases such as dementia, Alzheimer’s disease, and Parkinson’s disease. Neuroimaging techniques such as Positron Emission Tomography (PET), single-photon emission computed tomography (SPECT), and magnetic resonance imaging (MRI) represent the standard methods to diagnose functional and structural information.
It has been shown that cognitive control [1–7] plays an important role in connecting multiple sources of information required to solve complex problems and retrieving information from memory. The classical cognitive theory of control is based on the concept of competitive dynamics in frontal cortices; however, recent studies in functional neuroimaging suggest that control functions are facilitated by transitory changes of cooperation and competition patterns between distributed neural systems found in default mode, attention, and frontoparietal networks [8]. Furthermore, disease evolution and the different state changes found in dynamic functional MRI representative for many neurodegenerative diseases prompted a new view of cognitive control mechanisms that can be described by the control theory in engineering.
An analogy between networked systems in the brain and modern dynamic graph networks can be made: neural ensembles or regions in the brain correspond to nodes in graph theory and their structural or functional connections correspond to links. Both concepts of controllability and observability are of crucial importance for understanding operational and dynamical brain networks impacting neural function, disease, development, and rehabilitation. Controllability refers to the capability of driving the network system along a desired trajectory, while observability refers to infer the internal states from knowing the external outputs.
Human brain networks exhibit a multitude of temporal characteristics as seen for example in mental disorders. Temporal connectivity has been used to detect the regions of interest (ROIs) in the epileptic brain network [9]. Dynamical graph properties of temporal brain networks were successfully applied to the identification of subjects with chronic schizophrenia [10]. Applying the control theory of complex networks to human brain networks could provide powerful methods to unveil the longitudinal behavior of mechanistic models for other diseases. Temporal networks are more biologically motivated than their static counterparts since they use orders of magnitude less control energy, have more compact control trajectories, and reach controllability faster [11, 12].
In [3, 13, 14], it was shown that certain brain regions or nodes in the connectivity graph (structural or functional) can act as drivers and move the system (brain) into specific states of action. These influence the cognitive functions. Looking into brain networks’ graph architectures, we discover highly connected and weakly connected areas. In [3], it was shown that two different types of controllability concepts apply to this aspect. The so-called “average controllability” quantifies the position of a node in directing a network to easily reachable states. Those nodes represent highly connected hubs. On the other hand, “modal controllability” refers to nodes in weakly connected areas moving the brain to difficult-to-reach states. The mathematical conditions necessary to fulfill the requirements for these two controllability types were derived.
Most of the current research on controllability of dynamical systems applied to brain networks is centred on the structural properties of the network and assumes that the dynamics of each node is of order of one. In this paper, we propose more general conditions for the two controllability definitions and illustrate in examples the theoretical analysis. Compared to previous studies, we analysed two new aspects of controllability. The average controllability which determines the densely connected hubs and quantifies the energy required for controlling the network. For the average controllability, we employ the method proposed in [15] determining a ranking of the best driver sets and thus of the network’s hubs. On the other hand, the modal controllability determines difficult-to reach states, favours sparsely connected nodes, and requires no knowledge of the edges’ values in the network but is based only on the graph architecture. For the modal controllability, we employ the method proposed by [16] which operates based on the graph distances to determine the controllability. In this study, we employ two different aspects of controllability that determine both the highly connected hubs and the best driver nodes and thus enhance the descriptive biomarkers. The outcomes of this investigation have potential applications beyond fMRI which are briefly reviewed in the “Discussion” section.
2. Preliminary Controllability Concepts and Definitions
Two definitions of controllability are used: the average and the modal controllability. The average controllability is given as the average input energy from a set of control nodes and over all possible target states. In [18], a measure of average controllability is given as trace(Wk). Regions of high average controllability are known to be most leading in the control of the network dynamics. The modal controllability is employed to identify states that are difficult to control and identifies weakly connected areas. In [19], it was stated that the modal controllability is computed from the eigenvector matrix of the network adjacency matrix A.
A dynamical system such as the brain is said to be controllable if it can be controlled from any initial state to any final state in a given amount of time. Structural controllability has been proposed to eliminate the influence of disturbances on system parameters and to reduce numerical instabilities. The minimum number of driver nodes to structural control the brain network is topology-characteristic.
3. Average Controllability Based on Determining the Best Driver Set
The concept of controllability metrics and minimum energy has been recently applied in imaging connectomics [3, 26] and raised important questions related to the neurobiological interpretation of controllability metrics and possible intervention strategies. Here, we are looking for a computationally simple yet accurate metric to choose the best driver nodes to facilitate synchrony.
It ranks all subsets of nodes based on their influence on η [15]. It only depends on the topology of the interaction network and performs ranking by using only a single eigen-decomposition of the Laplacian matrix.
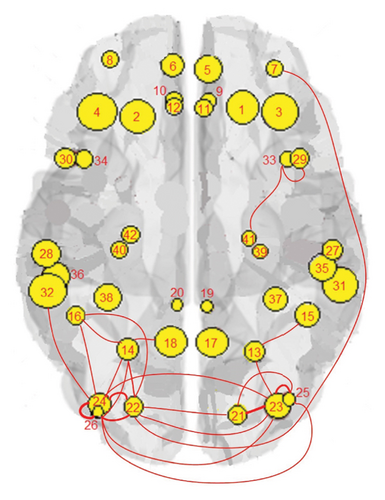
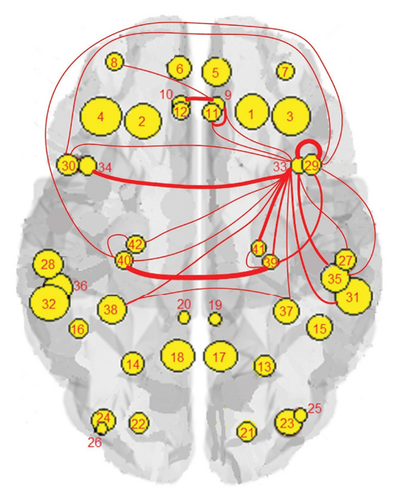
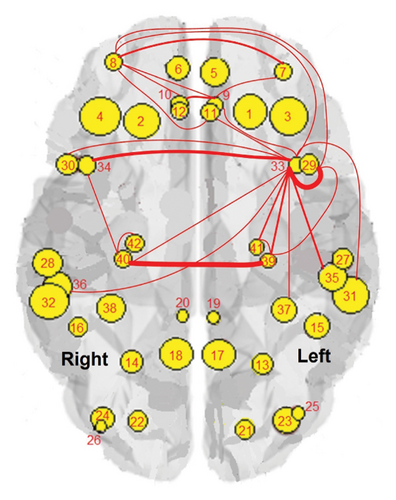
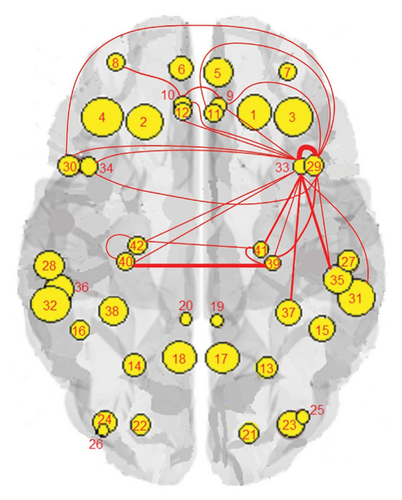
Example 1. We apply the controllability concepts on functional (FDG-PET) and structural (MRI) connectivity graphs [28] for control (CN), mild cognitive impairment (MCI), and Alzheimer’s disease (AD) subjects. In total, 249 subjects have been considered, consisting of 68 normal/control, 111 MCI, and 70 AD. According to [28], MRI and PET images from the ADNI database have been spatially normalized according to the PET and VBM-T1 templates, respectively, ensuring that each image voxel corresponds to the same anatomical position. MRI images are segmented into White Matter (WM) and Gray Matter (GM) tissues. PET images are also normalized in intensity to compute comparable levels among the images. Intensity normalization is performed by means of the mean image, which is used as a normalization template. The structural and functional graphs [28] consider only 42 dementia-relevant regions out of the 116 from the AAL in the frontal, parietal, occipital, and temporal lobes (Table 1). These dementia-relevant regions represent the nodes in the graph, while the connections describe the interregional covariation of gray matter volumes in different areas for the structural data, while in the case of functional data, they capture the glucose uptake between different regions.
Figure 1 shows the clusters found on the functional data for (a) controls, (b) MCI, and (c) AD, while Figure 2 shows the clusters found on the structural data [28]. Thicker lines in these graphs correspond to stronger connections. The nodes correspond to the regions located in the frontal, parietal, occipital, and temporal lobes because they are considered to be related to AD.
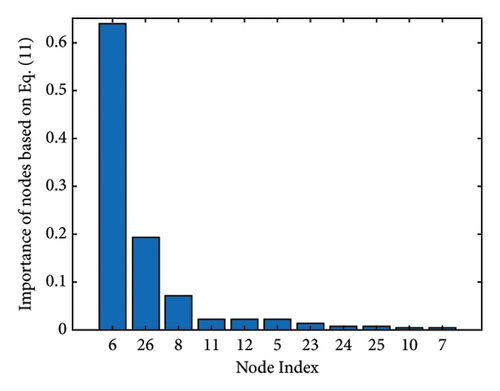
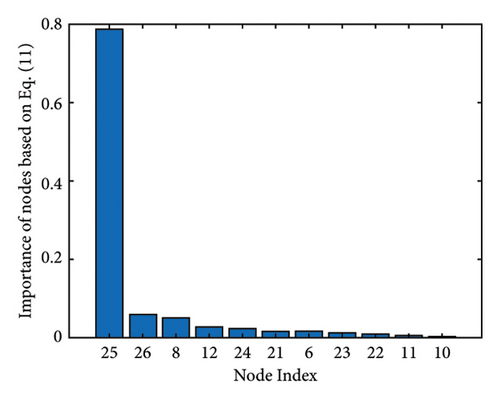
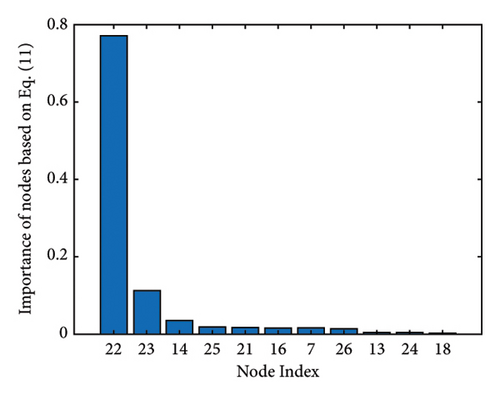
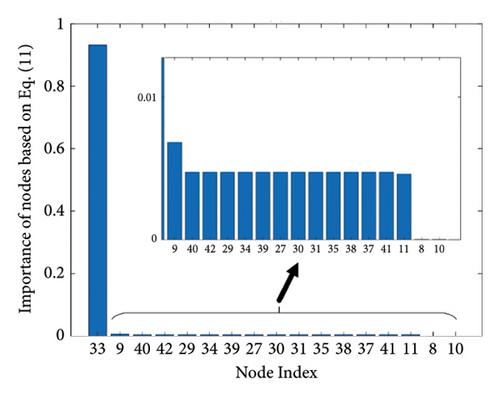
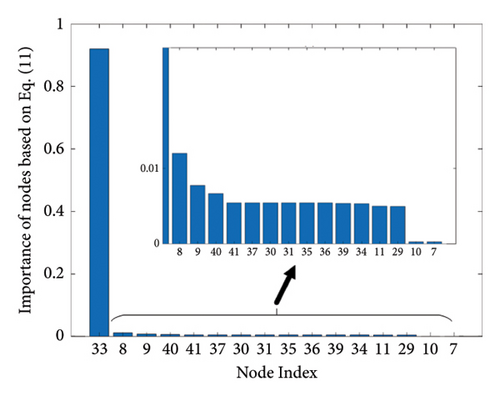
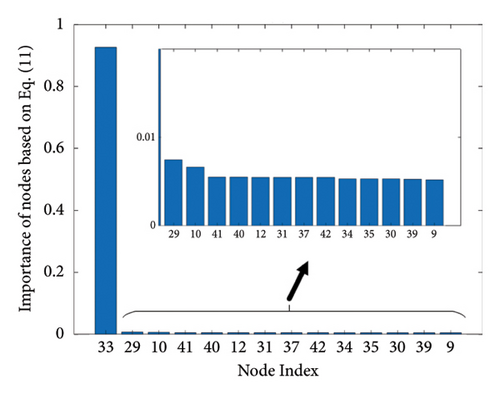
The results of the in-depth dynamical analysis for controllability based on choosing the best driver set for functional and structural networks are shown in Figures 3 and 4. The results show that the proposed method detects in a ranking the most significant “hubs”. Figure 3 shows the node six, i.e., the Frontal_Sup_Medial_R, being the highest ranked node as a hub in the frontal lobe for controls, the node twenty-five in the occipital lobe for MCI, and the node twenty-two also in the occipital lobe for AD for functional networks. The obtained ranking of hubs based on the proposed method shows that it is a valid method for determining the average controllability. Figure 4 shows the node thirty-three in the temporal lobe being the highest ranked node as a hub for controls, MCI, and AD for structural networks. In fact, for functional brain networks, the average controllability correctly determined the highest ranking hubs in the frontal lobe for controls and in the occipital lobe for MC and AD. For structural brain networks, all three groups have the highest ranking hub in the temporal lobe.
| Frontal lobe | Parietal lobe | Occipital lobe | Temporal lobe | ||||
|---|---|---|---|---|---|---|---|
| 1 | Frontal_Sup_L | 13 | Parietal_Sup_L | 21 | Occipital_Sup_L | 27 | Temporal_Sup_L |
| 2 | Frontal_Sup_R | 14 | Parietal_Sup_R | 22 | Occipital_Sup_R | 28 | Temporal_Sup_R |
| 3 | Frontal_Mid_L | 15 | Parietal_Inf_L | 23 | Occipital_Mid_L | 29 | Temporal_Pole_Sup_L |
| 4 | Frontal_Mid_R | 16 | Parietal_Inf_R | 24 | Occipital_Mid_R | 30 | Temporal_Pole_Sup_R |
| 5 | Frontal_Sup_Medial_L | 17 | Precuneus_L | 25 | Occipital_Inf_L | 31 | Temporal_Mid_L |
| 6 | Frontal_Sup_Medial_R | 18 | Precuneus_R | 26 | Occipital_Inf_R | 32 | Temporal_Mid_R |
| 7 | Frontal_Mid_Orb_L | 19 | Cingulum_Post_L | 33 | Temporal_Pole_Mid_L | ||
| 8 | Frontal_Mid_Orb_R | 20 | Cingulum_Post_R | 34 | Temporal_Pole_Mid_R | ||
| 9 | Rectus_L | 35 | Temporal_Inf_L 8301 | ||||
| 10 | Rectus_R | 36 | Temporal_Inf_R 8302 | ||||
| 11 | Cingulum_Ant_L | 37 | Fusiform_L | ||||
| 12 | Cingulum_Ant_R | 38 | Fusiform_R | ||||
| 39 | Hippocampus_L | ||||||
| 40 | Hippocampus_R | ||||||
| 41 | ParaHippocampal_L | ||||||
| 42 | ParaHippocampal_R | ||||||


4. Modal Controllability Based on Graph Distances
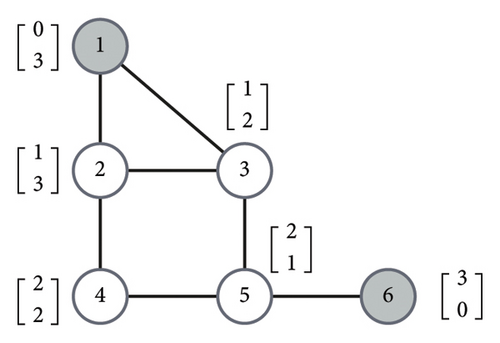
It is worth noting that this optimization problem is always feasible since at least L = V is a solution.
Example 2. We apply the graph theoretical results on the same functional (FDG-PET) and structural (MRI) connectivity graphs [28] for control (CN), mild cognitive impairment (MCI), and Alzheimer’s disease (AD) subjects.
Using the distance-based structural controllability results from [16], it can be shown that functional networks would be completely controllable under any weighted consensus-type dynamics if the leaders are selected as Table 2. Interestingly, the driver nodes for controls and MCI in this table are mainly from frontal and occipital lobes, respectively. This is the same result as what we achieved in the average controllability of functional networks in Example 1.
The structural networks would be completely controllable under any weighted consensus-type dynamics if the leaders are selected as Table 3. The found leaders based on this method avoid the central hub, i.e., the node with the highest degree, and that it is a valid method for determining the modal controllability. However, compared to the average controllability approach, nodes 33, 38, and 40 are common between the “Controls” column in Table 3 and the top-five nodes ranked in Figure 4(a). That means both approaches suggest the nodes in the temporal lobe as drivers for structural networks. The same comparison for the MCI suggests nodes 8 and 9 from the frontal lobe as drivers.
It is important to mention that these are not necessarily the smallest set of leaders that ensures the controllability of those networks, but they are the smallest sets that can be obtained by relying on the distance-based results from [16].
| Controls | MCI | AD | |
|---|---|---|---|
| Indices | 1, 2, 5, 7, 12, 25, 33, 40 | 7, 9, 22, 24, 26 | 7, 16, 18, 21, 29 |
| Nodes | Frontal_Sup_L | Frontal_Mid_Orb_L | Frontal_Mid_Orb_L |
| Frontal_Sup_R | Rectus_L | Parietal_Inf_R | |
| Frontal_Sup_Medial_L | Occipital_Sup_R | Precuneus_R | |
| Frontal_Mid_Orb_L | Occipital_Mid_R | Occipital_Sup_L | |
| Cingulum_Ant_R | Occipital_Inf_R | Temporal_Pole_Sup_L | |
| Occipital_Inf_L | |||
| Temporal_Pole_Mid_L | |||
| Hippocampus_R | |||
| Controls | MCI | AD | |
|---|---|---|---|
| Indices | 13, 14, 81, 83, 84, 143, 144, 175, 187 | 11, 12, 13, 14, 81, 82, 83, 84, 136, 137, 144, 151, 154, 176, 182 | 42, 82, 83, 84, 144, 152, 154, 176, 182 |
| Nodes | Frontal_Mid_Orb_R | Frontal_Mid_Orb_L | Rectus_L |
| Rectus_R | Frontal_Mid_Orb_R | Cingulum_Ant_L | |
| Temporal_Sup_L | Rectus_L | Cingulum_Ant_R | |
| Temporal_Pole_Sup_L | Cingulum_Ant_L | Temporal_Pole_Sup_R | |
| Temporal_Pole_Sup_R | Temporal_Pole_Sup_R | Temporal_Mid_L | |
| Temporal_Pole_Mid_L | Temporal_Mid_L | Temporal_Pole_Mid_R | |
| Temporal_Pole_Mid_R | Temporal_Inf_R 8302 | Hippocampus_L | |
| Fusiform_R | Fusiform_L | ParaHippocampal_L | |
| Hippocampus_R | Hippocampus_L | ||
| ParaHippocampal_R | |||
5. Discussion
In this paper, we applied novel dynamic graph theory methods to determining the average and modal controllability of functional and structural brain connectivity networks. These two concepts play an important role in dynamic imaging connectomics since they describe the dynamical behavior of areas in the brain with respect to their type of connectivity (dense or weak) and the movement of the brain to either easy reachable or difficult-to-reach states.
An important aspect in structural network topology is hubs. While hubs support the brain’s capability to be robust to lesions, or, for example, for better synchronizability, they may be avoided in control theory since they do not belong to the regions that steer the network dynamics to difficult-to-reach patterns of activity [29]. Hubs might efficiently transmit control signals across the connectome in order to achieve new patterns of activity. Another important role of the hubs is that they enable the integration of functionally specialized and anatomically disparate neural regions. We applied the new concept of choosing the best driver set for average controllability and that of graph distances for the modal controllability. Based on these new techniques, we obtain important disease descriptors that visualize alterations in the disease trajectory by revealing densely connected hubs or sparser areas. Examples show the importance of the theoretical results for both new concepts. For both structural and functional networks, the relevance of hubs and the number of driver nodes decreases from controls to AD. The observation of those changes can offer important indications about the status of disease evolution in a patient and can thus be applied in longitudinal and intervention studies.
While derived graph measures and their changes over time in static graph theory show the differences between disease and normal control, looking at the brain as a dynamical networked system undergoing changes in patterns of cooperation and competition opens a new research avenue. The key concept of controllability plays a central role determining the driver nodes in a brain network. These transitions of the brain between diverse cognitive states are believed to have far-reaching implications for the clinical areas. Thus, it allows an in-depth study of the differences between disease and control groups and provides a diversity of temporal characteristic features to better discriminate these groups. Finally, it improves personalized medicine by looking into individual differences in diagnostics based on network controllability.
Another important aspect is the connected network architecture at multiple spatiotemporal scales achieved based on multilayer networks with intra- and interlayer edges. Each layer’s nodes represent brain regions; however, there is a unique dynamics (time scale) associated with the layer. An interesting future direction would be how to control such a complex dynamics [30]. Finally, network control theory can open a new avenue to study cognitive control [2, 3, 5, 26] by describing the way how the brain influences its behavior to be able to perform certain tasks, the collective role of brain networks in fluid intelligence [7], its critical role in the pathophysiology of schizophrenia [31], the importance of the left inferior frontal gyrus in controlled language performance [6], the brain network organization between cognitive control and reward regions [4], and the crucial connection between the spontaneous metastability of large-scale networks in the cerebral cortex and cognition [1].
The application of graph theory to explore the intricacies of the brain’s functional and structural characteristics extends in the literature beyond human fMRI networks. For instance, a study in macaque monkeys [32] unveils the complexity of the functional single neuron network in three frontoparietal areas during active behavior, emphasizing the heterogeneous importance of individual neurons. Another study in monkeys [33], grounded in graph theory, delineates the hierarchical emergence of anticorrelation hubs within the local PMd network before motor execution, implying that these hubs serve as indicators of motor plan readiness and impending movement initiation. Other investigations [34, 35] underscore the significance of specialized interconnected groups, often termed “rich clubs,” in neural computations and the comprehensive understanding of structural and functional attributes within local cortical circuits. In addition, graph theoretical analyses have been instrumental in revealing a robust and nontrivial hierarchical modular structure in the mouse brain’s functional connectivity [36], as well as identifying hubs of anticorrelation in resting-state fMRI [37, 38]. Finally, a recent study [39, 40] demonstrates altered hierarchical modularity and the presence of multiple topologically equivalent backbones in schizophrenia, aligning with the disconnection hypothesis that characterizes the illness as a disruption in functional integration among brain regions. Indeed, the outcomes of this investigation offer the potential for a more extensive contextualization of the research, potentially facilitating the future application of the proposed methods beyond fMRI data, extending to other vital sources of electrophysiological signals such as firing rates, multi-unit activity (MUA), local field potentials (LFP), and more. Finally, novel and reliable biomarkers derived from PET, SPECT, and MRI will be employed in future to effectively differentiate and predict the dementia evolution.
Conflicts of Interest
The authors declare that they have no conflicts of interest.
Authors’ Contributions
A. Moradi Amani and A. Meyer-Baese contributed equally to this paper.
Acknowledgments
We acknowledge funding through a Fulbright Franco-American Commission and Marie Sklodowska-Curie Actions. We are grateful to Dr. Yasin Yazicioglu for sharing his codes and expertise with us.
Open Research
Data Availability
No underlying data were collected or produced in this study.


