Fast Assessment Method for Transient Voltage Stability of Photovoltaic Receiving-End Grid
Abstract
The incorporation of renewable energy on a broad scale into power grids increases the complexity to the issue of transient voltage stability in power systems. This research presents a rapid evaluation technique for assessing the stability of voltage fluctuations in power grids that receive electricity from photovoltaic sources. At first, a receiving-end system model was developed, which includes photovoltaics, and an alternative circuit of the virtual induction motor (IM) is obtained by utilizing the Thevenin equivalent. Second, the torque balance equation and the Kirchhoff voltage equation are interconnected to determine the unstable slip of the IM following a malfunction. Finally, by merging the unstable slip with the conventional transient stability discriminant index, the effects of different photovoltaic outputs, IM ratios, and system contact impedances on transient voltage stability are investigated. The proposed method avoids the computational burden of solving the differential-algebraic equations describing the complex transient processes of the IM. It also obviates the necessity of iteratively modifying the receiving load or fault clearance time in the simulation platform to achieve the constrained stability condition of the system’s transient voltage. The transient stabilization of voltage results is efficiently obtained by directly solving algebraic equations.
1. Introduction
The substantial rise in electrical demand at the receiving-end, in addition to insufficient provision of reactive power, has worsened the problem of transient fluctuations in voltage in the power grids. Consequently, swiftly evaluating the power grid’s transient voltage stability is crucial to prevent voltage instability and potential collapse [1].
The energy function method [2], artificial intelligence techniques [3], and time-domain simulation are commonly employed in transient voltage stability studies. The time-domain simulation method describes the system components through differential equations, providing high calculation accuracy. However, it requires significant computational resources and long computation times, making it difficult to meet the rapid requirements of online applications. The energy function method has a clear physical meaning and fast calculation speed, but the construction of the energy function is complex, and the results are conservative when applied to complex systems. The artificial intelligence method can establish a direct mapping of features to transient states [4], but it lacks interpretability, which reduces the reliability of the evaluation results.
Extensive research has been conducted by scholars both domestically and internationally on the impact of induction motor (IM) load characteristics on system transient voltage stability. Huadong and Xiaoxin [5] studied the transient voltage stability of parallel synchronous generator (SG) and virtual synchronous generator (VSG) systems with IM load when connected to high-penetration IM load and found that the interaction of active power loops between SG and VSG exacerbates the transient voltage stability problem of the system. Li, Xingyuan, and Meimei [6] presented an analytical method to evaluate the transient voltage stability of load buses, which simplifies the load bus containing the external system into a simplified system with two load buses and calculates the critical cutoff time for each load bus using this simplified system. Jia et al. [7] analyzed the positive and negative feedback processes of voltage instability caused by the interaction between IM loads and the transmission network and used the slip at the fault cutoff time as a necessary condition to judge voltage stability. Fashun et al. [8] utilized a variable step-size bisection method to study the impact of different fault locations, IM ratios, and load rates on stability boundaries. They identified the dominant unstable mode based on the boundaries and constructed a mapping between input features and fault clearance time (CCT) using a data-driven approach. Furthermore, they enhanced the model prediction effectiveness by incorporating an attention mechanism. Wenchao et al. [9] and Chongqing and Liangzhong[ 10] studied how the mechanical torque of the IM affected the fault limit cutoff time in order to study the transient voltage stability of the system.
An IM’s slip at its unstable equilibrium point serves as a typical dynamic load useful for characterizing the transient voltage stability of the system. The system will experience brief instability if the IM’s slip surpasses its unstable equilibrium point following fault clearing [11]. Thus, the slip of the unstable equilibrium point of the IM can serve as an assessment signal for transient voltage stability. Bo, Deyou, and Guowei [12] propose a method for constructing a virtual motor and calculating the slip of the unstable equilibrium point of the IM using formulas for mechanical torque and electromagnetic torque before and after the fault. This approach avoids the need to solve the complex differential-algebraic equation system describing the transient process of the IM, thereby simplifying the analysis procedure. However, it is crucial to be aware that this strategy does not account for the integration of renewable energy sources, which are gradually altering the characteristics of traditional power grids [13–15]. Besides, several studies have pointed out that the transient voltage stability of power systems is significantly impacted by the integration of renewable energy sources [16–20].
The concentration of this study is on a conventional receiving-end power grid model with integrated photovoltaics. An IM virtual equivalent circuit, incorporating photovoltaic integration, is established. Using the mechanical torque and electromagnetic torque equations before and after the fault, the slip of the IM post-fault is calculated. The transient voltage stability of the system is assessed by taking the correlation between slip and fault limit cutoff time into consideration. Additionally, the approach is used to examine the influence of receiving-end photovoltaic output, load proportion, and system coupling impedance on transient voltage stability.
- 1.
Our research offers a fast transient stability assessment method, simplifying the analysis process and reducing computational requirements by utilizing unstable slip and fault clearing time.
- 2.
Existing methods often do not adequately consider renewable energy sources’ dynamic and intermittent nature, particularly photovoltaics. In this paper, the transient power output characteristics of PV systems are incorporated, reflecting their real-time behavior during faults and providing a more accurate assessment of transient voltage stability.
- 3.
Power system operation scenarios with different photovoltaic output and load proportions were built, and the proposed method was used to analyze the voltage transient stability rules under different scenarios.
2. The Model of the Receiving-End Power Grid With Photovoltaics
A classical receiving-end power grid model with integrated photovoltaics is established, as illustrated in Figure 1. The model consists of an infinite source connected to load busbar 3 through step-up transformer T1, transmission line 1, and step-down transformer T2. The photovoltaic system is connected to load busbar 3 through step-up transformer T3 and transmission line 2. The potential of the infinite source remains constant, both before and after a fault. In this model, the resistances of transmission lines and transformers are neglected, and only reactance is considered. The load model at the receiving end employs a constant impedance model for the IM.

Figure 2 illustrates the equivalent circuit of a receiving-end system with integrated photovoltaics.
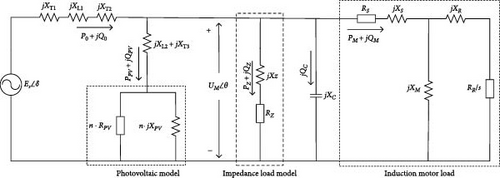
The potential of the infinite source is represented as ES∠δ. The values XT1, XT2, XL1, and XL2 correspond to the equivalent reactances of the transformers and lines. The IM is depicted as a composite system made up of a fixed impedance and an IM, as shown in Figure 2 within the dashed box. The terminal voltage, denoted as EM∠θ, corresponds to the voltage at busbar 3.
It can be seen from Figure 2 that QC has an opposite direction of transmitting power with XC.
2.1. IM and Constant Impedance Model
In this paper, a simplified IM model is deployed to reduce the computational complexity from the practical application perspective. The simplified model captures the essential dynamics of IMs that are most relevant to transient stability, such as the relationship between slip, torque, and voltage. Besides, it provides scalability, which is crucial for assessing the stability of modern power systems with extensive renewable integration.
2.2. Photovoltaic Transient Equivalent Model
Photovoltaic power generation primarily consists of a photovoltaic array and a grid-tied inverter, along with other components. A photovoltaic array generates direct current (DC) electricity when illuminated by sunlight by connecting photovoltaic cells in series and parallel. This DC electricity is subsequently converted into alternating current (AC) via an inverter and then supplied to the utility grid.
On the AC side, photovoltaic systems only generate active power under normal operating conditions and do not produce reactive power. However, during a system fault or voltage drop, photovoltaic systems switch to a low-voltage ride-through (LVRT) mode. In order to sustain voltage levels, the photovoltaic system injects reactive power into the system in this mode. Once the voltage reaches a specific threshold, the photovoltaic system exits the LVTR mode and ceases reactive power generation. The active and reactive power output curves of the photovoltaic model used in this study during the fault period are simulated using the Power System Department-Bonneville Power Administration (PSD-BPA) simulation platform, as illustrated in Figures 3 and 4.
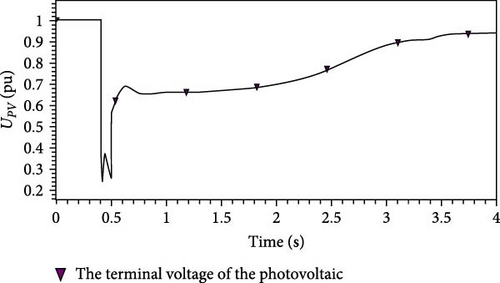
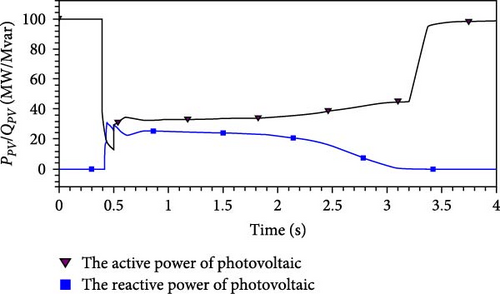
From Figures 3 and 4, it is evident that before the system fault (0.4 s), the photovoltaic system only supplies active power. However, during the low-voltage period following the fault, the photovoltaic system simultaneously supplies both active and reactive power to the grid. This model can be effectively represented by a parallel combination of negative resistance RPV and negative reactance XPV in the model. Once the photovoltaic terminal voltage recovers to a certain level, the photovoltaic system resumes normal operation.
By combining Equations (5) and (6), we can derive the transient equivalent model of the photovoltaic system.
3. Discriminant Index of Transient Voltage Stability
3.1. Establishing the Equivalent Circuit for a Virtual IM and Solving for Unstable Slip
Based on the equivalent circuit in Figure 2, the circuit excluding the rotor resistance and rotor reactance is simplified using the Thevenin equivalent circuit, resulting in the establishment of a virtual equivalent circuit for the IM, as shown in Figure 5.
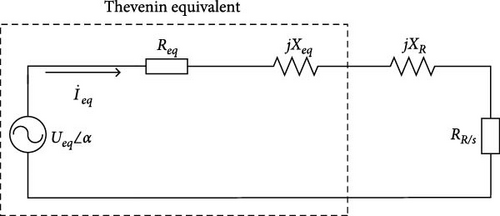
In the diagram, Req + jXeq represents the Thevenin equivalent impedance of the virtual IM, while Ueq∠α and represent the Thevenin equivalent voltage source and equivalent current of the virtual IM, respectively.
By combining Equations (7), (11), and (12), we can obtain two slip values. The smaller slip represents the steady-state operation of the IM after the fault, while the larger slip represents the unstable slip, denoted as su.
3.2. The Relationship Between Unstable Slip and Fault Clearing Time
In studies on transient voltage stability in power systems, the fault-clearing time is commonly used as a criterion for assessing the stability of transient voltages [14]. Generally, a shorter fault-clearing time indicates better TVS in the system.
Based on the equation mentioned above, it is possible to ascertain that the fault limit removal time represents the duration needed for the slip of the IM to transition from the initial stable slip s0 to the unstable slip su.
According to the mathematical relationship between the unstable slip of the IM and the fault limit removal time, it can be inferred that the changes in the unstable slip of the IM reflect the variations in the fault limit removal time. This, in turn, indicates the changes in TVS.
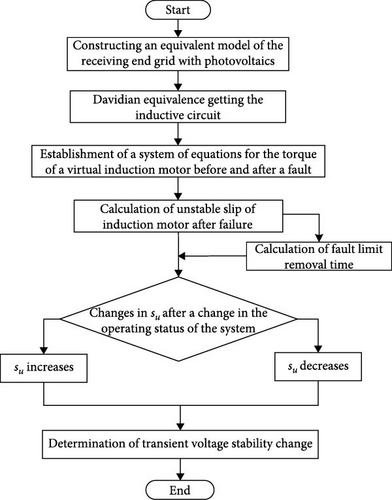
In conclusion, the process for assessing the TVS of the receiving end grid with photovoltaics is shown in Figure 6.
4. Example Analysis
According to the equivalent model in Figure 1, the infinity power supply with load simulation model is built based on the PSD-BPA simulation platform, as shown in Figure 7.

The infinite bus source voltage is set as ES∠δ = 1, with the voltage of the three-phase transmission line 1 set at 220 kV, and the voltage of the load bus (bus 3) set at 110 kV. The base voltage is considered the average voltage. On the receiving end, there are four photovoltaic units, each with a capacity of 100 MVA, connected to the load bus through a 110 kV double-circuit transmission line 2.
The load model at the receiving end consists of a combination of 60% IM load and 40% impedance load. The model parameters used in the project for the transformer, line, and IM are specified in Tables 1 and 2, respectively.
| Symbols | Per unit (pu) |
|---|---|
| XL1 | 0.02 |
| XL2 | 0.01 |
| XT1 | 0.006 |
| XT2 | 0.0225 |
| XT3 | 0.05 |
Photovoltaic output (MW) |
Load (MW) |
CCT (s) |
su Simulation value |
su Calculated value |
Error (%) |
|---|---|---|---|---|---|
| 0 | 500 | 0.3240 | 0.0982 | 0.1017 | 3.44 |
| 100 | 600 | 0.2560 | 0.0836 | 0.0883 | 5.32 |
| 200 | 700 | 0.2080 | 0.0727 | 0.0776 | 6.31 |
| 300 | 800 | 0.1764 | 0.0642 | 0.0672 | 4.46 |
| 400 | 900 | 0.1568 | 0.0578 | 0.0608 | 4.93 |
In the simulation, the fault is uniformly set as a single-phase-to-ground short circuit fault on the 220 kV transmission line 1 at 20 cycles (0.1 s).
In the stable results SWX file generated by PSD-BPA, simulated data for active power PPV, reactive power QPV, and terminal voltage UPV of the photovoltaic system are obtained at specific time points. These simulation data are subsequently imported into the CurveFitter software for curve fitting of the PPV, UPV, and QPV curves. In this process, power is considered the dependent variable, while voltage serves as the independent variable.
When the voltage drop is mild, the photovoltaic unit can be regarded as a constant power source. However, when the voltage drop becomes severe, it can be considered as a constant current source [20]. During the transient period, the photovoltaic system exhibits either constant current or constant power behavior. Consequently, when analyzing the QPV, UPV data, it is appropriate to fit a first-order function using CurveFitter.
Based on Equation (19), it is evident that the reactive power output during the transient period of the photovoltaic system follows a quadratic function with respect to UPV. Hence, when dealing with the QPV, UPV data, a quadratic function is fitted using CurveFitter.
All variables in the equation are expressed in per-unit values, where the reference voltage is the average voltage, and the reference capacity is set to 100 MVA. Based on Equation (20), it can be deduced that the photovoltaic active power output equals a constant current source.
By setting the left side of Equation (21) to zero for the reactive power, we obtain two values for UPV: 0 and 35/39. When the terminal voltage is 0, the photovoltaic reactive power QPV = 0 corresponds to the actual situation. In PSD-BPA, the terminal voltage for photovoltaic systems to enter or exit the LVRT state is set to 0.9 pu, which means that the photovoltaic voltage should not be below 0.9 pu for the reactive power output to be zero. This condition, referred to as QPV = 35/39 ≈ 0.9, is similar to Equation (19) and fulfills the technical requirements mentioned above. Hence, Equation (21) effectively represents the characteristics of photovoltaic transient reactive power output.
The system model parameters are set in MATLAB, and the balance equations for mechanical and electromagnetic torque of the virtual IM after a fault are simultaneously used to solve Kirchhoff’s voltage equation [21]. The equations are solved using the vpasolve function available in MATLAB software, with a computation time of approximately 3–4 s. The obtained results for su are then compared with the simulation results from PSD-BPA [22].
4.1. Unstable Slip in IMs Under Varying Photovoltaic Output Power
Considering the changes in the actual photovoltaic output of the power grid, the active power of the photovoltaic system on the receiving side ranges from 0 to 400 MW. The influence of the photovoltaic access receiver on the slip of the IM and the TVS of the system is studied through two perspectives: fault limit cutting time and receiving load limit.
4.1.1. The Transmission Power Remains Constant
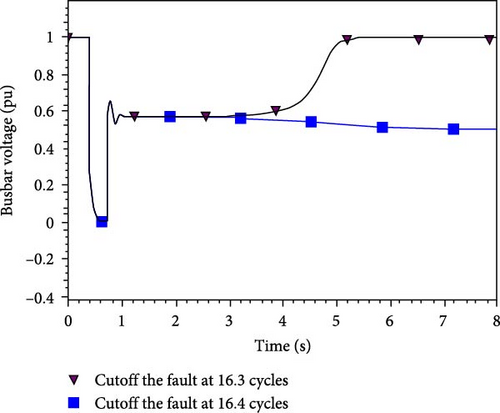
To maintain a constant transmission power of 500 MW on the transmission line, both the photovoltaic output and the load need to be increased proportionally. The fault limit removal time can be determined by gradually adjusting the fault removal time. For instance, when the photovoltaic output is 0, the fault removal time is 16.3 cycles (0.326 s), and the load bus voltage can recover after a fault. However, if the fault removal time is set to 16.4 cycles (0.328 s), the load bus voltage will not recover after a fault. Figure 8 illustrates the scenario.
The slip variation of the IM corresponding to the fault cutting time is shown in Figure 9.
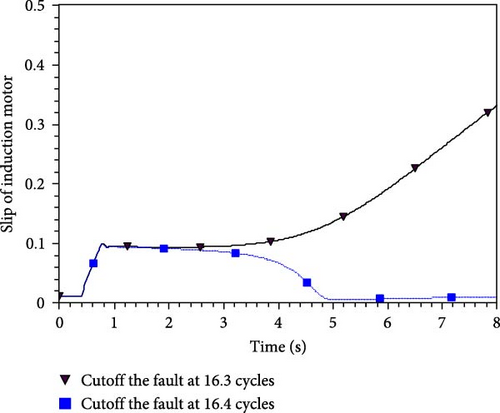
As depicted in Figure 9, when the system eliminates the fault at 16.3 cycles, the slip of the IM can successfully recover and stabilize. However, if the fault is removed at 16.4 cycles, the motor’s slip gradually increases until it reaches the point of stalling. Figure 10 illustrates the variation in the IM’s slip under five different operating conditions.
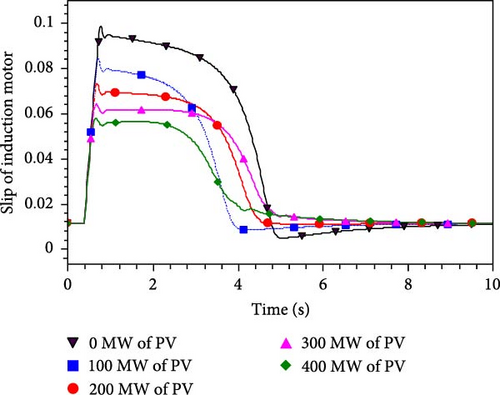
Based on Figure 10, it is evident that with an increase in photovoltaic output, the fluctuation of the slip of the IM following a fault becomes more pronounced. However, eventually, it returns to the vicinity of the initial slip value, indicating the restoration of steady-state motor operation. The unstable slip values of the IM, obtained from the graph, are compared with the corresponding theoretical calculated values in Table 2.
Based on the information presented in Table 2, it is evident that when the transmission power of the transmission line remains constant, an increase in the photovoltaic output at the receiving end results in a reduction in the system’s fault limit removal time. As a result, there is a smaller fluctuation in the unstable slip of the corresponding IM.
A shorter fault removal time indicates a decrease in the TVS of the system, implying that with an increase in photovoltaic output, the TVS at the receiving end deteriorates.
4.1.2. The Fault Removal Time Remains Constant
By maintaining a constant fault removal time and considering the actual engineering conditions, the fault removal time is set to five cycles (0.1 s). The load at the receiving end is gradually adjusted to determine the maximum load that ensures stable system voltage. At this specific load, the variation of the slip of the IM is shown in Figure 11.
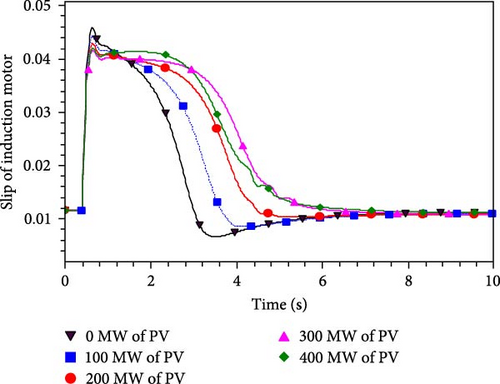
As depicted in Figure 11, when the fault removal time is maintained at a constant value, an increase in the photovoltaic output leads to smaller fluctuations in slip and a slower recovery speed of the IM. The unstable slip values of the motor, extracted from Figure 11, are compared with the corresponding theoretical calculated values in Table 3.
Photovoltaic output (MW) |
Load limit(MW) | su Simulation value |
su Calculated value |
Error (%) |
|---|---|---|---|---|
| 0 | 755 | 0.0457 | 0.0472 | 3.18 |
| 100 | 821 | 0.0442 | 0.0461 | 4.12 |
| 200 | 891 | 0.0429 | 0.0448 | 4.24 |
| 300 | 962 | 0.0415 | 0.0436 | 4.81 |
| 400 | 1033 | 0.0403 | 0.0419 | 3.82 |
Based on the information provided in Table 3, it is apparent that with the same fault removal time, an increase in the photovoltaic output results in a higher load limit at the receiving end while reducing the unstable slip of the IM. For every 100 MW increment in photovoltaic output, the load limit at the receiving end increases by approximately 70 MW, whereas the power limit of the transmission line decreases by around 30 MW. This reduction in the transmission power limit indicates a weakening of the receiving end grid, consequently leading to diminished transient voltage stability.
In conclusion, from both the standpoint of fault limit removal time and the perspective of the receiving end load limit, an increase in photovoltaic output results in a decline in the transient voltage stability of the system. This decrease in stability corresponds to a gradual reduction in the unstable slip of the IM.
4.2. Unstable Slip Variations of the IM Under Different Load Ratios
Taking into account the varying load ratios of IMs in different regions of the actual power grid, we consider three operating conditions: 50% IM +50% constant impedance, 60% IM +40% constant impedance, and 70% IM +30% constant impedance. The fault CCT is set at five cycles (0.1 s), with a photovoltaic output of 200 MW and a receiving end load of 700 MW. Under these three operating conditions, we gradually adjust the fault CCT to obtain the TVS state of the IM slip curve, as depicted in the accompanying Figure 12.
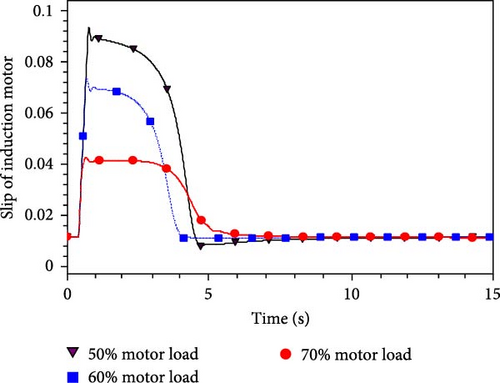
The graph clearly shows the significant effect of the load ratio of the IM on its slip. The post-fault slip variation becomes more pronounced as the motor load ratio increases. Notably, when the motor load ratio reaches 70%, the recovery speed of the slip after a fault is significantly sluggish. For comprehensive reference, please refer to Table 4 for the summarized values of the fault limit CCT, unstable slip simulation, and calculated values across various operating conditions.
| Load ratio of the motor (%) | CCT (s) | su Simulation value |
su Calculated value |
Error (%) |
|---|---|---|---|---|
| 50 | 0.3060 | 0.0934 | 0.0969 | 3.75 |
| 60 | 0.2080 | 0.0737 | 0.0768 | 4.24 |
| 70 | 0.1000 | 0.0426 | 0.0445 | 4.28 |
Based on the data presented in Table 4, it can be observed that as the load ratio of the IM increases, the fault limit CCT decreases, leading to a reduction in the unstable slip of the IM and the transient voltage stability of the system deteriorates.
4.3. Unstable Slip of IMs Under Different Transmission Line Reactance
Considering various system coupling reactances, simulations were conducted with a photovoltaic output of 100 MW and a receiving end load of 700 MW. The receiving end load model comprises 60% IM and 40% constant impedance. In three different scenarios with transmission line 1 reactance normalized values XL1 of 0.020, 0.025, and 0.030, respectively, the fault CCT was systematically adjusted. The resulting curve illustrates the variation in motor slip under the voltage limit, as shown in Figure 13.
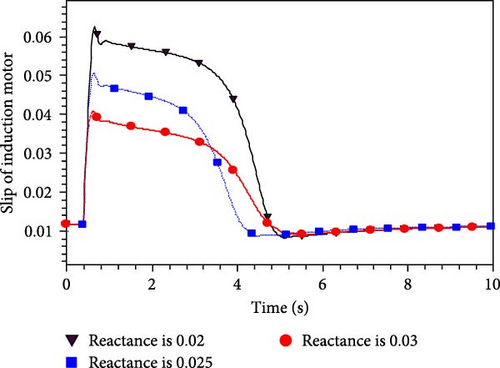
According to the findings from Figure 13, it is evident that the fluctuation in transmission line reactance plays a crucial role in determining the slip. Specifically, an increase in transmission line reactance leads to a significant rise in the variability of post-fault slip. For comprehensive details on the unstable slip of the motor and the fault limit CCT, please refer to Table 5.
| Transmission reactance (pu) | CCT (s) | su Simulation value |
su Calculated value |
Error (%) |
|---|---|---|---|---|
| 0.020 | 0.1606 | 0.0624 | 0.0656 | 4.88 |
| 0.025 | 0.1174 | 0.0503 | 0.0533 | 5.62 |
| 0.030 | 0.0870 | 0.0405 | 0.0431 | 6.03 |
Based on the data presented in Table 5, it is evident that an increase in transmission line reactance leads to a decrease in the fault limit CCT. Consequently, the unstable slip of the IM also decreases, resulting in a deteriorated TVS of the system. After analyzing the aforementioned simulation results, it indicates that an increase in the output of the photovoltaic system at the receiving end, the ratio of the IM load, and the system’s interconnection impedance leads to a decrease in the unstable slip of the IM. Consequently, the fault limit CCT is reduced, and the TVS of the system is compromised. The disparity between the calculated and simulated values of the IM’s slip is primarily attributed to two factors. First, it stems from the fitting error in approximating the photovoltaic power–voltage curve. Second, it arises from the limitations in accurately reading values due to the experimental simulation time step.
4.4. Using Unstable Slip to Calculate the Fault Limit CCT
By using the calculated values of the unstable slip of the IM from Table 2 and substituting them into Equation (17), the fault limit CCT is computed. The obtained results are then compared with the simulated values in Table 2, and the results are shown in Table 6.
| Operating condition | CCT simulation value (s) | CCT calculated value (s) | Error (%) |
|---|---|---|---|
| Photovoltaic 0 MW | 0.3240 | 0.3312 | 2.17 |
| Photovoltaic 100 MW | 0.2560 | 0.2593 | 1.27 |
| Photovoltaic 200 MW | 0.2080 | 0.2179 | 4.54 |
| Photovoltaic 300 MW | 0.1764 | 0.1862 | 5.26 |
| Photovoltaic 400 MW | 0.1568 | 0.1626 | 3.57 |
Based on the information presented in Table 6, it is evident that with an increase in the photovoltaic output, both the calculated and simulated values of the fault limit CCT also show an upward trend. The disparity between these values can be attributed to the error arising from the calculation of the unstable slip, as well as the time required for the IM to restore its terminal voltage after fault clearance. During this recovery period, the motor initially decelerates and then accelerates, resulting in a slightly overestimated calculated fault limit CCT.
4.5. Comparison of Fault CCT Calculation Methods
To validate the superiority of the proposed fault CCT calculation method in this paper, a comparison was conducted using a 100 MW photovoltaic system as an example. The performance of commonly used methods such as equal area criterion (EAC), Lyapunov, energy margin (EM), and the proposed unstable slip calculation (USC) method in various indicators is presented in Table 7.
| Calculation methods | Calculation time | Calculation error (%) |
|---|---|---|
| EAC | 0.4208 | 2.96 |
| EM | 0.5882 | 2.15 |
| Lyapunov | 0.3372 | 5.52 |
| Prososed USC | 0.2560 | 1.27 |
- Note: The bold values indicate the proposed USC method performs the shortest calculation time and generates an accurate transient simulation.
Based on the experimental results, it is evident that the EAC method offers a relatively simple and intuitive calculation, making it suitable for quickly assessing the transient stability of a system. However, this method has certain limitations when dealing with complex systems. The Lyapunov method can provide relatively accurate results and is suitable for situations requiring high system stability, but it requires a longer calculation time and is not suitable for applications with high real-time requirements. The EM method is suitable for rapidly assessing system stability, particularly demonstrating certain advantages in large-scale systems. However, this method may exhibit a higher level of error and is not suitable for systems requiring high stability. Overall, the proposed calculation method in this paper can significantly reduce the calculation time while ensuring accuracy, making it suitable for online transient stability assessment requirements.
5. Conclusion
- 1.
Based on the characteristic of unchanged infinite source potential before and after faults, this method constructs a virtual equivalent circuit for the IM to calculate the unstable slip. It converts the fluctuation in the motor terminal voltage during the transient process following faults into a variation in the IM’s virtual equivalent impedance. This approach eliminates the need to solve a complex differential-algebraic equation system that describes the transient process of the IM using simulation software. It also eliminates the need for repeatedly adjusting the receiving-end load or fault CCT to reach the transient stable limit state of the system. It directly and quickly obtains the transient voltage stability results by solving algebraic equations. This simplifies the analysis process and enables rapid assessment of TVS in receiving-end systems with photovoltaic integration.
- 2.
Based on the mathematical relationship between the unstable slip of the IM and the fault CCT, and supported by simulation results, it is evident that the changes in the unstable slip can serve as an effective indicator of the variations in TVS within the system.
- 3.
The transient power output function of photovoltaic integration, derived from the P–U and Q–U curves, conforms to the LVRT characteristic for photovoltaic systems. Furthermore, based on the function’s expression, the transient model of photovoltaic integration in the equivalent model of the receiving-end grid is represented as a parallel combination of negative resistance and negative reactance, which dynamically varies with the terminal voltage. Ultimately, the effectiveness of this photovoltaic modeling approach is validated by its capability to accurately evaluate the TVS of the system through the calculated changes in the unstable slip value.
- 4.
The simulation findings suggest that an increase in the photovoltaic integration output at the receiving end, the load proportion on the IM, and the reactance of the transmission lines all contribute to a decrease in the unstable slip of the IM, and the TVS of the system deteriorates.
Conflicts of Interest
The authors declare no conflicts of interest.
Funding
This research was funded by the Science and Technology Project of State Grid Shanxi Electric Power Co., Ltd. (project no. 52053023000B).
Acknowledgments
The authors acknowledge the support of the Taiyuan University of Technology, State Grid Shanxi Electric Power Research Institute, and the State Grid Shanxi Electric Power Company.
Open Research
Data Availability Statement
Data supporting this study are included within the article.


