Numerical Evaluation and Artificial Neural Network (ANN) Model of the Photovoltaic Thermal (PVT) System with Different Nanofluids
Abstract
The present study investigates the performance of photovoltaic thermal (PVT) systems that employ silver, aluminum oxide, copper, and titanium dioxide nanoparticles with distilled water as a solvent. The volume portions of the nanoparticles considered are 2% and 5% by weight. The study employs an energy balance equation to encompass circular geometries for fluid flow channels and a flow velocity ranging from 1 × 10⁻⁴ to 3 × 10⁻⁴ m/s. A numerical model has been established to investigate the performance of the photovoltaic thermal system and obtained the highest performance in Cu/water nanofluid for a uniform mass flow rate of 0.0670 kg/s and volume portion of 5% compared to other nanofluids, and the average electrical, thermal, and overall performance achieved is 15.8%, 30.2%, and 45.3%, respectively. Moreover, an artificial neural network (ANN) was developed to predict the electrical and thermal efficiency of the PVT system, and the mean absolute percentage error (MAPE) between array error of the thermal and electrical efficiency of the system is 4.98% and 2.61%, respectively. This value shows the strong validation of the numerical and ANN simulation values.
1. Introduction
Sun energy is an environment-friendly source that mitigates greenhouse gas emissions [1]. Sun energy can be converted into electrical and thermal energy through PV panels and thermal collectors. The photovoltaic panel converts only a small amount of incoming sun radiation to beneficial electrical energy, and the rest of the energy accumulates onto the panels in the form of heat. This leads to an increase in the working temperature of the photovoltaic panel and, thus, a decrease in electrical efficiency [2]. Therefore, effective dissipation of this additional heat from the solar panel is crucial to enhancing PV panel performance for extracting the additional heat on the PV panel circulating the cooling fluid in the gaseous or liquid state through a flow channel underneath the PV cell. The cooling fluid absorbs excessive heat and maintains the relatively lower temperature of the photovoltaic cell. A hybrid technique, a photovoltaic thermal (PVT) system, produces electrical and heat energies [3, 4]. Numerous design considerations influence the performance of PVT systems, including factors such as mass transfer rate, number of glass covers, diameter and thickness of the absorbing tube, thermal conductivity of coolant, and design of the absorber channel [5, 6]. Researchers have conducted various studies to improve the performance of PVT systems. In the initial stages, the work focused on air and water cooling systems. In contemporary times, nanofluid cooling has gained prominence as a result of its better thermophysical characteristics compared to those of air and water. They increase the thermal properties of the base fluid by enhancing the system’s overall effectiveness [3]. Nanofluids are formulated by dispersing solid particles of nanometric dimensions into a primary solvent [7]. Consequently, there has been different research on the impact of nanofluids, volume concentration, and fluid flow methods in PVT collectors.
Sardarabadi et al. [8] examined the impact of pure water and SiO2/w nanofluid in a volume portion of 1% and 3% by weight in PVT collectors for energy and exergy analysis. They found that total exergy improved by 7.9% for the 3% mass fraction by weight, compared to PVT nanofluids to the PVT collector with pure water. Ghadiri et al. [9] experimentally examined the performance of a PVT collector, using distilled water and ferro liquid (Fe3O4/w) as a coolant in the volume portion of 1% and 3%, respectively; they concluded that the 3% volume portion coolant improves the total performance by 45%. Another study [10] evaluated the electrical and thermal performance of the PVT system at 12.75% and 85%, respectively, by influencing the SiC/w nanofluid at a mass transfer rate of 0.167 kg/sec. Hasan et al. [11] compared silicon carbide (SiC) and metal oxide-based nanofluids on PVT collectors with rectangular channels. They observed that SiC nanofluid PVT systems have the highest electrical efficiency and total efficiency of 13.52 and 81.73%, respectively. Another study [12] compared the thermophysical properties of Al2O3/w, CuO/w, and SiC/w nanofluids in different volume portions for use in PVT systems as coolant and concluded that silicon carbide has the best stability and maximum thermal conductivity compared to other nanofluids.
Alous et al. [13] experimentally evaluated the performance in terms of energetic and exergetic viewpoints using MWCNT/w and graphene nanoplatelets at a volume portion of 0.5 wt% and pure water at a mass transfer rate of 0.5 L/m. They obtained an exergetic efficiency of 11.2%, 12.1%, and 20.6% for PVT collectors cooled by distilled water, MWCNT/w nanofluid, and graphene nanoplatelets/w nanofluid, respectively, with similarly energetic efficiency of 53.4%, 57.2%, and 63.61%, respectively. Jia et al. [14] numerically investigated the effects of Al2O3/w and TiO2/w nanofluids with a variation of volume portion 3% and 6% and mass flow rate (0.0005 kg/s, 0.001 kg/s, 0.01 kg/s, and 0.03 kg/s) on the performance parameters likely of PV cell temperature, outlet temperature, and thermal and electrical efficiency of the PVT collector and concluded that the Al2O3/w nanofluid is more efficient than TiO2/w nanofluid at higher mass flow rate and volume portion. Another study [15] numerically compared the energy and exergy of the PVT system with wavy tubes with a variation in wavelength and straight tube absorber channel design using pure water, Ag/w nanofluid, and microencapsulated phase change material slurry as coolant and found the maximum energy and exergy in the microencapsulated phase change material nanoslurry with the flow channel of wavy tubes compared to other fluids and straight tubes.
Gangadevi et al. [16] conducted the experimental study of a spiral flow composite PV collector with CuO/w nanofluids in different volume portions (0.1%, 0.2%, and 0.05%) and examined the performance of the PV collector for different cases. Similarly [17], experimentally and numerically compared to the use of water and CuO nanofluid in semitransparent photovoltaic thermal hybrid collectors, the usual drop in solar panel temperatures was 9 and 12°C, respectively. Compared to conventional photovoltaic modules, the electrical efficiency of SPV-THC increased by 11.2% and 5.9% when using CuO nanofluid and water, respectively. Another study [18] performed an experimental and numerical study to examine the effectiveness of a PVT system with a serpentine tube employing nanofluids of Fe3O4/w, SiO2/w, and Fe3O4/SiO2 in volume portions of 3% wt at various flow rates of 20, 30, and 40 LPM. Compared to standard PV systems, the most significant achievable gain in electricity efficiency is 12.6%, 18.46%, and 24.3%, respectively. Madas et al. [19] examine the TRNSYS-based numerical equation for the investigation of PVT systems using nanocopper oxide (CuO) in volume portions between 0.10 to 0.50% and mass transfer at 60, 80, and 120 kg/h. The findings indicate that at a 60 kg/h transfer rate, electrical and thermal performance is improved by 1.11 and 3.30%.
On the other hand, numerous academics have implemented artificial neural networks (ANN) to forecast the effectiveness of PVT systems. ANN is an algorithm-based tool used to predict the system’s performance; the operation of the ANN model is divided into experimental, numerical models, regression, network-based artificial intelligence, and statistical models using time series data [20].
Zamen et al. [21] optimized the performance of the PVT system using artificial intelligence methods in this study. They performed different approaches, least squares support vector machine (LSSVM), and adaptive neuro-fuzzy inference system (ANFIS) and predicted the thermal performance of the PVT system using different working parameters such as ambient temperature, mass transfer rate, and sun irradiation. Another study [22] maximized the energy and exergy outputs for the PVT system using coolant as a nanofluid by applying the adaptive neuro-fuzzy inference system for influential parameters. Büyükalaca et al. [23] conducted a numerical investigation and artificial neural networks to analyze operating parameters and determined the performance of hBN-w nanofluid PVT collectors.
The literature mentioned above shows that the performance of PVT systems can be enhanced by using nanofluids as coolant. The current study evaluates the performance parameters of the PVT system using different nanofluids (Ag/w, Al2O3/w, Cu/w, and TiO2/w nanofluids) at the volume portion of nanoparticles of 2% and 5% with water by weight with a variation of the mass flow rate of the nanofluids.
2. Methodology
An energy balance equation has been used for a numerical model that has been built to investigate the performance of the PVT system employing nanofluids as a coolant at a volume portion of 2% and 5% of the nanoparticles with water, and the ANN model is also developed to forecast the system’s electrical and thermal performance.
2.1. Design and Description of the System
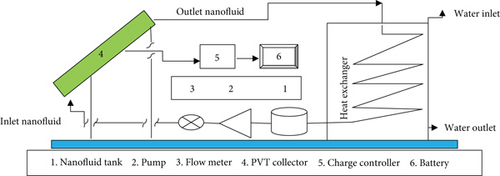
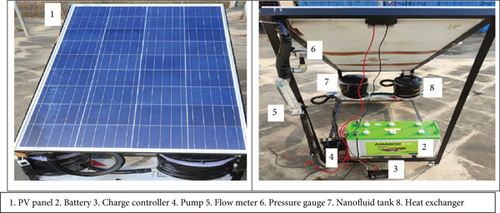
Figures 1(a) and 1(b) show the schematic view and experimental setup of a circular tube-type photovoltaic thermal collector designed and developed in a solar energy lab. It consists of a photovoltaic cell, a heat-absorbing plate attached to the rear side of the photovoltaic cell through an adhesive layer of ethylene vinyl acetate (EVA), and a fluid flowing inside the tube attached to the rear side of the absorber plate. The energy is transferred through nanofluid flow in a tube. The nanofluid transfers the heat of the heat exchanger. The insulation material covers the corners of the collector and reduces the heat that escapes through the bottom of the surface [24].
2.2. Heat Balance Equation for the PVT System
- (1)
Heat transfer is presumed to be one-dimensional
- (2)
The thermophysical characteristics of the nanofluids are independent of the temperature
- (3)
Each component of the PVT system should be perfectly insulated
- (4)
The optical properties of the material remain constant
- (5)
The fluid flow inside the tubes is uniform
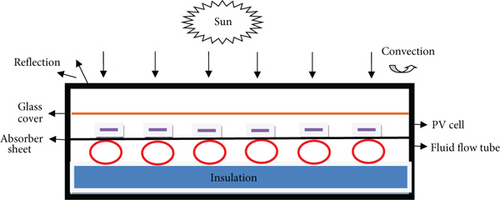

Taking into account these presumptions, the heat balance equation governs the heat flow between different layers of the PVT system.
2.2.1. Energy Balance Equation for the PV Panel
2.2.2. Energy Balance for Absorbing Sheet
2.2.3. Energy Balance for Flowing Fluid inside the Channel
2.3. Effective Parameters of the PVT System
2.4. Pumping Power and Pressure Drop
2.5. Exergy of the Photovoltaic Thermal System
2.6. Heat Transfer Coefficients for Different Components
2.7. Thermophysical Properties of Nanofluid
In this current study, four different nanoparticles, namely, Ag, Al2O3, Cu, and TiO2, were used to evaluate the thermophysical properties of nanofluids at a volume of 2% and 5%, with pure water considered a base fluid. It is shown in Table 1.
| Components | Ø (%) | ρ (kg/m3) | C_p (J/kgK) | k (W/mK) | |
|---|---|---|---|---|---|
| Ag/w | 2% | 1187 | 3488 | 1.061198 | Calculated |
| Ag/w | 5% | 1473.29 | 2775 | 1.157825 | Calculated |
| Al2O3/w | 2% | 1057.63 | 3925.47 | 1.06095 | Calculated |
| Al2O3/w | 5% | 1146.79 | 3590.54 | 1.157149 | Calculated |
| Cu/w | 2% | 1156.81 | 3605.16 | 1.061196 | Calculated |
| Cu/w | 5% | 1394.94 | 2966.22 | 1.157820 | Calculated |
| TiO2/w | 2% | 1063.236 | 3678.46 | 1.05998 | Calculated |
| TiO2/w | 5% | 1160.79 | 3542.04 | 1.15460 | Calculated |
Figure 2(b) shows the process of making of nanofluids, and equations ((22)), ((23)), and ((25)) calculate the nanofluids’ characteristics using different nanoparticles displayed in Table 2.
3. Simulation of the ANN Model
Artificial neural networks (ANN), a deep learning method influenced by biological neural networks viewed in the human brain, are algorithms that mimic brain function and are used to analyze complicated structures and predict problems [35]. Different major functions of ANN are linear (f (x) = x), sigmoid (f (x) = 1/(1 + e−x)), and hyperbolic tangent (f (x) = (ex − e−x)/(ex − e−x)) [21]. A neural network can be trained to identify structures, classify data, and predict future event [36]. The application of neural systems has different areas, such as science, design, etymology, and geodata. These ANN networks draw an association between neurons over layers (input, hidden, and output). ANN method is classified into two major categories by the learning methods: supervised and unsupervised [37, 38].
3.1. Multilayer Perceptron (MLP)
MLP is a learning method used for prediction and segmentation tasks. Multilayered neurons with input, hidden, and output layers make up the MLP structure. The MLP network is used to analyze the data and predict the output. The backpropagation method computes the errors through the network and allows variation of the hidden layer weights, which is evaluated by the equation ei = di(n) − yi(n) where di is the desired data set, and yi is the computed data value [39]. In this study, 200 data sets are used to create MLP, as displayed in Figure 3. The data was classified into three groups: 80% for training, 15% for cross-validation, and 5% for testing, to predict the thermal and electrical efficiency of the PVT system using the neural network tool in MATLAB R-2020.

3.2. Models’ Evaluation
For evaluation of the ANN model, use the Levenberg–Marquardt (LM) algorithm, which is a type of backpropagation algorithm [40]. And mean square error (MSE) was used for the trained network and predicted the electrical and thermal performance of the PVT system.
For this purpose, five input variable parameters, such as sun irradiance, atmospheric temperature, time, mass flow rate, relative humidity, and numerically calculated thermal and electrical performance, are considered target values. Different methods can carry out the precision and reliability of the prediction of neural calculation results. The R2 is one of the methods used to validate the predictive results compared to the results of the real model. R2 is calculated according to the equation where y is the numerical value, yi and fi are the predicted value of y, and is the mean of the numerical values. N is the number of values. Nevertheless, in some conditions, R2 is not sufficient to confirm the validity of the results obtained, especially when using time series analysis. Therefore, other methods such as the “Mean Absolute Percentage Error (MAPE),” “Root Mean Square Error (RMSE),” “Mean Absolute Error (MAE),” and “Mean Square Error (MSE)” are applied to verify the validity of the predicted results [23, 41].
3.3. Mean Absolute Percentage Error (MAPE)
MAPE is the percentage-dependent metric that is most frequently utilized for validating the outcome of the system [42] and is evaluated by the , which calculates the average of the percentage error. It is a measure of prediction accuracy. The MAPE is also abbreviated as MAPD (“D” for “deviation”). The MAPE is used as the loss function for regression models in machine learning since it is very intuitive in explaining the relative error. The range of MAPE is (0%, +∞); the smaller the value of MAPE, the better the accuracy of the prediction model. 0% indicates that the prediction model is perfect. The perfect value of MAPE is more significant than 100%, and this indicates that the prediction model is inferior [42].
4. Numerical Procedure
- (i)
Initialize various PVT collector components’ geometric, thermal, and optical characteristics
- (ii)
Consider the sun’s radiation, wind velocity, ambient temperature, and nanofluid’s initial temperature
- (iii)
Evaluate the numerical equation and obtain the performance parameters of the PVT system
- (iv)
Perform the ANN model to predict the thermal and electrical efficiency and find the MAPE error between the numerical and ANN models
| Specification | Solar panel | Pmax | Voc (V) | Isc (A) | Vmax (V) | Imax (A) | ƞs (%) | Temperature range | Cell type | Cell packing factor |
|---|---|---|---|---|---|---|---|---|---|---|
| Value | 330 W | 330 W | 46.4 | 9.14 | 38.6 | 8.56 | 17.01 | -40°C to 85°C | Polycrystalline | 0.8 |
| Components | Parameters | Value | Unit |
|---|---|---|---|
| Glass cover | Thickness, heat conductivity | 0.007, 0.8 | m, W/mk |
| Transmissivity, absorptivity | 0.95, 0.04 | ||
| PV panel | Heat conductivity | 100 | W/mk |
| Absorptance | 0.89 | ||
| Module efficiency and temp. coefficient | 17%, 0.0045 | 1/K | |
| Absorber | Thickness, rate of heat transfer | 5 × 10⁻⁴, 380 | m, W/mk |
| Tube | The inner diameter of a circular tube | 0.013 | m |
| Thickness, total length, and tube spacing | 0.002, 3, 0.1 | m | |
| Insulation layer | Thickness, heat conductivity | 0.07, 0.029 | m, W/mk |
| Coolant fluid | The inlet temperature of the coolant | 300 | K |
| Atmospheric parameters | Average velocity of air, slope angle | 1.6, 32° | m/s |
| Ambient temperature and sun radiation | |||
5. Results and Discussion
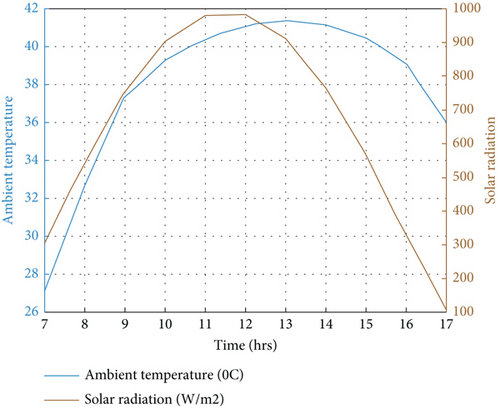
In this work, the performance of PVT collectors employing nanofluids is assessed in volume portions 2% and 5% as a coolant using a circular tube to flow the fluid at different flow velocities and mass flow rates. The hourly sun rays and atmospheric temperature are shown in Figure 4. The sun radiation and atmospheric temperature increase from morning to 12:00 am and decrease from noon to 4:00 pm. The maximum value of sun radiation and atmospheric temperature is achieved at 12:00 am, which is 986.33 W/m2 and 40.44°C, respectively.
5.1. PVT Collector Outlet Temperature of Nanofluids
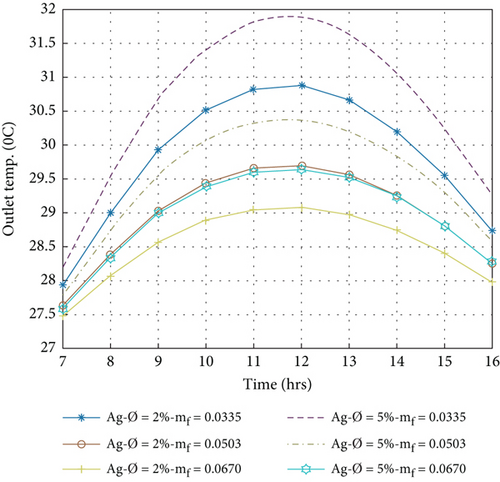
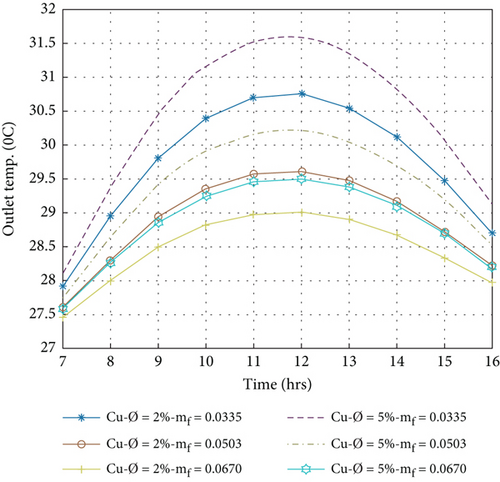
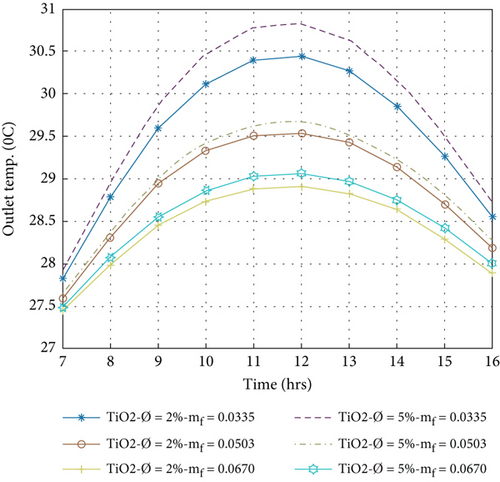
The outlet temperature of the PVT collector depends on the ambient temperature; therefore, raising the ambient temperature outlet temperature of nanofluids increased [44]. Equation (9) is used to calculate the outlet temperature of nanofluids Ag/w, Al2O3/w, Cu/w, and TiO2/w in the volume portion of the nanoparticle 2% and 5% with a variation of a mass flow rate of 0.0335 kg/s to 0.0670 kg/s. Figures 5(a)–5(d) display the hourly variation of the outlet temperature. The outlet temperature increases from morning to 12:00 am. Then, it decreases from 12:00 am to 16:00 pm. The maximum temperature rise is achieved at 12:00 am. It is observed that the outlet temperature decreases with increasing the mass flow rate because the outlet temperature of the nanofluid PVT collector is inversely proportional to the mass flow rate by equation (9). However, when the volume portion of the nanoparticle is 5%, the thermophysical property changes, as shown in Table 1. The nanofluids slightly change the outlet temperature due to different thermophysical properties. The exit temperature increases with increasing volume portions because the specific heat decreases and the rate of heat conductivity increases. The higher outlet temperature achieved in the volume portion of the nanoparticle that is 5% in the mass flow rate of 0.0335 kg/s per day for Ag/w, Al2O3/w, Cu/w, and TiO2/w is 31.89, 30.78, 31.61, and 30.83°C, respectively, and a lower outlet temperature that is achieved in the volume portion of the nanoparticle 2% in a mass flow rate of 0.067 kg/s is 29.08, 28.85, 29.02, and 28.92°C, respectively.
5.2. Cell Temperature of PVT Collector
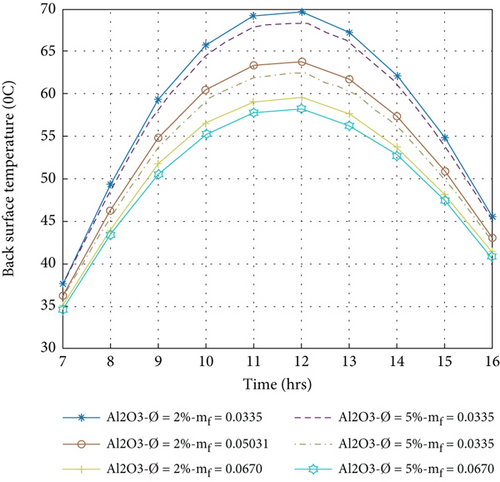
Figures 6(a)–6(d) show the hourly variation of the cell temperature evaluated by Equation (3) with different nanofluids at a volume portion of nanoparticles that is 2% and 5% for circular tube fluid flow with a variation of mass flow rate between 0.0335 kg/s and 0.0670 kg/s. It has been observed that the cell temperature increases from morning to 1200 am, reaches the maximum temperature, and then decreases from 12:00 am to 4:00 pm. It is also noted that the cell temperature decreases with increasing mass flow rate because it is related to the back surface temperature and the outlet temperature of the nanofluids by Equations (6) and (9). On the other hand, when the volume portion is increased, thermophysical properties are affected. A high volume portion of nanofluids increases the heat transmission rate, as shown in Table 1.
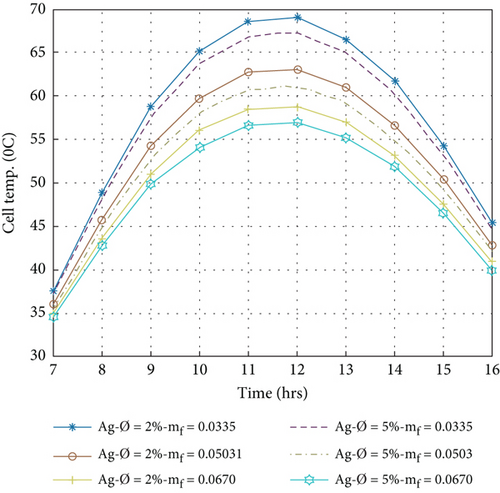
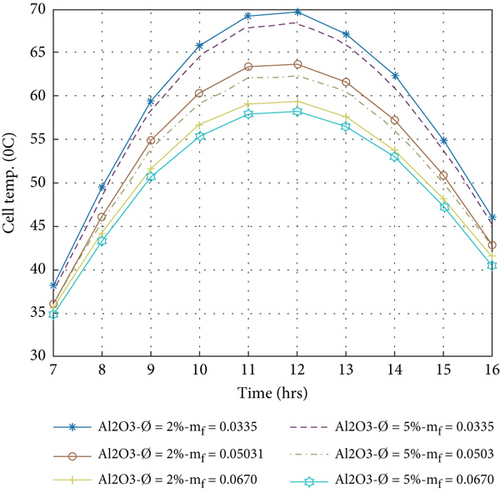
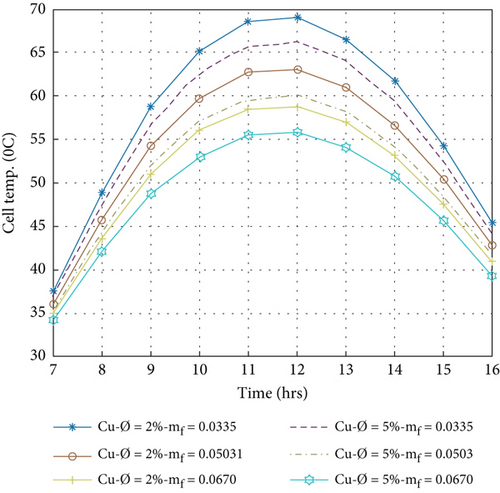
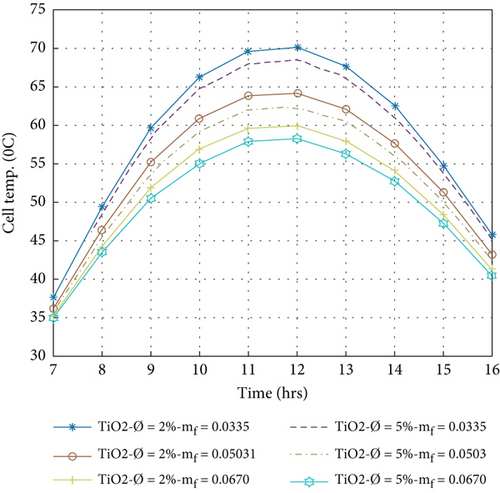
Allowing them to remove more heat from the PV panel and reduce the cell temperature, heat extracted by nanofluids in the composite collector becomes essential for enhancing the electrical performance of the PVT system [3]. The minimum cell temperature was achieved in a 5% volume portion of nanoparticle compared to a 2% volume portion and a mass flow rate of 0.067 kg/s. The minimum cell temperatures for different nanofluids Ag/w, Al2O3/w, Cu/w, and TiO2/w are 56.91, 58.18, 55.85, and 58.15°C, respectively. This value indicates that the Cu/water nanofluid is more effective in reducing the cell temperature than other nanofluids.
5.3. Heat Gain of the PVT System
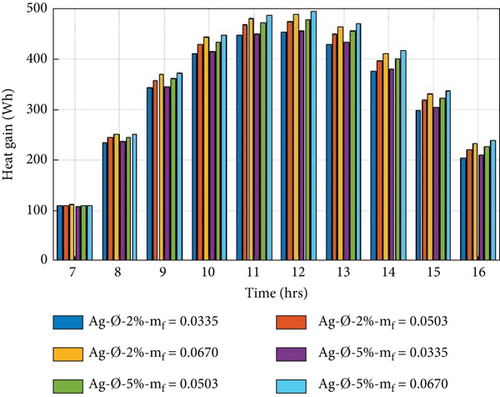
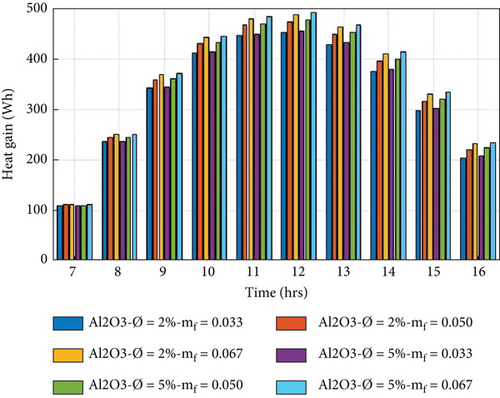
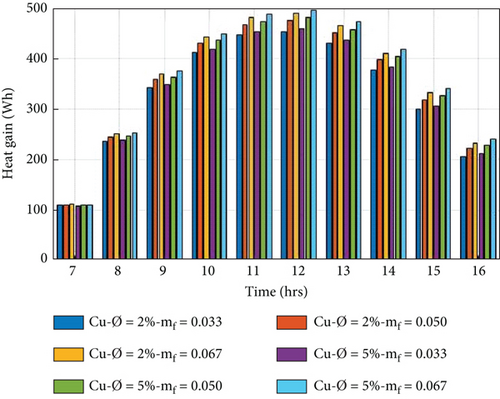
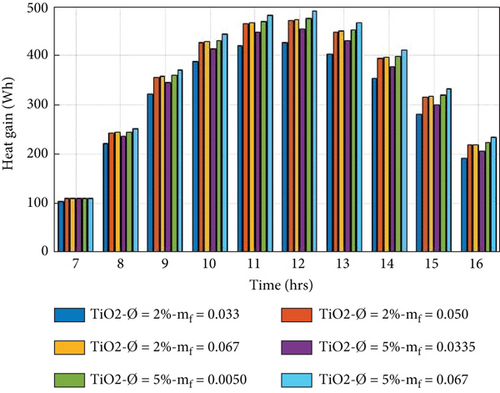
The heat gain of the system is a function of the specific heat, mass flow rate, and outlet temperature of nanofluids [3]. The beneficial heat gain is evaluated by Equation (11) for the PVT collector using different nanofluids at a volume portion of nanoparticles at 2% and 5%, with a variation of mass flow rate from 0.0335 to 0.0670 kg/s. Figures 7(a)–7(d) show the hourly variation of heat gain of the PVT collector using Ag/w, Al2O3/w, Cu/w, and TiO2/w nanofluids. It is observed that the heat gain increased in the morning to 12:00 am and decreased from 12:00 am to 04:00 pm, achieving the maximum heat gain at 12:00 am. It is also noted that the heat gain of the PVT system increases with increasing the mass flow rate because the heat gain is directly proportional to the mass flow rate by equation (11). On the other hand, when the volume portion of nanoparticles increased by 5%, thermophysical characteristics of nanofluids, such as specific heat capacity, decrease, and thermal conductivity increases. The interaction of these two opposing behaviours influences the tendency of thermal power [14]. The higher heat gain achieved in the 5% volume portion of nanoparticles in the nanofluid at a mass flow rate of 0.0670 kg/s is 495.64, 491.96, 490.21, and 490.19 Wh, for Cu/w, Ag/w, Al2O3/w, and TiO2/w, respectively. And lower heat gain is obtained at a volume portion of 2% of nanoparticles in nanofluid at a mass transfer rate of 0.0335 kg/s, 452.98, 452.35, and 451.64 for 449.68 Wh for Cu/w, Al2O3/w, Ag/w, and TiO2/w, respectively. The maximum heat gain is achieved in the Cu/w nanofluid compared to other nanofluids.
5.4. Thermal Efficiency of PVT System
The thermal efficiency of the PVT collector is referred to as the direct gain of heat. It is generated by the sun’s energy striking on the absorber sheet over the collector’s nonpacking area.
The thermal efficiency of the PVT system is evaluated by equation (10) for 2% and 5% volume portions of nanoparticles in nanofluid with a variation of mass flow rate from 0.0335 kg/s to 0.0670 kg/s. Figures 8(a)–8(d) show the hourly variation. The thermal efficiency is observed to increase from morning to evening. It is also observed that the mass flow rate is proportional to the thermal performance; by increasing the mass flow, the thermal performance also increases.
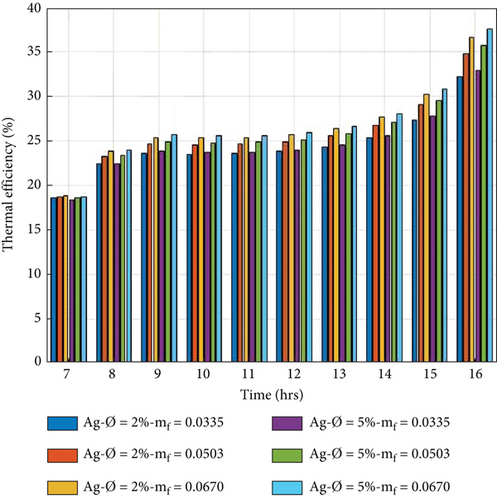
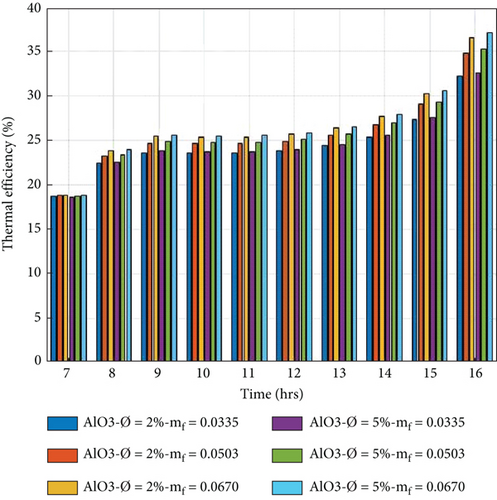
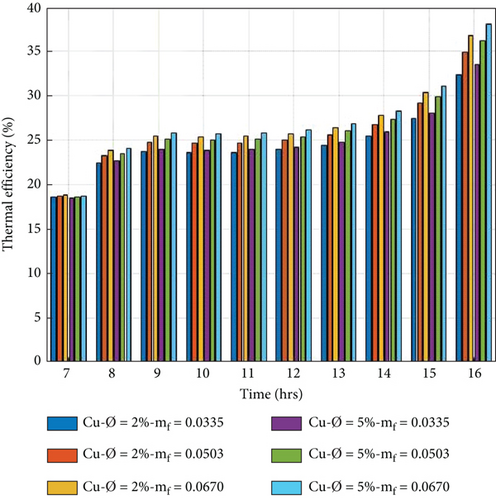
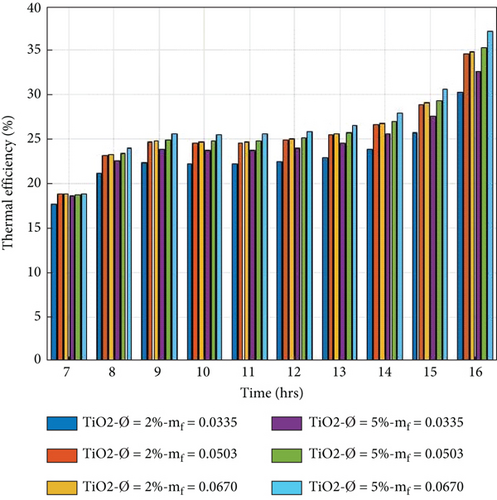
On the other hand, when the volume portion of nanoparticles in the nanofluid is increased, the thermophysical properties change. Variations of thermophysical properties affect the thermal performance and are influenced by the thermal capability; this increases with the volume concentration. The higher thermal efficiency per day obtained in the 5% volume portion of nanoparticles at a mass flow rate of 0.067 kg/s is 30.28%, 28.86%, 28.74, and 28.44%. The lower thermal efficiency in the volume portion of 2% of nanoparticles is 27.56%, 26.52%, 26.42%, and 25.07% at a mass flow rate of 0.0335 kg/s, respectively. In the present study, we can conclude that the Cu/w nanofluid is more effective than the nanofluids.
5.5. Electrical Efficiency
The electrical efficiency of the PVT system is a direct conversion of sun radiation into electrical current by the PV panel [45]. Electrical efficiency is evaluated for PVT collectors for various nanofluids by Equation (12) at volume portions of nanoparticles at 2% and 5% with a variation of the mass flow rate of 0.0335 to 0.067 kg/s. Figures 9(a)–9(d) show the hourly fluctuation of electrical efficiency, which decreases from morning to 12:00 am and then increases from 04:00 pm. It is observed that electrical efficiency is directly proportional to the mass flow rate and inversely to the cell temperature, causing the amount of the mass flow to increase, reducing the cell temperature, and improving the electrical performance.
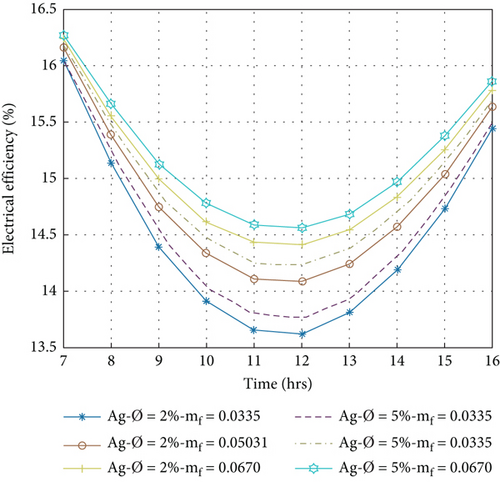
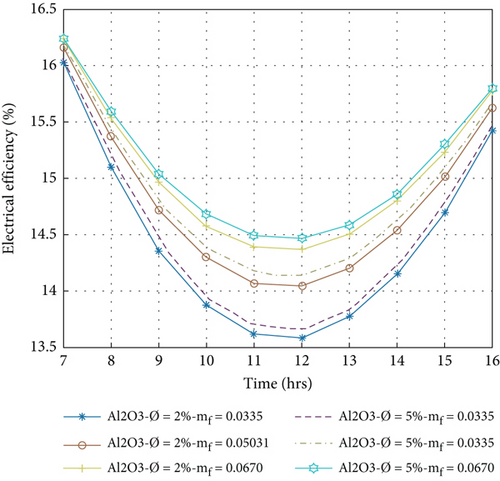
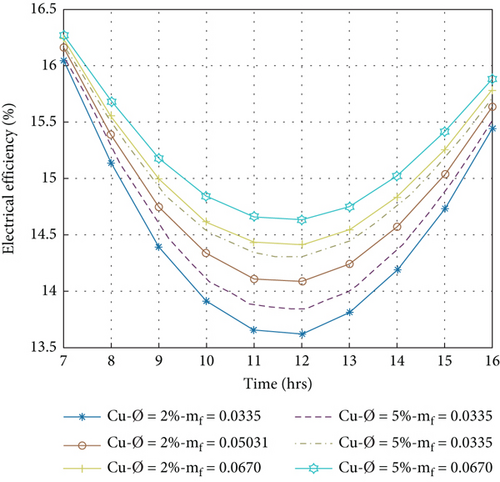
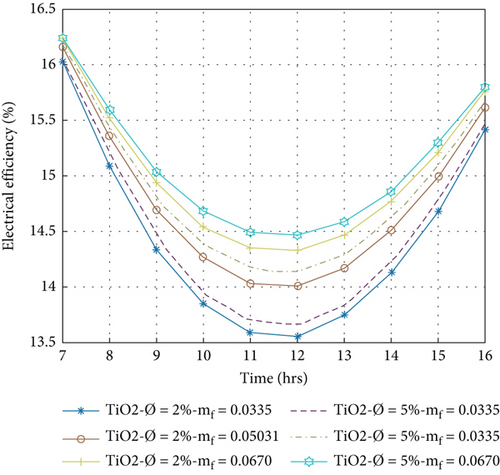
On the other hand, when the volume portion of nanoparticles is increased, electrical efficiency increases because the coolant’s thermal conductivity and the heat transfer rate increase. The effect of the volume portion on the nanofluids is already shown in Table 1. Higher electrical efficiency per day that is obtained at 5% volume portion of nanoparticles at 0.067 kg/s mass flow rate is 15.88%, 15.84%, 15.80%, and 15.79% for Cu/w, Ag/w, TiO2/w, and Al2O3/w nanofluids, respectively, and lower electrical efficiency that is obtained at 2% volume portion of nanoparticles at the same mass flow rate is 15.79%, 15.76%, 15.74%, and 15.72%, respectively. This value indicates that the Cu/w nanofluid gives maximum electrical efficiency compared to other nanofluids under the same condition.
5.6. Overall Efficiency of PVT System
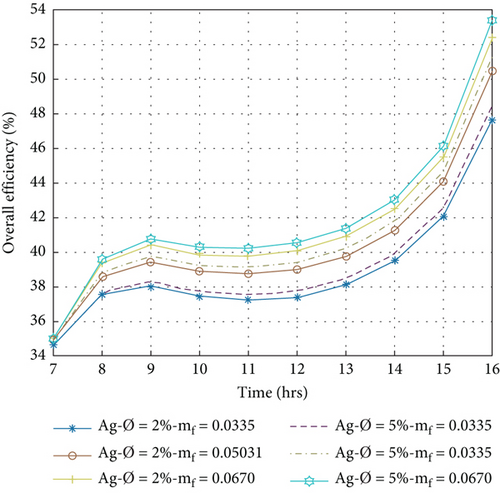
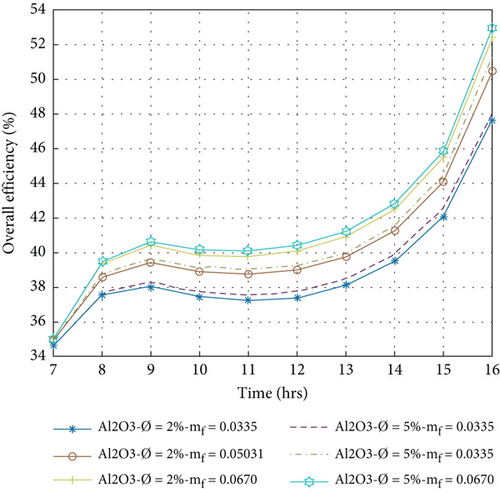
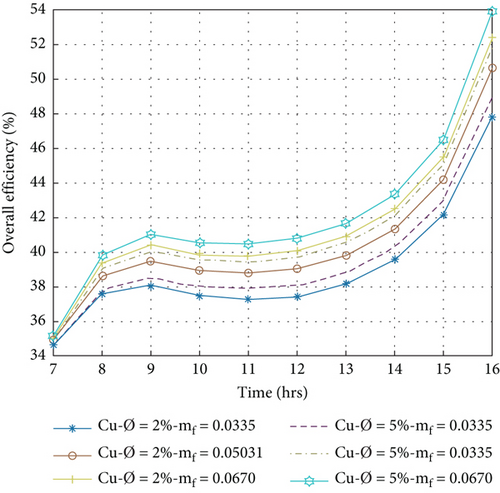
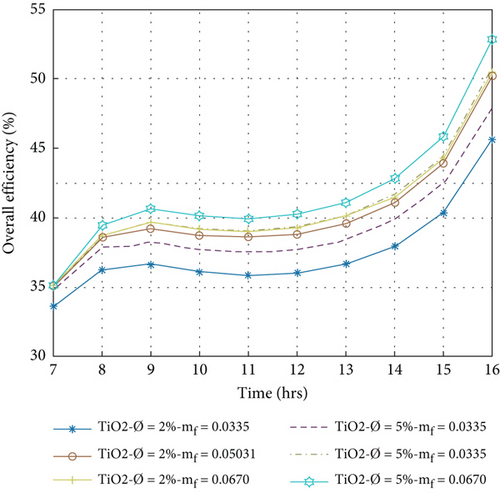
The overall efficiency is the sum of electrical and thermal efficiency, evaluated by Equation (13). Figures 10(a)–10(d) show the hourly fluctuation of the overall efficiency in the volume portions of nanoparticles at 2% and 5% with mass flow rates between 0.0335 and 0.0670 kg/s. A higher average overall efficiency per day is obtained in the volume portion of nanoparticles at 5%, and a mass flow rate of 0.0670 kg/s is 45.32%, 44.04%, 43.86%, and 43.84% for Cu/w, Ag/w, Al2O3/w, and TiO2/w nanofluids, respectively. The lowest value is achieved at the volume portion of 2% nanoparticles at a mass flow rate of 0.0335 kg/s, which is 39.52%, 40.92%, 40.98%, and 42.06% for TiO2/w, Al2O3/w, Ag/w, and Cu/w nanofluids, respectively. It is concluded that in the present study, Cu/w nanofluids have the highest overall efficiency compared to others. The compression of present results to previous literature is displayed in Table 5.
| Researcher | Evaluation type | Nanoparticles volume portion | ƞth (%) | ƞele (%) |
|---|---|---|---|---|
| Hissouf et al. [3] | Numerical | Al2O3/w and Cu/w (2%) | 35 to 50 | 12 to 14 |
| Khan et al. [18] | Numerical/experimental | Fe3O4/w and SiO2/w (3%) | 38 & 40 | 12.5 and 13.15 |
| Sardarabadi et al. [46] | Numerical/experimental | Al2O3/w, TiO2/w, and ZnO/w (0.02%) | 34.3 to 36.6 | 13.4 to 13.5 |
| Mahmood Alsalame et al. [47] | Numerical/experimental | CuO/w and Al2O3/w (2%) | 38.1 & 35.9 | 13 and 12.49 |
| Gelis et al. [48] | Numerical/experiment | SiO2/w, Al2O3/w, and CuO/w (0.1, 0.2, and 0.3%) | 37.1 to 66.4 | 15.8 to 21.1 |
| Diwania et al. [49] | Numerical | Cu/w and Al2O3/w (2%) | 40 to 48 | 14.2 to 15 |
| Present study (average per day) | Numerical | Ag/w, Al2O3/w, Cu/w, and TiO2/w (2% and 5%) | 28.4 to 30.2 | 15.6 to 15.9 |
5.7. Exergy of PVT System
Figures 11(a)–11(d) show the hourly fluctuation of exergy efficiency evaluated by Equation (16). The exergy efficiency is higher in the morning and evening due to fewer energy losses and low ambient temperature, which is reduced when solar radiation peaks. It is observed that the exergy efficiency is decreased when the flow rate is increased because the high rate of heat observed is reduced in the thermal exergy.
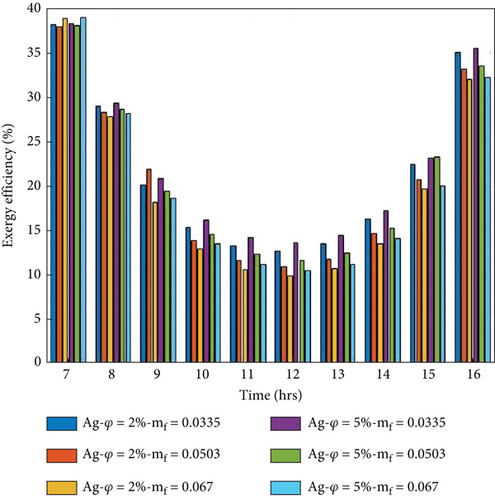
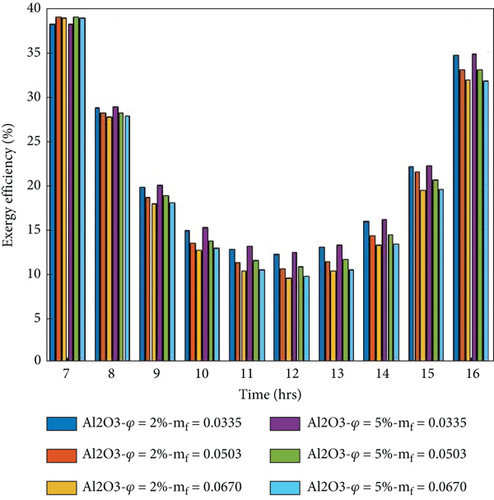
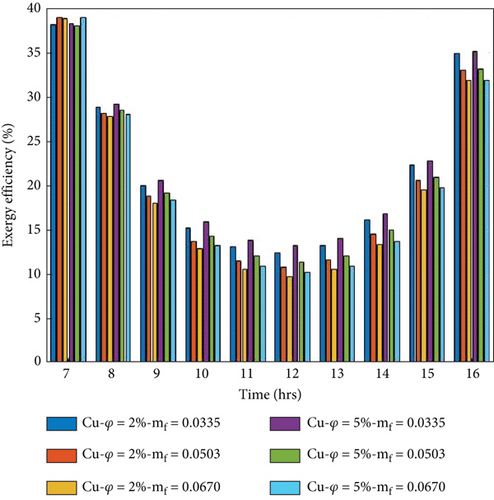
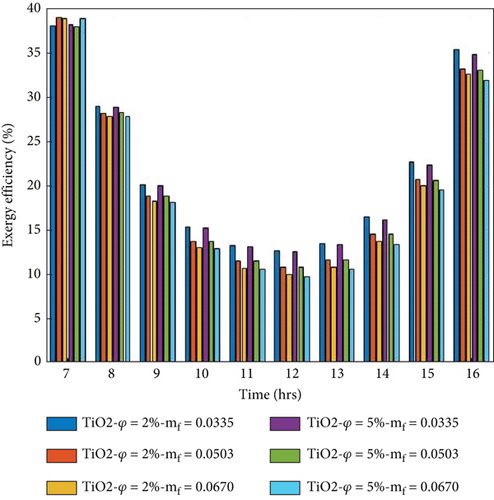
On the other hand, the exergy efficiency of the collector increases when the volume portion of nanoparticles increases. Because electrical and thermal performance improves by increasing, the volume portions are explained in Figures 8(a)–8(d) and Figures 9(a)–9(d). The maximum average exergy per day obtained in the 5% volume portion of the nanoparticles at 0.0335 kg/s mass transfer is 19.94%, 19.56%, 19.46%, and 19.41 for Cu/w, Ag/w, TiO2/w, and Al2O3/w nanofluids, respectively. The minimum average exergy per day obtained in the 2% volume portion of nanoparticles at 0.067 kg/s mass flow rate is 19.57%, 19.41%, 19.21, and 19.19% for Cu/w, Ag/w, TiO2/w, and Al2O3/w nanofluids, respectively. The numerically evaluated exergy of the present study is very close to the previous literature available [15, 49].
5.8. Pressure Drop of the PVT System
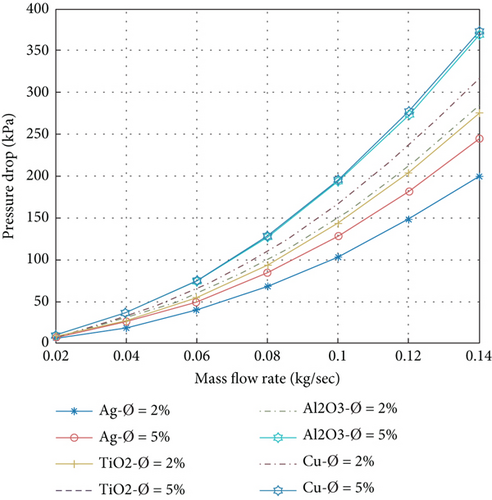
Equation (14) evaluates the pressure drop of the PVT system. Figure 12 shows the pressure drop variation with different mass flow rates ranging from 0.025 to 0.14 kg/s and 2% and 5% volume portions of nanoparticles. It is observed that an increase in the quantity of the mass flow rate increases the pressure drop because the pressure drop is directly proportional to the flow velocity of the nanofluid. On the other hand, the volume portion of the nanoparticles is increased by 5%. The pressure drop of the PVT system is enhanced because the density of nanofluids is improved by increasing the volume portion. The maximum pressure drop is achieved in the 5% volume portion of nanoparticles, and the 0.14 kg/s mass transfer rate is 374.74, 370.49, 370.28, and 244.92 Pa for Cu/w, TiO2/w, Al2O3/w, and Ag/w nanofluids, respectively. It is concluded that in the present study, the Cu/w nanofluid gives the maximum pressure drop compared to another nanofluid under the same condition.
5.9. ANN Simulation
5.9.1. Mean Squared Error
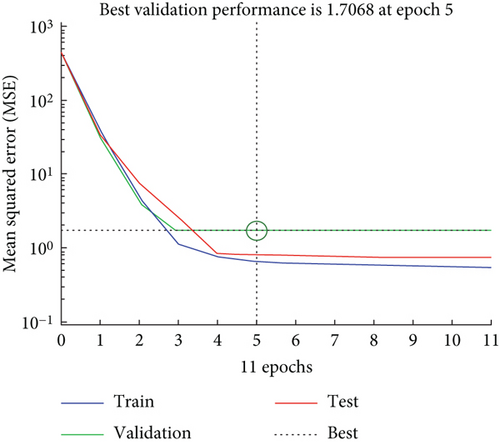
The MSE, or mean squared error, is a measure, and the ANN model performs to evaluate the difference between the output and target values. Test vectors are utilized to verify further that the network is generalizing effectively, but they do not impact the training process. The optimal validation performance for the ANN model is achieved at an MSE of 1.7068 during epoch 5, using five input variables, as illustrated in Figure 13. It is evident that the training, validation, and testing errors decrease and converge with the dotted line by epoch 5, indicating the best validation performance.
5.9.2. Regression Analysis
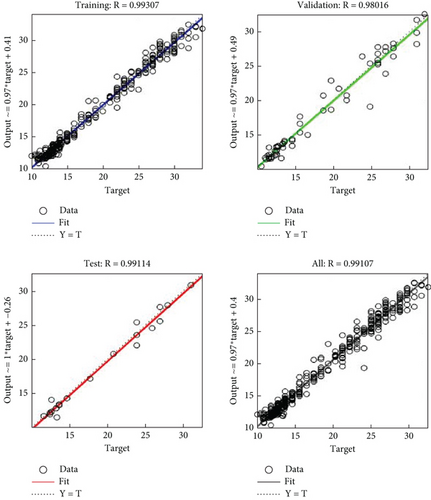
The network outputs concerning targets for the training, validation, and test sets are depicted in Figure 14. Each axis features a dotted line representing the ideal scenario where outputs equal targets. The continuous line signifies the linear best fit between the outputs and targets. The R-value indicates the correlation between the outputs and targets; an R-value of 1 denotes a perfect linear relationship, while an R-value close to zero signifies no linear relationship. This study’s correlation coefficients for the training, cross-validation, testing, and overall data sets are 0.99307, 0.98016, 0.99114, and 0.99107, respectively. These values, being closer to 1, suggest that the ANN exhibits a strong correlation between the actual and predicted thermal and electrical efficiency values in the system.
5.9.3. MAPE Error and Validation
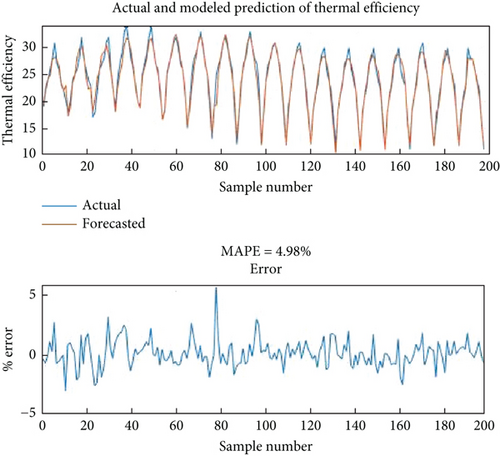
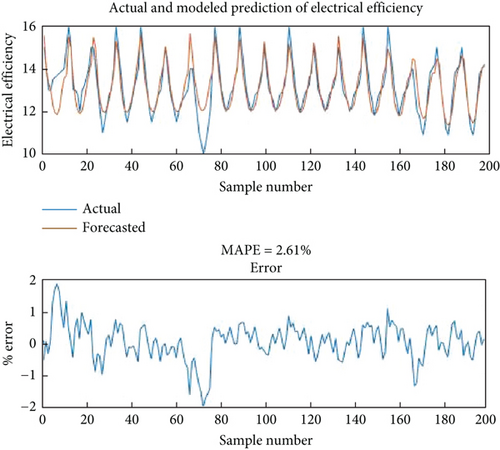
The Levenberg–Marquardt (LM) algorithm calculates MAPE error for thermal and electrical efficiency for validation, which is shown in Figure 15. The overall score of the MAPE achieved is 95.02% and 97.39% for the thermal and electrical efficiency of the system, and the MAPE error is 4.98% and 2.61%, respectively. This value provides robust validation between the ANN simulation’s predicted and numerical value.
6. Conclusions
- (1)
It is observed that electrical, thermal, total efficiency, and heat gain are direct, and exergy is inversely connected to the mass transfer rate. On the other hand, performance parameters increase when the volume portion increases because of an increase in thermophysical properties. Maximum average electrical, thermal, overall efficiency, and heat gain per day achieved in Cu/water nanofluid is 15.2%, 30.2%, 45.3%, and 495.64 Wh at flow velocity 0.0003 m/s and mass flow rate 0.0670 kg/s at volume portion 5% compared to the Ag/w, Al2O3/w, and TiO2/w nanofluids at the same volume portion and mass flow rate
- (2)
Maximum exergy of the PVT system is achieved in Cu/w at a volume portion of 5%, and a mass flow rate of 0.0335 kg/s is 19.94% compared to the other nanofluids at the same condition
- (3)
Pressure losses increase when the mass flow rate and volume portion increase. Maximum pressure drop is achieved in Cu/w nanofluid 374.74 Pa at a volume portion of 5% and mass flow rate of 0.14 kg/s compared to other nanofluids
- (4)
ANN MAPE error for thermal and electrical performance is 4.98% and 2.61%, respectively. It gives a better arrangement for validating the thermal and electrical performance of the ANN model and numerical results
Nomenclatures
-
- A:
-
- Area (m2)
-
- c:
-
- Specific heat of material (J/kgK)
-
- d:
-
- Diameter of the tube (m)
-
- :
-
- Collector efficiency coefficient
-
- G:
-
- Sun radiation (W/m2)
-
- hp1&hp2:
-
- Penalty factor
-
- h:
-
- Heat transfer coefficient (W/m2K)
-
- k:
-
- Rate of heat transfer (W/mK)
-
- L:
-
- Thickness (m)
-
- w:
-
- Width (m)
-
- and m:
-
- Mass flow rate (kg/s) and mass (kg)
-
- Qu:
-
- Use full heat gain (Wh)
-
- T:
-
- Temperature (°C)
-
- UT:
-
- Heat transmission coefficient from the PV panel to the rear surface by conduction
-
- UtT:
-
- Heat transmission coefficient from the glass to the tedlar through PV panel
-
- Utc−a:
-
- Total heat transfer coefficient from the PV panel to the atmosphere
-
- ULgt:
-
- Total heat transfer coefficient from bottom to atmosphere.
Subscripts
-
- a, bs, bf:
-
- Air, back surface, base fluid
-
- c, i, o:
-
- Solar cell, inlet, outlet
-
- g, ref, w:
-
- Glass, reference, water
-
- eff.:
-
- Product of absorptivity and transmissivity
-
- th, nf, p:
-
- Thermal, nanofluid, particle.
Greek Letters
-
- ρ, β:
-
- Density (kg), packing factor
-
- η, Ø:
-
- Efficiency, volume portion
-
- σ, μ:
-
- Stefan–Boltzmann constant (W/m2k4), dynamic viscosity (m2/s)
-
- τ, €:
-
- Transmissivity, emissivity.
Conflicts of Interest
The authors declare that the work reported in this study was not influenced by any known competing financial interests or personal relationships.
Acknowledgments
This work is supported by the “Chief Minister Scholarship for Ph.D. on Climate Change” with reference no.: 3152-53/SKMCCC/EPCO/2021 from the Environmental Planning and Coordination Organization (EPCO), Ministry of Environment, Govt. of Madhya Pradesh, India. This research was performed as part of the requirements during the employment of the authors at Ujjain Engineering College, Ujjain, India.
Appendix
Open Research
Data Availability
All data are available in the article.


