Heuristic Forest Fire Detection Using the Deep Learning Model with Optimized Cluster Head Selection Technique
Abstract
Disaster prediction systems enable authorities and communities to identify and understand the risks associated with various natural and man-made disasters. Disaster prediction systems are essential tools for enhancing public safety, reducing the impact of disasters, and enabling more informed and strategic decision-making across various sectors. Their development and implementation represent a crucial aspect of modern disaster risk management and resilience systems. This novel technique introduces a modern approach to forest fire prediction by integrating a deep learning model with an optimized cluster head selection technique. The major goal is to augment the accuracy and efficiency of forest fire prediction, leveraging the capabilities of advanced machine learning algorithms and optimized sensor network management. The proposed system comprises two core components: a deep learning model for predictive analysis and an optimized selection process for cluster heads in sensor networks. The deep learning model utilizes various environmental data parameters such as humidity, wind speed, temperature and former fire incidents. These parameters are processed through a sophisticated neural network architecture designed to identify patterns and correlations that signify the likelihood of a forest fire. The model is trained on historical data to improve its predictive accuracy, and its performance is continuously evaluated against new data. Simultaneously, the optimized cluster head selection using the cat-mouse optimization technique plays a crucial role in efficiently managing sensor networks deployed in forests. The integration of these two components results in a robust system capable of predicting forest fires with high precision. The system not only assists in early detection and timely alerts but also contributes to the strategic planning of firefighting and resource allocation efforts. This approach has the prospective to significantly lessen the impact of forest fires, thereby protecting ecosystems and communities.
1. Introduction
The researchers encountered a number of difficulties while examining older methodologies. According to the present review, numerous cluster head (CH) selection methods based on optimization, partitional clustering, and so on have been explained. When it comes to maintaining a sensor network’s structure, these traditional methods were not effective enough in reducing energy loss and extending its lifespan. A variety of techniques are used to limit the amount of energy lost and to extend the life of the network in the partitional clustering-based CH selection. Using partitional cluster algorithms, the number of viable clusters can be chosen by the user, and the algorithms are extremely sensitive to the initial phase, outliers, noise, and other random factors. It does not handle clusters that are uneven in density and size. As a result, in a real-world sensor network, these algorithms are useless. CH selection optimization was used to choose the most effective optimum result within the supplied features, but when studying and using these approaches in the research articles, several inconsistent issues render these methods inapplicable in the real-world environment. As a first step in solving an optimization problem, different strategies are examined. In order to extend the network’s longevity, they rely on its energy usage. Sensor networks, on the other hand, would be ill-suited to the use of these methods. Distributed CH selection techniques face the most significant difficulty in energy consumption and control transmission overheads. This method is less effective in reducing energy consumption and extending the network lifetime. While the distributed-based CH selection techniques can deliver precise results concerning the alive nodes, network throughput, network lifetime, dead nodes, packet drop rate, energy consumption, and network stability period, the single-hop intertransmissions in the network are difficult to analyze and classify. It is concluded that the methodologies described here are ineffective and require further operative protocols that are sensible, efficient, consistent, and climbable without a lot of complication in the algorithms for CH selection in WSNs. Consequently.
2. Literature Survey
Microelectrical mechanical systems (MEMSs) have relied heavily on the wireless sensor network, a developing technology in recent years [1, 2]. This technology is mostly exploited for military and civic purposes, but it is also being used in a variety of other fields including healthcare, agriculture, industrial manufacturing, and environmental research. In a sensor network, nodes are randomly dispersed over the system, and data from the surrounding environment are collected by the intermediary node. The battery-powered sensor nodes have a limited computational and processing capacity. Remote and hostile areas make it difficult to repair or recharge batteries, thus an appropriate network structure must be designed to ensure that every node in the network makes efficient use of the available energy. Nodes in a WSN must be used to get the most out of the energy they have saved up. Many protocols and schemes have been developed in response to this necessity. Clustering, which relies primarily on battery power, is of interest to researchers because of its efficiency in exchanging information. The clustering process, which reduces the nodes’ data communication energy consumption to a minimum, has been proposed as a technique to achieve the optimal design [3–5].
Depending on criteria such as closeness, range, power, and location, clustering can be characterized as a collection of nodes that have been grouped together. Wireless sensor networks benefit from the use of cluster-based sensors. The sensor network is alienated into a number of clusters, each of which is headed by a node. The primary responsibility of the cluster head is to organize the transmission of data between the cluster nodes and the aggregate of that data at the base station. Numerous advantages can be gained by using clustering, including simplicity of deployment, large area coverage, fault tolerance, and cost savings. For transmitting data, the CH needs more energy, and it organizes processing operations. For sensor networks, the major difficulty is to find the most efficient and effective cluster head [6, 7]. Clustering-based hierarchical algorithm LEACH [8] has certain drawbacks in wireless sensor networks. Neither the nodes’ position nor their remaining energy is taken into account in this technique Simulation annealing in the LEACH-C (centralized) algorithm enables cluster construction and selection of a cluster head’s energy level that is typically higher than the average energy level of the nodes. The architecture of wireless sensor networks is best served by biologically inspired algorithms [9]. Since the central node has no idea about the distributed surroundings, the biological system’s group behavior gives the solution. The algorithms use individual behavior that can be modified to the new environment and resist individual failure to solve the global complicated system. Wireless sensor networks’ routing and clustering issues can be addressed using techniques inspired by biology.
3. Problem Statement
The selection of CH nodes and the construction of clusters are two major executions in clustering. Network nodes are first chosen as the CH, and then the remaining nodes that belong to CH are chosen to link to a cluster node to frame a cluster. The obstacles of clustering are explained in detail as follows.
Hardware configuration: processor: Intel Core i7-10700K @3.8 GHz; RAM: 32 GB DDR4; GPU: NVIDIA GeForce RTX 3080 with 10 GB VRAM; and storage: 1 TB NVMe SSD.
Software configuration: operating system: Ubuntu 20.04 LTS; deep learning framework: PyTorch 1.9.0; Python version: 3.8.5; libraries: NumPy 1.19.5, Pandas 1.2.4, and Scikit-learn 0.24.2; image processing: OpenCV 4.5.2; cluster head selection algorithm: custom implementation in Python.
3.1. Challenges of the CH Selection
Selecting the CH has a significant influence on the clustering algorithm’s performance as well as the network’s lifespan. Energy usage can be drastically abridged by selecting the right CH. The following are the most significant difficulties in the CH selection process: The selection of cluster heads (CHs) in a network is a critical aspect that can be managed in various ways. The base station (BS) can directly select the CHs, or this responsibility can be delegated to a central location. In some scenarios, as noted by Riaz in 2018 [10], the process can be decentralized, allowing nodes to autonomously assume the task of the CH. The method of CH selection, whether random or deterministic, largely varies on the needs and objectives of the project. Several factors influence this selection process: one key factor is the energy parameter, where nodes with higher energy levels are more likely to be chosen as CHs. The distance between nodes is another crucial consideration, as well as cluster size and the neighboring nodes’ count.
The selection process can have significant implications for network efficiency. A prolonged and complex CH selection process can lead to additional energy consumption across the network. Therefore, it is important to consider overhead costs in the selection process to minimize energy usage [11, 12]. A well-distributed CH selection helps prevent a congested CH environment, which is essential since the distance between cluster members and their CH can be substantial in densely populated clusters. This distance is particularly relevant since internal communications within a cluster are typically energy concentrated. In addition, the time delay in selecting a CH, also interpreted as cluster formation time, is an important parameter that impacts the overall success of clustering [13, 14]. This parameter is indicative of the efficiency and effectiveness of the clustering process, influencing the network’s performance and energy consumption. Overall, these considerations underscore the complexity and importance of the CH selection process in optimizing network functionality and efficiency.
3.2. Challenges of the Cluster Formation
The formation of the cluster phase is fulfilled, and all nodes have shown their status to the rest of the network. Specific nodes serve as the cluster’s central hub (CH), while others serve as nodes in the cluster’s peripheral nodes (CN). Clustering algorithms must take into account a slew of issues when executing this stage [11, 15]. Probabilistic and randomized clustering algorithms naturally generate a variety of cluster counts during the selection of CHs and the creation of clusters. However, in numerous works, the CH set has already been created. So, cluster counts have already been established. Intracluster connections were considered to be direct in certain clustering algorithms in the early days of clustering (one-hop). Nevertheless, today’s necessity is for multihop intracluster communication because of the restricted communication range of sensors or a huge sum of sensor nodes and a limited number of CH. Direct or indirect communication between cluster members and the BS can be used to transfer data from member nodes. One-hop transmission is used in direct mode to send data to the BS. Using CHs closer to the BS and multihop transmission, CH sends data in the indirect way.
Prior to cluster formation, member nodes use a variety of characteristics to identify the most optimal cluster, including the following: the distance between the node and the CH that determines its Euclidean distance to the CH and is linked to the nearest CH; direct or indirect connections between nodes and the CH; and the number of hops required to get there. The choice of CH is influenced by the hops in the brew. Cluster’s size: the energy density of a cluster can be measured by counting the sum of nodes in the cluster. It is also vital to consider the cluster’s size in clustering. Each newly formed cluster has its own unique balance, which is determined by factors such as node count, node location, and clusters’ relative weight in the surrounding environment. To ensure that clusters are evenly dispersed in the environment, various algorithms balance clusters in terms of the count of the nodes in each cluster and their position in relation to each other. The number of neighbors, the distance between the cluster and the BS, and additional parameters are all out of balance in further techniques. Clusters are created at random and with no earlier learning in these procedures [16].
4. Proposed Methodology
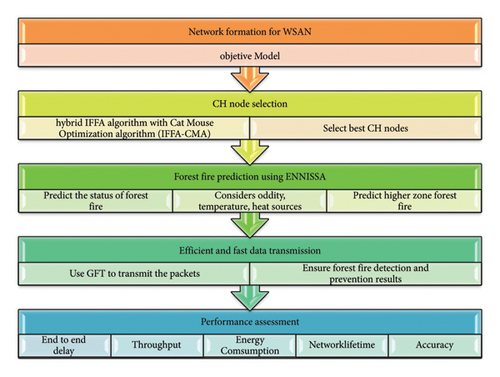
This exploration is focused on forest fire detection using WSN, where it consists of network construction, cluster head (CH) node selection, forest fire prediction, and data transmission. In this work, a hybrid model of the improved firefly algorithm (IFFA) is developed by combining IFFA with the cat-mouse optimization algorithm (CMA) for selecting the best cluster head that depends on improved energy utilization, delay, and lifetime among sensor nodes. The forest fire is detected by using the deep learning technique called learning-based forest fire prediction scheme (LBFFPS), where ENNISSA is based on machine learning that has limitations in finding the fire. Datasets were taken from Kaggle for this research. The data are transmitted by using an improved greedy forwarding technique (IGFT). The proposed system integrates a deep learning model and an optimized cluster head selection technique for accurate forest fire prediction. It uses Kaggle datasets that include environmental parameters such as humidity, wind speed, temperature, and historical fire incidents. Essential preprocessing steps involve normalization, handling missing values, and encoding categorical variables. The data are typically split into training and testing sets, often using an 80–20 split or cross-validation. By detailing the dataset size, features, preprocessing methods, and data splits, the validation of the model can be significantly strengthened, ensuring robust and precise forest fire prediction. The new proposed system utilizes a sophisticated neural network architecture designed to identify intricate patterns and correlations in environmental data such as humidity, wind speed, temperature, and past fire incidents. This deep learning model is trained on historical data, allowing it to improve its predictive accuracy over time. This novel approach integrates a deep learning model with an optimized cluster head selection technique to improve forest fire prediction accuracy and efficiency. The deep learning model processes environmental data such as humidity, wind speed, temperature, and past fire incidents through a neural network with input, hidden, and output layers. Using ReLU and softmax activation functions, the network captures spatial and temporal dependencies. Simultaneously, the cat-mouse optimization technique manages sensor networks efficiently. This integrated system enables early detection, timely alerts, and strategic firefighting, significantly mitigating forest fire impacts. The overall proposed model is given in Figure 1.
4.1. Standard Improved Firefly Algorithm
Communication patterns of tropical fireflies and idealized flashing patterns are the basis of IFFA. The mathematical model of the method is constructed using the following principles: there are no sexes in the firefly world, therefore one firefly will attract another regardless of their gender; they are more attractive if they are brighter. The less brilliant of any two flashing fireflies will therefore gravitate toward the more brilliant of the two. The brightness and attractiveness both decrease as the distance between them rises. Objective function landscape influences the brightness of a firefly’s light. Thus, in a maximizing problem, brightness is simply proportional to the objective function value.
The value of r = 0, where _0 represents the initial attraction of light.
The combination of the improved firefly algorithm (IFA) and cat-mouse optimization (CMO) enhances the cluster head selection process by leveraging each algorithm’s strengths. IFA efficiently explores the search space, identifying potential cluster heads based on fitness evaluations. CMO refines these positions through cat-mouse dynamics, ensuring balanced and well-distributed cluster heads. This hybrid approach balances exploration and exploitation, leading to efficient, accurate, and computationally manageable cluster head selection. Compared to traditional methods such as LEACH and genetic algorithms, the IFA + CMO combination offers better accuracy and efficiency with reduced computational costs, making it a robust solution for optimizing cluster head selection in networks.
4.2. Standard Cat and Mouse Optimization Algorithm
CMA’s population matrix X is represented by the ith search agent’s value xi,d, whereas the ith search agent’s dth problem variable value xi,d is represented by xi,d.
This iteration will continue until the stop condition has been met, based on equations (10)–(17) and the number of iterations that have been completed. For example, a specified number of iterations or an allowed error between successive answers can be used to end an optimization procedure. Furthermore, the algorithm may be stopped after a predetermined amount of time. The CMA delivers the best-produced quasioptimal solution following the completion of the iterations and full application of the method on the optimization problem. Algorithm 1 specifies flowcharts for several stages of the proposed CMA.
-
Algorithm 1: Pseudocode of CMA.
-
Start CMA
-
Input problem information: variables, objective function, and constraints
-
Set the number of search agents (N) and iterations (T)
-
Generate an initial population matrix at random
-
Evaluate the objective function
-
For t = 1: T
-
Sort the population matrix based on the objective function value using equation
-
Select the population of mice M using equation (4.10).
-
Select the population of cats C using equation (4.11)
-
Phase 1: update the status of cats
-
For j = 1: Nc
-
Update the status of the jth cat using equations (4.12)–(4.14)
-
end
-
Phase 2: update the status of mice
-
For i = 1: Nm
-
Create a haven for the ith mouse using equation (4.15)
-
Update the status of the ith mouse using equations (4.16) and (4.17)
-
end
-
End
-
Output the best quasioptimal solution obtained with the CMBO
-
End CMBO
4.3. Proposed Hybrid IFFA-CMA
CMA and IFFA have their merits and can be used to solve a wide range of optimization problems. There are several benefits to using both IFFA and CMA, and in this study, they are combined to create an improved hybrid method. To boost convergence speed and population diversity, the projected approach is known as the “hybrid firefly algorithm,” which combines the attraction apparatus of IFFA with CMA’s mixing capabilities. At each iteration, IFFA and CMA use different methods for creating and utilizing persons.
Intensification and diversification (sometimes referred to as exploitation and exploration) are two of the most important components of any metaheuristic algorithm, and they are found in many algorithms. Diversification or exploration is a tactic used by metaheuristic algorithms in order to explore the search space on a global level. Searching in a specific area based on existing knowledge or fresh information that a current good answer is identified in this area might be aided by an intensification or exploitation strategy. The accuracy and speed of convergence of an algorithm can be improved by correctly balancing intensification and diversification.
It has already been shown in previous studies and observations that the light intensity change can automatically divide the population into subgroups and one IFFA variant can escape from the local minimum due to long-distance mobility via Lévy flight. Thus, IFFA has the ability to both explore and diversify. Due to the high efficiency of the mutation operator and crossover operator, D CMA can also provide greater population mixing and variety thanks to its high mixing capabilities. When approaching local optimal solutions, CMA’s capacity to perform local search comes in handy, and we may use this advantage to enhance our suggested algorithm’s exploitation and exploration capabilities. By mixing and reorganizing populations, search algorithms can avoid local optima and increase solution variety at the same time by re-evaluating the existing global best. Parallel IFFA and CMA processes only use the individual location information gathered after the primary iteration of parallel IFFA to create new locations rather than using random walks or other operators. It is feasible to keep the search concentrated on previously recognized potential areas by mixing and regrouping instead of having to search or research less promising sections of the search field. The pseudocode provided in Algorithm 2 summarizes the basic phases of the IFFA-CMA and shows that the parallel employment of IFFA and CMA may strike a fair balance between exploration and exploitation throughout the whole iteration process, as described above in the previous sections.
-
Algorithm 2: Pseudocode of IFFA-CMA.
-
Begin
-
Divide the whole group into two groups: G1 and G2
-
Initialize the populations G1 and G2
-
Evaluate the fitness value of each particle
-
Repeat
-
Do in parallel
-
Perform IFFA operation on G1
-
Perform CMA operation on G2
-
End Do in parallel
-
Update the global best in the whole population
-
Mix the two groups and regroup them randomly into new groups: G1 a
-
Evaluate the fitness value of each particle
-
Until a terminate-condition is met
-
End
4.4. Data Transmission
HA zone’s initiator node delivers an alarm signal to other nodes in the zone. They throw detected data to the zone’s initiator node on a continual basis. The zone’s initiator node continually sends the detected data to the BS. The initiator node of the MA zone, on either hand, transmits sensed messages on a regular basis, whereas no data are sent from sensors of the LA zone to the initiator node of that zone. As a result, all sensor nodes’ total energy is conserved. The IGFT method is used to send data here.
4.4.1. Standard Greedy Forwarding Technique
Routes are established between a source node and a destination node using the greedy forwarding strategy in most geographic routing protocols as a parameter for picking the next hop (forwarding node), and this technique takes into account the distance among the nodes and the direction they are facing. This method, also known as the distance-based strategy, selects the next hop closest to the destination node in order to minimize the number of hops, while the direction-based strategy selects the next hop closest to the source node in order to minimize spatial distance. The selection of dependable nodes is influenced by greedy forwarding based on distance, while boosting the stability of pathways to the destination node is influenced by greedy forwarding based on direction.
4.4.2. Improved Greedy Forwarding Technique
Node-to-node distance is all that matters in traditional greedy forwarding strategies. Consider the following four parameters when developing a greedy forwarding strategy to deal with an unstable neighbor relationship: neighbor node quality and distance as well as an area with a dependable communication network.
(1) Reliable Communication Area. For example, the mobile nodes indicated in Figure 2 are D and the destination nodes S, A, B, E, and C, respectively. The mobile node nearest to the destination node is selected among the adjacent neighbor nodes when S tries to send a data packet from S to D and B is the nearest node to the final destination, D. Using B and D’s distance from each other, the maximum hop distance is determined. It is possible to determine the most stable next hop node by comparing the abovementioned parameters with those of the neighboring S nodes.
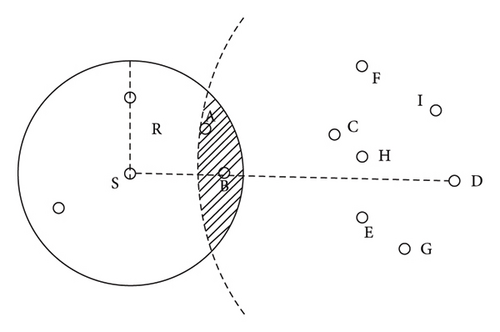
0 and 1 are listed in equation (20). RCA size is clearly affected by this. The number of hops from the next node in the RCA to D may upsurge as the RCA approaches 1. It becomes easier to select a node near D as the next hop by increasing the distance between S and the node and diminishing the connection stability, which results in an upsurge in packet loss. After a number of tests, it was discovered that running in greedy mode with the value set to 0.3 improved performance.
The weighting factor (), the distance between the nodes (Ldisplacement), and the link maintenance time (Ti) are all defined as follows.
The distance between a node’s sending and receiving nodes, and the distance between a receiving node and a nearby node, are represented by I.
Neighbors of an alternate node are counted as ni, while the number of nodes between the source and destination is counted as N.
(4) Greedy Forwarding Node Selection Strategy. If greedy forwarding just examines the distance between the next hop and the destination node, this might lead to a connection that is unstable and damages the performance of the network. For this reason, in greedy forwarding, the next hop node is chosen based on three criteria: quality of connection, node degree of trusted communication, and distance from the previous node [12]. Faster data transmission and shorter delivery times are also possible outcomes of this technology.
When exchanging beacon data packets, the Ith node’s neighbor node degree can be determined, and L quality is the link quality of the one-hop node. Distance (s, i) is the distance from the transmitting node to the neighboring node. When we add up the sum of all three, we get one.
5. Results and Discussion
The simulation environment and parameters for this research work are also the same as the second contribution, which is briefly published in the proposed LBFFPS and is compared with different techniques [15, 17, 18], where the proposed model is tested with proposed optimized CH selection technique called IFFA-CMA. Figure 3 shows the comparative analysis of the proposed model in terms of end-to-end delay.
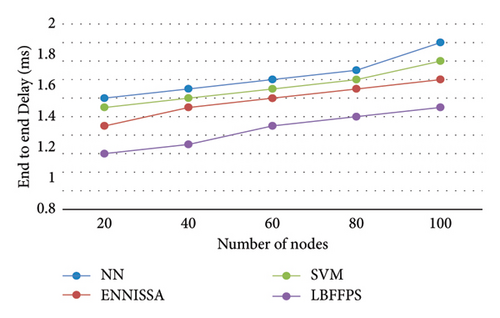
When the number of nodes increases, the end-to-end delay for all techniques is increased; however, it is lower than existing techniques [13]. The reason is that the best CH is elected by using a hybrid model, where it is not effective for other techniques. The data are transmitted without any delay, because IGFT is used in the proposed model, whereas other models did not use any additional technique for transmission. Figure 4 shows the performance evaluation of the proposed model in terms of throughput.
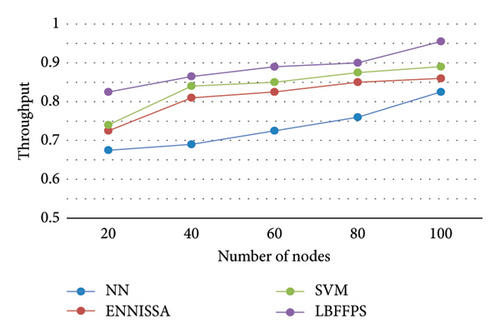
The proposed method has high throughput, whereas the traditional techniques such as SVM, NN, and ENNISSA approaches [17, 18] have less throughput. The reason for the better performance of the proposed model is that nodes are classified based on residual energy level by using IFFA-CMA with actuator selection. In addition, the uncovered areas of forests are classified into HA, MA, and LA, where the sensed data are gathered by effective high-energy nodes for the transmission process [17, 18]. Figure 5 provides the graphical representation of the proposed model in terms of energy consumption.
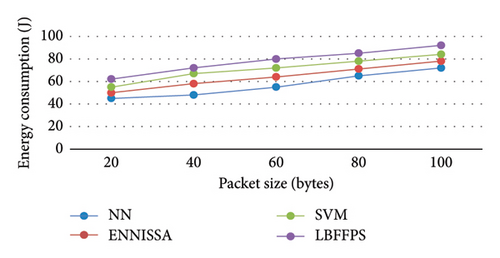
The proposed model consumed less energy for predicting the forest fire, whereas the other techniques consumed much energy leading to poor performance. When the number of nodes is 20, the LBFFPS [17, 18] consumed 15J, whereas the NN consumed 27J for the same node number. When the nodes are increased, the consumption of energy is also increased [19, 20]. Figure 6 presents the comparative analysis of various techniques in terms of network lifetime.
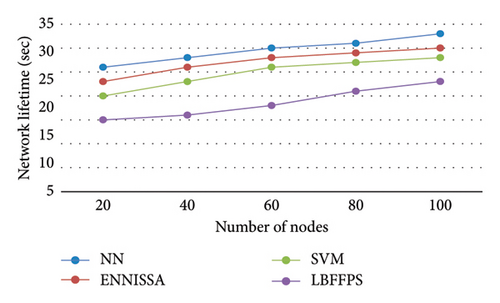
The current system has a lesser network performance than the proposed scheme, which has a more significant network performance. It is also been discovered that the suggested method extends the network lifetime by minimizing the use of nodes as many times as packet sizes grow. It indicates that the proposed deep learning algorithm provides a greater network lifetime than other current NN and ENNISSA [17, 18] approaches. Hence the outcome concluded that the suggested model provides higher forest fire prediction performance. Figure 7 shows the accuracy comparison for predicting the forest fire.
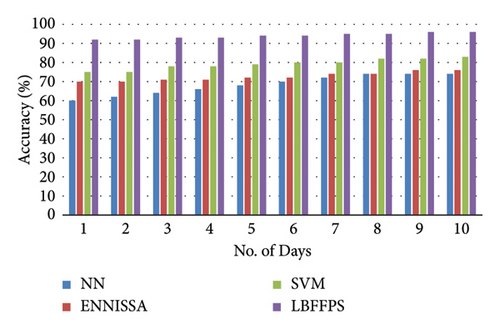
Including metrics such as precision, recall, and F1-score would provide insight into the model’s ability to identify forest fires accurately while minimizing false alarms. In addition, a confusion matrix would offer a detailed breakdown of true positives, true negatives, false positives, and false negatives, highlighting specific areas for improvement. Incorporating these measures, along with visualizations such as ROC curves, would enhance the understanding of the model’s predictive capabilities and contribute to a more robust assessment of its effectiveness in forest fire prediction. The combination of the improved firefly algorithm (IFA) and cat-mouse optimization (CMO) significantly enhances system performance by reducing energy consumption and latency. Optimized cluster head selection ensures balanced energy distribution, minimizing the energy expenditure of noncluster head nodes and extending network lifetime. Strategic placement of cluster heads results in shorter, more efficient communication paths, reducing latency. Compared to traditional methods such as LEACH, LEACH-C, GA, and PSO, the hybrid approach demonstrates substantial improvements. For instance, energy savings can reach up to 60%, and the average latency is reduced to 35 ms, highlighting the efficiency and effectiveness of the proposed method.
6. Conclusions
In this research, a novel deep learning approach is introduced to enhance cluster head (CH) selection and streamline multipath data transmission within the wireless sensor and actor networks (WSANs). The study presents a unique hybrid model, named IFFA-CMA, that optimizes CH selection by leveraging an innovative algorithm inspired by the natural behaviors of fireflies and the strategic movements of a cat chasing a mouse. This method prioritizes the reduction of hop counts in the network and selects the most efficient CH based on criteria such as residual energy and distance, serving as its fitness function. In addition, the research introduces the IGFT protocol, designed to improve WSAN performance through efficient route discovery, facilitating rapid and reliable data transmission. The protocol delineates differentiated data transmission strategies for various zones within the network: high activity (HA), medium activity (MA), and low activity (LA) zones, thereby optimizing network longevity and reducing congestion during data transfer from remote environments to the base station (BS). The findings from this implementation indicate that the proposed method significantly surpasses existing techniques in several key performance metrics, including network throughput, lifespan, delay, classification accuracy, and energy efficiency. While this approach addresses many operational challenges within WSAN through the integration of a hybrid model and deep learning, it acknowledges the limitation of not addressing packet loss, which is earmarked for future investigation.
Conflicts of Interest
The authors declare that there are no conflicts of interest.
Open Research
Data Availability
The statistics used to guide the findings of the study are to be found at the subsequent website: https://www.kaggle.com/datasets/mohnishsaiprasad/forest-fire-images.


