Phenomenological Model of Electrotechnical Systems Based on a Synchronous Generator With an Excitation System
Abstract
We propose a variant of the application of a phenomenological approach using the “black box” concept to the modeling of electrotechnical systems. The method enables obtaining simplified models of a complex electrotechnical system based on a synchronous generator (SG) with an excitation system and an integral estimation of the accuracy of the reproduction of the original step response. The compromise between complexity and accuracy is the basis for obtaining the computer model of different orders utilizing the proposed method. The application of the proposed phenomenological approach is illustrated by the examples.
1. Introduction
Simulation of transients in complex electrotechnical systems, which describe not only tens or hundreds but also thousands of ordinary differential equations (ODE) (e.g., complex electromechanical systems with a power supply [1–4] and complex electrotechnical systems [5, 6]), is a quite complicated problem even for the modern status of computer technology and methods for solving ODEs [7–11]. Another problem arises from the fact that, in the case of the application of numerical methods, the behavior of the utilized numerical method also affects the behavior of the studied system. As demonstrated in [12], due to the discretization by numerical integrators of the continuous model of the dynamic system, there are additional zeros and poles of the resulting discrete transfer function in the obtained digital model, and corresponding changes appear in Bode plots as compared to the analog prototype (the initial ODE system). As a result, the complexity of the digital model of the electrotechnical system increases several times compared to the continuous mathematical model described by differential equations. To some extent, this is consistent with the hypothesis of von Neumann, according to which the simplest description of an object that has reached a certain threshold of complexity is the object itself, and any attempt at its strict formal description (in this situation, a digital model) leads to something more complex and confusing [13, 14].
Another problem that needs to be solved is the implementation of transient calculations in power systems in real-time, or tens, hundreds of times faster for the system’s operational control [7, 10, 11, 15].
The traditional approach in modeling electrotechnical systems by solving ODEs using known numerical methods and writing differential equations in the Cauchy form (initial value problem) often encounters problems with increasing calculation time and accumulation of errors, which is observed in the case of complex electrotechnical systems. The use of classical numerical methods in such cases is often ineffective, even for low-order problems [16]. An example of the practical use of classical real-time modeling methods is the Dakar software package, which is designed to analyze the dynamic and quasistatic modes of power systems [15, 17]. However, in many cases, increasing the efficiency of the simulation of the dynamics of electrotechnical systems by only choosing the most efficient numerical method is not always successful.
The way out of this situation is through methods of simplification of complex models with the application of a phenomenological method of modeling (phaenomena, from Latin—“an observable event”).
2. About the Phenomenological Method
The use of a phenomenological method of analyzing the dynamics of electrotechnical systems is based on the fact that the behavior of a real high-order system is often only slightly different from the behavior of a lower order system. In particular, in [18], it is shown by example that a linear model of the fifth order provides almost the same accuracy of reproduction of dynamic behavior as a nonlinear 11th-order model. The practice of the phenomenological method is also facilitated by the fact that, in many cases, there is no need to reproduce the internal phenomena of the system but only to consider it as a “black box” that has an input and output. In particular, this method is effective for the analysis of power system stability [15, 17].
The concept of the “black box,” we recall, was introduced by the “father of cybernetics,” Norbert Wiener, in particular, in [19]. The concept of the “black box” allows one to ignore the internal structure of the object and focus only on its behavior, which should be reproduced in a computer model.
Thus, the advantage of the phenomenological method of computer modeling, which is based on the “black box” concept, is a significant time saving during the computer calculations. This is due to the need to reproduce only the external behavior of the object within the model; it can be achieved in a much simpler way. Note that this is possible in the situation when the researcher is not interested in the internal phenomena in the part of the system (or its element), which allows to consider this element only as an object of the “input-output” type, that is, “black box.”
It is clear that when there is no need to take into account the internal phenomena in the element of the studied system but only to reproduce its response to external impacts, this can be done with a certain accuracy, which is acceptable under research conditions. In many cases, the accuracy at the level of a couple of percent (e.g., up to 5%) is sufficient, which corresponds to the accuracy of the analog elements of the system—resistors and capacitors [20, 21]. Reducing the accuracy requirements of reproducing the behavior of a system element makes it possible to reduce the order of mathematical description (e.g., the transfer function or ODE order), which, accordingly, increases the calculation speed.
Therefore, the adequacy of digital models of power systems in accordance with their description by ODE systems and their higher calculation speed can be achieved by replacing the original model (prototype) with a simulation (phenomenological) model by order reduction. At present, the methods of reducing the model’s order are well known and have become widespread as an effective means of accelerating calculations [22, 23]. Model order reduction is widespread in power system studies, for example, for transient stability studies [15, 24] and for the detection of instability sources [25]. It is also of interest for control-oriented modeling to efficiently design a controller [26] for the purposes of state identification and parameter estimation [27], et cetera.
3. Method of Reducing the Order
In the first case, we have three independent variables, and in the second case, we have four variables. However, their number can be immediately reduced by one because the gain K2 or K3 is directly found from the step response after its setting into a steady state. Thus, to describe the behavior of the system by a phenomenological model of the second order, it is required to find only two coefficients, for a phenomenological model of the third order—three coefficients.
The block diagrams of the abovementioned phenomenological models in a generalized representation (with an input signal Xin and an output signal Xout) are given in Figure 1.


The efficiency and expediency of using the phenomenological approach to represent complex dynamical electrotechnical objects or their elements by the “black box” low-order models are illustrated by the two examples. These are typical for the problems of mathematical description and dynamic studies in electrical systems. The obtained results allow us to conclude about the efficiency of the phenomenological approach as a compromise between the model’s computational complexity (and the calculation speed) and the accuracy of representing the step response of the complex electrotechnical systems.
In particular, in the fourth section, we demonstrate that decreasing the order of the model from fifth to second and third allows us to obtain satisfactory results by means of maximum deviation and root mean square error. The accuracy of representing the step response by the third-order model is better.
In the fifth section, we present the second example of the higher order model. When the step response for the excitation (11th-order model) is used for obtaining the phenomenological models, the results are similar. But with the 12th-order model representing the step response for restoring the previous status after external loading, we also demonstrate that there is no improvement by using the higher order phenomenological model, and the best results are obtained by using the lower order ones.
4. First Example
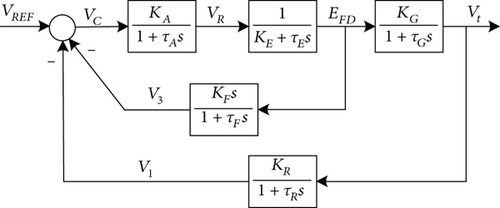
The first example of finding phenomenological models for power systems is shown below in the example taken from [32]. Consider a simplified block diagram of a synchronous generator (SG) with an excitation system (Figure 2).

- o.
Regulator gain KА = 40 and filter time constant τA = 0.05 s.
- o.
Exciter circuit gain KG = 0.8 and time constant (inertia) τG = 1.5 s.
- o.
Exciter constant (related to self-excitation) KE = –0.05 and time constant τE = 0.5 s.
- o.
Feedback loop parameters: KR = 1; τR = 0.01 s.
- o.
Generator stabilizing feedback loop gain KF = 0.04 and time constant τF = 0.715.
For the obtained transfer function of the model of SM with an excitation system, a step response is found (Figure 4).
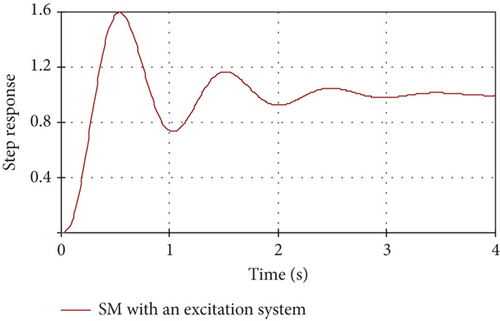
Reproduction of the behavior of such a fifth-order system using a phenomenological approach is possible using lower order simulation models that would provide sufficient engineering accuracy to represent the prototype’s transients.
4.1. Second-Order Phenomenological Model
In this case, it is possible to find the appropriate approximation coefficients T2 and ξ that would ensure maximum convergence of the step responses of the prototype (model of SM with excitation system) and its simplified (phenomenological) model. The procedure for finding the coefficients can be reduced to minimizing the integral quadratic deviation between the step responses of both models. The result is shown in Figure 5 for such values of model parameters: T2 = 0.163; ξ = 0.2.
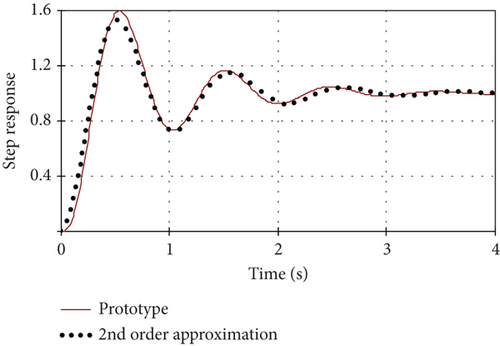
The maximum deviation of the step response of the phenomenological model from the step response of the prototype is below 13.2%, and the root mean square error does not exceed 0.7%.
4.2. Third-Order Phenomenological Model
After the procedure for finding the approximation coefficients, the result is shown in Figure 6 for such values of model parameters: T1 = 0.039; T2 = 0.155; ξ = 0.183.
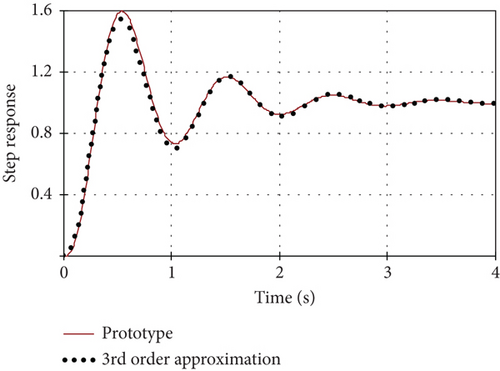
The maximum deviation of the step responses of the third-order phenomenological model for the step responses of the prototype is below 5.8%, and the root mean square error does not exceed 0.19%.
The results are summarized in Table 1.
| Original model (prototype) | Reduced-order phenomenological model | Maximum deviation (%) | Root mean square error (%) |
|---|---|---|---|
| 5th order | 2nd order | 13.2 | 0.7 |
| 3rd order | 5.8 | 0.19 |
5. Second Example
- o.
Typical excitation system includes PSS (power system stabilizers) [7, 37]. Its mathematical model is given by the ODE system (1) and with the structural diagram as given in Figure 3.
- o.
Equivalent complex electrical loading as an equivalent electrical circuit (based on [7, 36]).
- o.
The shaft of a hydraulic turbine is connected to the SG shaft. The research is performed using the conventional classical transfer function of a hydraulic turbine, as shown in Figure 7 [7].

- 1.
Step response for excitation (output voltage as the output coordinate).
- 2.
Step response for restoring the previous status after external loading.
5.1. Step Response for the Excitation
Such a model has the 11th order of mathematical description by the differential equations and reproduces the start regime for the output voltage including the excitation system. This regime is simulated by the step response of the input reference. The original model’s step response of the whole system is denoted on the plots below as the prototype.
5.1.1. Second-Order Phenomenological Model
In this case, it is possible to find the appropriate approximation coefficients T2 and ξ that would ensure the maximum convergence of the step responses of the prototype (complete model of a SM with an excitation system) and its simplified (phenomenological) model. As mentioned above, the procedure of the search of the coefficients can be reduced to minimize the integral quadratic deviation between the step responses of both models. The result is shown in Figure 8 for such parameters: T2 = 0.346; ξ = 1.80.
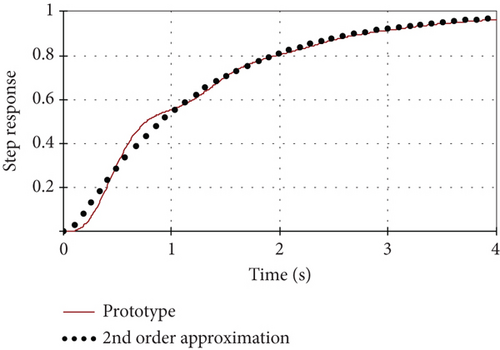
The maximum deviation of the step response of the second-order phenomenological model from the step response of the prototype is below 6.4%, and the root mean square error does not exceed 0.22%.
5.1.2. Third-Order Phenomenological Model
After the procedure for finding the approximation coefficients, the result is shown in Figure 9 for the values of model parameters: T1 = 1.203; T2 = 0.151; ξ = 0.207.
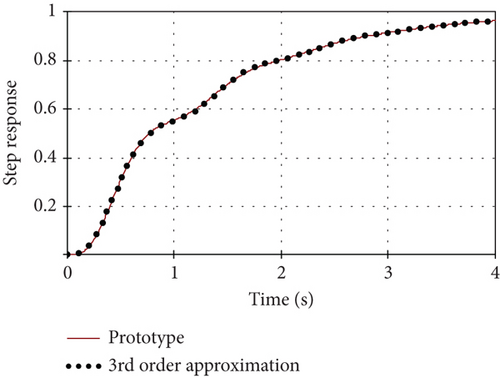
The maximum deviation of the step responses of the third-order phenomenological model from the step responses of the prototype is below 0.6%, and the root mean square error does not exceed 0.0023%.
5.2. Step Response for Restoring Previous Status After External Loading
Such a model has the 12th order of mathematical description by the ODEs, and it reproduces the regime (system’s mode) for restoring the previous status of output voltage after external loading including the excitation system. This regime is simulated by the step response of the external loading (i.e., increasing the loading current). The original model’s step response to the whole system is denoted as the prototype in the plots below.
5.2.1. Second-Order Phenomenological Model
In this case, it is possible to find the appropriate approximation coefficients T2 and ξ that would ensure maximum convergence of the step responses of the prototype (a complete model of SM with an excitation system and loading) and its simplified (phenomenological) model. As mentioned above, the procedure for finding the coefficients can be reduced to minimizing the integral quadratic deviation between the step responses of both models. The result is shown in Figure 10 for the values of model parameters: T2 = 0.163; ξ = 2.083.
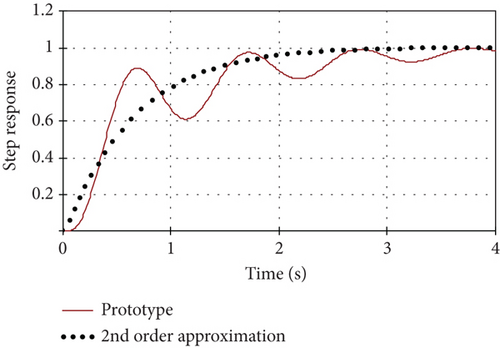
The maximum deviation of the step response of the second-order phenomenological model from the step response of the prototype is below 27%, and the root mean square error does not exceed 4.55%.
5.2.2. Third-Order Phenomenological Model
After the procedure for finding the approximation coefficients, the result is shown in Figure 11 for the values of model parameters: T1 = 0.686; T2 = 0.155; ξ = 0.061.
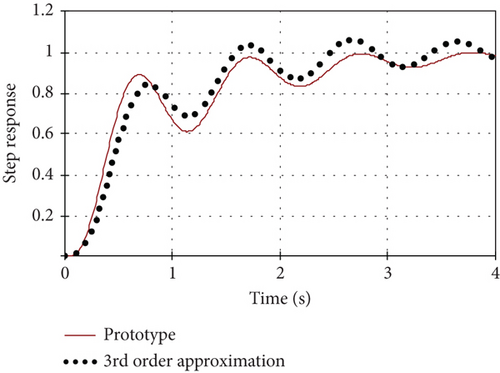
The maximum deviation of the step responses of the third-order phenomenological model for the step responses of the prototype is below 15.9%, and the root mean square error does not exceed 1.66%.
5.2.3. Fourth-Order Phenomenological Model
- o.
First, models with more than third-order complexity are more complicated, and the expectations of an increase in the accuracy of the reproduction of transient behavior are rarely realized (see, e.g., [18]).
- o.
Second, additional coefficients of the higher order transfer function result in a more complicated target minimization function. That correspondingly complicates the minimization process using traditional minimization procedures [28–31] as far as some local nonglobal minimums appear.
After applying the search procedure for the approximation coefficients, one of the variants is shown in Figure 12 for the values of phenomenological model parameters: T1 = 0.154; T2 = 0.088; ξ1 = 0.063; ξ2 = 3.886.
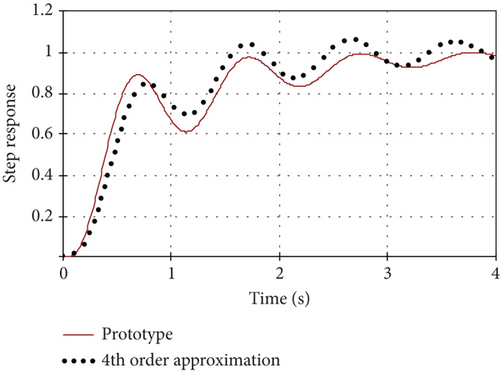
Note that the obtained result is only one minimum point from some local minimums of the target minimization function, and results strongly depend on the initial values of variables. The maximum deviation of the step responses of this fourth-order phenomenological model for the step responses of the prototype is below 16.8%, and the root mean square error does not exceed 1.84%.
This example demonstrates that there is no improvement by using the fourth-order phenomenological model, and the best results are obtained by the lower order phenomenological models (see Table 2).
| Original model (prototype) | Reduced-order phenomenological model | Maximum deviation (%) | Root mean square error (%) |
|---|---|---|---|
| 11th order | 2nd order | 6.4 | 0.22 |
| 3rd order | 0.6 | 0.0023 | |
| 12th order | 2nd order | 27 | 4.55 |
| 3rd order | 15.9 | 1.66 | |
| 4th order | 16.8 | 1.84 | |
6. Planned Future Research
- o.
Using fast computational methods to create high-speed computer phenomenological models. One of the solutions is using recurrent equations based on the z-transform (e.g., old but still actual book [38]).
- o.
Using a simple neural network as a phenomenological model instead of transfer functions. It is planned to test the effectiveness and speed of operation of these two methods to reproduce the behavior of complex systems.
7. Conclusion
The use of a phenomenological approach with a model’s description as a “black box” to the stability analysis of power systems provides a simplified computer model of the studied system of sufficient accuracy, which allows high-speed calculations during computer analysis of the dynamics of electrotechnical systems.
The studies have shown that simple phenomenological models of the second and third orders allow us to obtain sufficient accuracy for reproducing the behavior of complex parts of electrical power systems.
Disclosure
The work has been performed as part of the authors’ employment at Lviv Polytechnic National University.
Conflicts of Interest
The authors declare no conflicts of interest.
Acknowledgments
The authors have nothing to report.
Open Research
Data Availability Statement
The data used to support the findings can be obtained using the basic functions available in most mathematical software.


