Optimizing Power Supply Scheduling for Offshore Stand-Alone Microgrids: A Novel Framework considering Load and Fuel Procurement Uncertainties
Abstract
In offshore stand-alone microgrids, due to the lack of access to the main power grid, energy supply has always been vulnerable to many risks, such as uncertainty in fuel supply for diesel generators (DEGs) and unforeseen changes in renewable energy sources (RESs) and loads. As a result, this paper proposes a novel framework based on the hybrid renewable energy system (HRES) concept to optimize the capacity design and operation of HRES. The proposed framework is implemented on one of the Persian Gulf islands as a case study. This paper uses hybrid IGDT/stochastic optimization techniques for load and PV uncertainties and a novel wind-based method for fuel procurement uncertainties. Using MIP modeling in GAMS, the paper shows that renewable and storage systems can reduce the total cost by 38% and the energy supply cost by 43% compared to conventional energy supply system. Accounting for uncertainties can boost the system robustness and reduce the expected total cost by 16% compared to the deterministic model.
1. Introduction
Energy supply for offshore stand-alone microgrids (MGs) is usually provided by local infrastructure and networks (using diesel generators) that rely entirely on fossil fuels. Because of the high cost of fuel transportation in offshore stand-alone MGs (OSAMGs), renewable energy sources (RESs) such as wind turbines (WTs), photovoltaics (PV), biomass (BM), geothermal (GT), tidal waves (TWs), and fuel cells (FC) were used as suitable alternatives to fossil fuel-based energy systems [1]. Implementing the RESs can be considered a solution to turn the energy supply system into a self-sufficient island energy hub [2]. However, RESs are less reliable than fossil fuel-based supply systems due to their considerable generation volatility and their higher installation costs. The use of energy storage systems (ESSs), such as batteries, is a distinct solution to alleviate this problem, but it increases the annual operating costs of the system instead. Several extensive studies on the upgrading and optimization of construction technology for these systems have been conducted around the world with the goal of reducing investment costs, resulting in a decrease in their total costs while also increasing their efficiency [3].
In [4, 5], the authors proposed the optimal planning of a hybrid renewable energy system (HRES) in South Africa, ignoring the load uncertainty. In addition, the authors in [6] presented the best way to design and analyze a HRES that uses different renewable energy sources to supply electricity to a rural village in India. The planning and scheduling of a HRES for remote villages of southern part of India were investigated in [7], which was verified by NREL’s HOMER software tool. In [8], the sizing of HRES was studied for three cities in Iran with different climatic conditions related to the radiation and wind speed using real-time data. The authors in [9] implemented the local strategic planning statements (LPSP) method to consider the RESs’ uncertainty, which increases the system’s reliability against intermittent weather conditions. Furthermore, the authors in [10] proposed an optimal HRES design considering the impacts of energy not supplied (ENS) on planning costs. The authors in [11, 12] examined the natural gas-electricity network consumption for an HRES’s linearized dispatch model (nonlinearity is due to the dispatch factor). In [13], the energy hub system without the RERs was modeled through strong mathematical relationships, irrespective of the dispatch factor.
In most literature, the output powers of energy hub system components are modeled as a function of the input power and the equipment efficiency. The authors in [14] proposed an optimization framework for determining the optimal operating points of combined heat and power (CHP) units considering nonlinearity and nonconvexity of the feasible operating region (FOR) of CHP units. In addition, the authors in [15] included BM besides the RERs to produce natural gas during chemical processes, which can be used to fuel equipment such as furnaces and CHPs. The optimal design of an HRES with the base of national gas-electricity was presented in [16] to optimally determine the number of required RERs through statistical and random modeling methods. Moreover, the authors in [17] proposed a new scheme for designing multicarrier networked MGs to determine the optimal combined cooling, heating, and power sizes. To this end, industrial and residential hubs interact with other multicarrier MGs to determine the optimal operation of hubs.
However, most of the existing studies on HRES design and optimization have focused on onshore or near-shore applications and have not considered the specific challenges and opportunities of offshore stand-alone microgrids (OSAMGs). OSAMGs are isolated power systems that supply electricity to offshore facilities, such as oil and gas platforms, fish farms, desalination plants, or remote islands, without any connection to the main grid. OSAMGs have some distinctive features, such as high wind potential, limited space, harsh weather conditions, high-reliability requirements, and high environmental impact, that make them different from conventional HRES [18]. Therefore, there is a need for a comprehensive and systematic approach to design and optimize OSAMGs that can exploit the renewable energy resources available in the offshore environment, while ensuring the technical, economic, and environmental performance of the system.
Previous studies on HRES design and optimization have covered various geographical regions, such as Africa, Asia, Europe, and America, with different climatic conditions, renewable energy potentials, and load profiles. These studies have employed different methodologies, such as simulation, optimization, multiobjective optimization, stochastic programming, robust optimization, and information gap decision theory, to find the optimal configuration and operation of HRES, considering multiple objectives and constraints, such as cost, reliability, efficiency, emissions, and uncertainties [19].
- (1)
The high variability and intermittency of offshore wind and wave resources, which require accurate forecasting and sizing methods, as well as adequate energy storage and backup systems, to ensure the reliability and stability of the power supply [20].
- (2)
The limited space available on offshore platforms or islands imposes constraints on the installation and maintenance of HRES components, such as PV panels, wind turbines, and batteries, and requires optimal design and layout solutions. The harsh weather conditions and corrosive environment of the sea affect the performance and lifetime of HRES components and increase the operation and maintenance costs and risks [21].
- (3)
The high-reliability requirements of offshore facilities, especially those related to safety-critical operations, such as oil and gas extraction, which demand high-quality and uninterrupted power supply, and necessitate advanced control and protection strategies. The high environmental impact of offshore activities, especially those related to fossil fuel consumption and emissions, poses serious threats to the marine ecosystem and the climate and requires the adoption of clean and sustainable energy solutions [22].
- (1)
Solar: the solar radiation in the region is very high and suitable for photovoltaic (PV) generation. The PV technology is also mature and widely available. Solar energy can reduce the dependence on diesel fuel and lower the greenhouse gas emissions of the system.
- (2)
Diesel: diesel is the traditional and conventional source of energy for the island. Diesel generators are reliable and flexible and can provide backup power when the solar output is low or uncertain. Diesel fuel can also be stored.
- (3)
Battery: battery storage is necessary to balance the supply and demand of the system and to smooth the fluctuations of the solar output. Battery storage can also reduce diesel consumption and the operation and maintenance costs of diesel generators. Battery technology is also improving rapidly and becoming more affordable and efficient.
- (4)
We apply our method to a case study of a remote island in the Persian Gulf and compare the results with the current situation and the deterministic approach. We show that our method can reduce the fuel consumption and the energy supply cost.
- (1)
The proposed method is based on the real data of Farsi Island in the Persian Gulf, whose location is precisely mentioned in the paper. The real data include the load, PV production, and fuel supply of the island, which are subject to different uncertainties. The proposed method can model these uncertainties using a hybrid IGDT/stochastic optimization framework, which can balance the tradeoff between robustness and efficiency and find the optimal solution under different levels of uncertainty.
- (2)
The proposed method can provide several benefits for the energy supply system of the island, such as reducing fuel consumption, increasing renewable energy penetration, enhancing reliability and resilience, and lowering the environmental impact. The proposed method can also handle the operational constraints and technical limitations of the system, such as power balance and generation capacity.
- (3)
The proposed method can be implemented or integrated into the existing energy management system of the island, which can monitor and control the generation and demand of the system. The proposed method can provide optimal decisions for the system operator, such as how much power to generate from each source, how much power to store or discharge from the battery, and how much power to curtail or shed from the load. The proposed method can also provide contingency plans for the system operator, such as how to cope with unexpected events, such as fuel shortages, PV outages, or load surges.
- (4)
The proposed method can be applied to other remote areas with similar characteristics, such as isolated islands, rural villages, or military bases, which have limited access to the main grid and rely on hybrid renewable energy systems. The proposed method can be adapted to the specific features and requirements of each area, such as the availability and variability of renewable resources, the demand profile and pattern, and the system configuration and size.
- (5)
The proposed method, however, may face some challenges and limitations for its implementation or integration, such as the lack of budget, the changes in price, the policies and regulations, and human factors. These challenges and limitations may affect the feasibility and effectiveness of the proposed method and need to be considered and addressed for its successful implementation. For example, the lack of budget may hinder the installation or maintenance of the system components, the price changes may alter the optimal solution or the system performance, the policies and regulations may impose some constraints or incentives on the system operation, and the human factors may influence the acceptance or adoption of the proposed method by the system users or stakeholders.
1.1. Literature Review
There have been several methods that consider the uncertainty in the HRES sizing and scheduling problem in literature. The well-known statistical methods use probability density functions (PDFs) to model the uncertain parameters in the optimization problem. Moreover, the robust approach is a different risk-based optimization method that deals with the uncertainty by concerning the worst-case scenario for the HRES [23]. The information gap decision theory (IGDT) is another risk-based technique similar to the robust approach that preserves the HRES from the risks of information gap between the predicted and actual uncertainty variables [24]. In addition, the authors in [25] represented an integrated framework for optimizing the sizing and operation of several islanded HRES. In this research, the HRES capacity design problem was expressed within a chance-constrained optimization framework to demonstrate the uncertainty in RER generation and load changes, as one of the recent papers published on energy hubs [26] addressed a novel framework to simultaneously determine the optimal incentive paid by the local distribution company to residential customers considering the economic benefits of both parties. However, the purpose of this paper is not in line with our attitude in this research.
Optimum management of energy supply resources including traditional sources and renewable energies in multienergy carrier systems is very important and it seems that the use of an aggregating system such as the energy hub structure is required for this purpose. The authors in [27] presented a self-programming aggregator structure consisting of distributed energy generation sources with a stochastic combination method and information gap decision theory (IGDT) in a multienergy carrier system.
The authors in [28] examined a standalone PV/battery system in Cameroon. Using a firefly optimization algorithm, the system’s cost of energy and loss of power supply probability are optimized. In this study, it was determined that the size of the batteries has a significant impact on system cost, while the reliability is primarily influenced by the size of the PV modules.
The authors in [29] dealt with the issue of electrification to rural areas. In this regard, it reviews many papers on this topic and introduces four basic pillars. System configuration and size of units, optimal power distribution strategy, optimal technology selection, and optimal system design are the four pillars. It examines the impact of uncertainties in various papers and examines different states of network connectivity and disconnection.
The authors in [30] have presented a solution for energy management in a MG separated from the grid, taking into account the uncertainty of renewable energy resources and the uncertainty of load. The proposed method of energy management is designed with the aim of improving the life of the electric energy storage system, increasing the reliability of energy generation and also reducing hydrogen consumption in fuel cells. Also, the method of reducing the generation of solar resources is used to overcome the deep charging of the battery in times of low load. This system, by reducing the dependence on diesel source, can reduce diesel fuel consumption by 75% and energy supply cost by 30%.
The authors in [31] proposed a new energy management method in order to reinforce the energy supply system of a MG isolated from the grid against unexpected events based on the stochastic programming-information gap decision theory (IGDT) algorithm. Also, the approach of demand response programs is considered in the proposed model. By using the proposed method, the system can reduce fuel consumption by 10–20 percent and air pollution by 15–30 percent.
In [32], dynamic modeling and simulation of a DC MG and separated from the grid, consisting of solar panels, wind turbines, batteries and a simple DC load, have been discussed. In this paper, power control strategies with the aim of high quality power output are among the goals of dynamic simulation.
In [33], a model was designed to allocate the optimal amount of participation of energy resources such as gas, water, cooling, heating, and electric power in a MG, in which the network operator also participates in the sale of electric power, heat, and water. In this study, energy converters have been used to provide all kinds of needed energy, and the goal is to reduce energy supply costs, including operating and pollution costs. Uncertainties of wind speed, electric load demand, and electricity price in the market have been seen in the modeling.
The paper [34] is a case study regarding the energy supply of remote rural communities with different resources including solar panels, biomass units, and diesel generators with electric storage and not connected to the grid. Uncertainty in the generation of units and the uncertainty of consumption are considered in this study. Finally, the sensitivity of the system to changes in load and fuel price has been analyzed.
The authors in [35] have discussed the optimal performance of MGs containing electrical loads and thermal loads. CHP units, boilers, wind turbines, storage, along with demand response and the possibility of exchanging power with the wholesale market are the resources considered. Economic optimization assuming the supply of all electric loads and heat loads and taking into account the demand response is the objective of the problem. Also, the uncertainty in the generation of wind turbines and solar panels has been modeled by the IGDT method.
The case studied in [36] is planned for a long-term horizon due to consumption growth and uncertainty in generation. Finally, with the help of genetic algorithm and particle swarm algorithm, the total cost has been optimized. In this paper, the cost sensitivity to load change and change in solar panel and diesel generator generation has been analyzed.
In [37], solar panels and gasification together with batteries without connecting to the grid are considered. Correlation of mentioned variables has also been measured by combining neural network algorithms and particle swarm optimization.
The authors in [38] presented the design and economic analysis of a standalone MG for a small residential community in Saudi Arabia. It highlights the increasing demand for electricity and the depletion of conventional fuels, leading to the adoption of renewable energy resources. This study utilizes HOMER Pro and MATLAB/Simulink for optimal design and energy management, resulting in a lower electricity price compared to traditional generation methods.
In [39], the connection to the grid is established and solar panels and batteries are used, taking into account the uncertainties of radiation, temperature, and consumption. A combination of innovative methods with Robust and IGDT has been used to model uncertainties. The objective function of the problem is to minimize the cost by considering the deviation of the uncertainties from their average value.
Water and energy systems are inseparably dependent on each other so that different stages of energy generation require the use of water. Meanwhile, the extraction, delivery, distribution, and purification of water also require energy consumption. Integrated management and optimization of water and energy supply systems, which is the goal of [40], can help to improve reliability indicators in addition to reducing water and energy supply costs.
The authors in [41] dealt with the optimal design of an energy hub system taking into account the uncertainty in the generation of renewable resources and load changes (using the demand response approach). The purpose of this authority is to reduce the cost of energy consumption for a system connected to electricity and gas grids.
In [42], a multiobjective optimization model has been developed to plan multiple energy storage capacity based on demand response and with the aim of minimizing economic cost and carbon emissions. Load uncertainty is not considered in this paper, but demand response is studied as a measure of load variations.
The wind turbine, diesel generator, and battery are the equipment used in the system [43] without connection to the grid. In this study, a new energy distribution strategy is presented with a detailed technical and economic analysis and an investigation of the amount of greenhouse gas emissions. The objective function under investigation is the energy cost, which is minimized, and finally, the sensitivity of the system to fuel price changes is analyzed.
The case studied in [44] includes solar panels, wind turbine, battery, CHP units, boiler considering electric load, and heat load. Demand response and load shedding as well as uncertainties of wind turbine and solar panel generation are modeled by the IGDT method. The uncertainty of electricity price is modeled by combining IGDT and stochastic methods. The objective function of the system is the total generation cost which is minimized.
Uncertainty is modeled in [45] by combining IGDT and two-point estimate methods. Generation of solar panels and wind turbines, price of gas and load, and uncertainties are considered. The proposed optimization has also been implemented on the cost of operation and emission of greenhouse gases.
The authors in [46] have presented a robust model for the optimal design of energy hub against the uncertainty of renewable energy sources and the uncertainties of electrical and thermal loads. In this study, the gas grid is discussed as an input for the energy hub and also as a support to reduce the impact of the uncertainty of wind turbines.
The authors in [47] proposed an optimal energy management strategy for a MG that consists of renewable energy sources, electric vehicles, and responsive loads. The goal is to minimize the operation costs and emissions of the MG. The paper uses a two-stage model to optimize the energy and reserve markets, considering the uncertainties of wind and PV generation. The paper also uses an improved shuffled frog leaping algorithm to solve the optimization problem. The paper shows that the proposed strategy can reduce the costs and emissions of the MG, as well as cope with the variations of renewable energy sources.
The authors in [48] proposed an energy management and operational planning strategy for a MG that consists of renewable energy sources, distributed generation units, and energy storage systems. The goal is to minimize the total operating cost of the MG under different weather conditions and the uncertain power output of renewable sources. The paper uses a stochastic optimization approach and a hybrid whale optimization algorithm and a pattern search to solve the scheduling problem. The paper shows that the proposed strategy can reduce the cost and improve the performance of the MG with renewable energy sources.
The authors in [49] proposed a probabilistic reliability management strategy for energy storage systems in a MG with renewable energy sources. The goal is to optimize the scheduling of energy storage systems to ensure the reliable operation of the MG in both connected and islanding modes. The paper uses a multiobjective optimization problem that considers the cost and reliability objectives and a Monte Carlo simulation to model the uncertainties of renewable power generation and load demand. The paper also uses a nondominated sorting teaching learning-based optimization algorithm to solve the optimization problem. The paper shows that the proposed strategy can enhance the reliability of the MG with renewable energy sources and reduce the cost of operation.
The authors in [50] proposed a multi-MG energy management strategy in a power transmission mode that considers different uncertainties. The goal is to coordinate the power exchange between MGs and the main grid to reduce operating costs and improve the reliability of the system. The paper uses a multilayer neural network to predict the uncertainty parameters of renewable power generation and load demand. The paper also uses a mixed integer linear programming problem and a nondominated sorting teaching learning-based optimization algorithm to solve the energy management problem. The paper shows that the proposed strategy can effectively manage the power transmission between MGs and the main grid under different scenarios.
The authors in [51] proposed an optimal scheduling model for a regional integrated energy system (RIES) that considers multiple uncertainties and integrated demand response (IDR). The goal is to minimize the total cost of the system, including operation and maintenance costs, energy transaction prices, and equipment maintenance costs. The paper uses robust optimization and stochastic optimization approaches to deal with the uncertainties of source and load sides. The paper also uses a tariff-based demand response model that considers the electrical, heating, and cooling loads in the IDR model. The paper shows that the proposed model can reduce economic costs and improve the energy efficiency of the RIES. By using the proposed method, the system can reduce energy supply cost by 20–40 percent and air pollution by 10–25 percent.
1.2. Research Gap
According to the reviewed papers, a model for the optimal HRES design and operation considering load variation and fuel procurement uncertainties in islanded MGs has not yet been proposed. In addition, most literature considers the energy hub systems to be connected to the upstream grid. The most important innovation of this paper relates to the reduction in energy supply costs and its robustness to load changes and fuel uncertainty. Therefore, in addition to reducing the cost of the whole system, the energy supply system becomes more reliable. As another application, this research can be used to make recommendations for energy suppliers in remote areas to use renewable energies to create a healthier environment. It is noteworthy that the optimal choice of the combination for energy supply equipment in each region depends on the availability of RERs in that region. Thus, the technical and economic potential assessments are the essential elements of optimization considered in this paper. The number and capacity of equipment are then chosen to achieve an economically optimal system and reliability indices, as excess equipment capacity may result in high system costs. As a result, a significant research gap in this area has been identified, which is attempted to be filled in this paper, as shown in Table 1. This table indicates the items considered in each reference and the methods used to model the uncertainties of load and fuel.
| Actual case study | Load uncertainty | Fuel uncertainty | RES uncertainty | Remote area | Energy storage | |
|---|---|---|---|---|---|---|
| [27] | — | IGDT-stochastic | — | — | ✓ | ✓ |
| [28] | Cameroon | — | — | — | ✓ | ✓ |
| [30] | — | Stochastic | — | ✓ | — | ✓ |
| [31] | — | IGDT-stochastic | — | — | — | ✓ |
| [32] | Fukuoka (Japan) | Stochastic | — | ✓ | — | — |
| [33] | — | — | — | ✓ | — | ✓ |
| [34] | India | Probabilistic | — | — | ✓ | ✓ |
| [35] | — | IGDT-NNC | — | — | ✓ | ✓ |
| [36] | Uttarakhand (India) | Probabilistic | — | ✓ | ✓ | — |
| [37] | — | — | — | ✓ | — | ✓ |
| [38] | — | — | Lexicographic-IGDT | — | ✓ | — |
| [47] | — | Stochastic | — | — | — | — |
| [48] | — | Stochastic | — | — | ✓ | — |
| [49] | — | — | — | ✓ | ✓ | ✓ |
| [50] | — | IGDT-NNC | — | — | — | ✓ |
| [51] | — | — | Stochastic | ✓ | ✓ | — |
| Proposed method | Persian Gulf (Iran) | IGDT-stochastic | Innovative method | ✓ | ✓ | ✓ |
1.3. Contributions
- (1)
Modeling of refueling uncertainty and its dependence on wind speed with an innovative method. This method considers that the fuel supply is impossible at wind speeds higher than a certain threshold even if there is a need for refueling. At wind speeds lower than the threshold, the fuel supply is possible depending on the fuel demand at that time. This method captures the realistic situation of the remote islands, where the fuel delivery is affected by the weather conditions.
- (2)
Given the extremely low probability of uncertainty occurring in the worst value, considering the worst case scenario only increases the cost of over-robustness and may not make sense. Therefore, in this study, IGDT and robust methods and innovative methods for modeling different uncertainties (load, PV production and fuel supply) are combined under the hybrid IGDT/stochastic optimization title. This approach can balance the tradeoff between robustness and efficiency and find the optimal solution under different levels of uncertainty.
- (3)
Under the hybrid IGDT/stochastic optimization framework, IGDT and robust methods are integrated with innovative methods for modeling various uncertainties (load, PV production, and fuel supply). Most of the current methods for dealing with uncertainties in HRES design and operation either disregard some kinds of uncertainties or adopt a worst-case scenario, which can result in suboptimal or overly cautious solutions.
- (4)
The aforementioned innovations are aimed at designing optimal HRES for OSAMGs (remote islands disconnected from the national grid), which has led to a reduction in the number of times of refueling, fuel consumption, pollution, and cost of energy supply, as well as increasing the resilience of the energy supply system against the aforementioned uncertainties.
- (5)
In this paper, the Monte Carlo method is used to determine the optimal value of the uncertainty parameter β, which minimizes the expected total cost of the HRES. By doing so, the technical and economic planning of the project is based on this optimal point, which results in an optimal tradeoff between technical and economic aspects.
- (6)
The proposed model’s efficacy is substantiated through its application to a case study on a remote island in the Persian Gulf. The outcomes are benchmarked against the existing system and alternative approaches, demonstrating the model’s capacity to markedly enhance cost efficiency, fuel consumption, and environmental impact. This comparison extends beyond theoretical analysis, incorporating various models and scenarios to underscore the practical applicability of the research presented.
1.4. Paper Organization
This paper is organized in 5 sections. Section 1 includes the introduction and literature review, and Section 2 includes the description of the problem and statement of assumptions. In Section 3, formulation, related constraints, and problem-solving method are considered. Finally, the results are presented in Sections 4 and 5 contain a summary of results and conclusions.
2. Problem Description
2.1. Geographical Location of the Island
This paper implements the proposed framework for one of the Persian Gulf islands. This island is the farthest region from the southwest coast of Iran, which is shown in Figure 1.
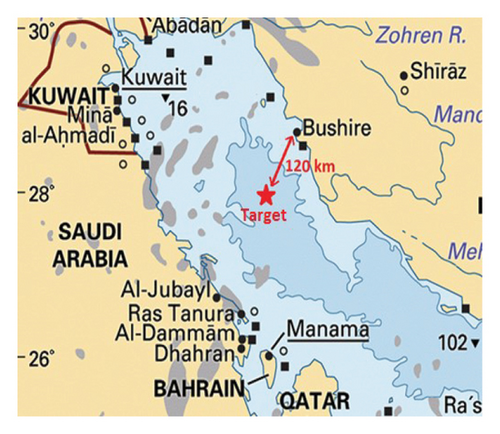
Currently, the energy demand of this island is supplied by diesel generators that were placed there many years ago. The electricity generation of diesel generators obviously depends on fuel procurement. Thus, due to the far distance between the island and the coast, the diesel generators’ fuel could only be transported by fuel tankers. The problem of refueling manifests itself when the sea is in stormy conditions, and its waves make it difficult for tankers to transfer fuel. In addition to providing the electrical demand, the island also has difficulty providing a freshwater supply that provides desalination facilities. Due to high electricity consumption, the presence of desalination facilities has put a lot of pressure on the electrical system. Therefore, a suitable energy supply system should be designed and operated so that in addition to guaranteeing high reliability, especially in peak load intervals, it also provides the required energy demand with the minimum possible cost.
2.2. Climatic Conditions of the Island
In order to design an efficient energy supply system, it is first necessary to collect and analyze the island’s climatic information. In the following, the changes in temperature, sunlight irradiation, and wind speed are presented.
2.2.1. Annual Temperature Information of the Island
According to the average monthly temperature of the island, which has been taken from [GlobalSolarAtlas], the lowest temperature occurs in January at 14°Celsius and the highest temperature on the island occurs in July and August at 33°Celsius. The annual average temperature of this island is about 24°Celsius. It should be noted that this island is located in the tropical climate group of Iran.
2.2.2. Annual Load-Demand Profile of the Island
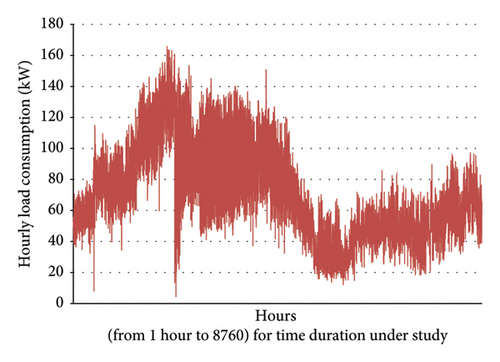
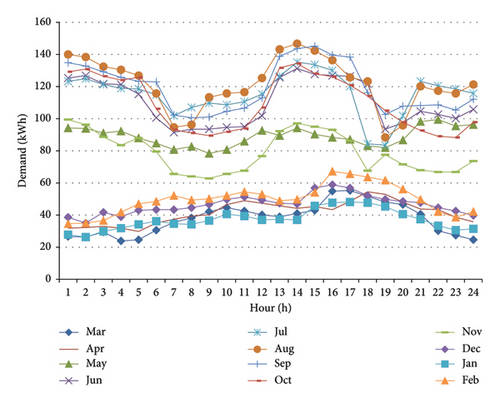
In order to extract data from the island’s electricity demand profile, several data loggers with a sampling rate of 30 minutes were installed on various island sites that record load consumption. Figure 2 shows the hourly load profile of the island during a year. It is evident that the electricity demand in the year’s warmer months is higher than in other months. The average hourly electricity consumption of the island is also shown in Figure 3. Moreover, the total power consumption of the island is approximately 690 MW-hours per year, which requires a reliable and functional design for the energy supply system. Furthermore, load growth should be considered in long-term planning. If the energy supply system designed for the island fails to respond to the load growth, the entire system will shut down. Consequently, the energy supply system design should have sufficient robustness to meet the worst case in load growth and fluctuations.
2.2.3. Solar Radiation and Wind Speed Information of the Island
One of the most important parameters to measure the potential of solar energy is the intensity of solar irradiation for each area, which is obtained based on the data reported in [GlobalSolarAtlas] for the islands. Peak sun hour (PSH) refers to the number of hours in a day when the intensity of solar radiation per square meter equals 1 kW. Solar energy potential is desired in areas where the PSH index is greater than 5 kWh/m2. The PSH index for the island is 6.1 kWh/m2, indicating that this island’s solar energy potential is appropriate.
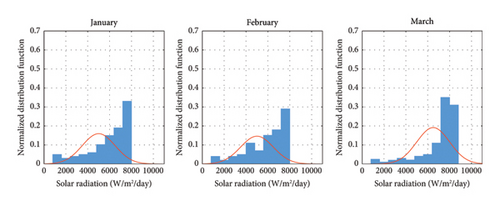
The stochastic method is used to model the uncertainty of sunlight irradiation by defining a normal probability density function (PDF), as shown in Figures 4, 5, 6, 7 for different years and seasons. By using radiation PDF diagrams, the uncertainty in the production of PV units is modeled. Moreover, Figure 8 shows the average monthly wind speed on the island.



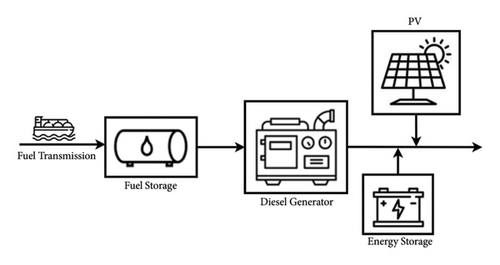
2.3. Proposed Configuration for HRES
- (1)
RER equipment: PVs;
- (2)
Fossil fuel-based equipment: diesel generator;
- (3)
ESSs equipment: electrical batteries to store electrical energy and fuel storage tanks (FSTs) to store fuel;
- (4)
Fuel transfer equipment: tanker and boats transporting fuel to land areas.
3. Problem Formulation
Equations (2)–(6) represent the cost of installing a diesel generator, PV, FSTs, and ESS, respectively. Moreover, IΩ is a binary decision variable, which is “1” if a unit has to be installed and CCΩ is the capital cost of each component. It should be noted that each device in the power supply system has a lifespan that is not necessarily the same. Batteries have a much shorter lifespan than other equipment and must be replaced several times during the entire project’s life (Y). In this paper, the battery life is considered to be three years, and only the replacement cost (RC) is considered. Furthermore, ir indicates the interest rate, which is calculated by ir = (i − f)/(1 + f), where i is the nominal interest rate and f represents the inflation rate. Equation (7) describes lost load cost which means the cost incurred by energy not supplied in the island for the lack of sufficient generation powers.
3.1. Operation, Maintenance, Transportation, and Replacement Cost (OMTRC)
3.2. PV Generation Capacity
3.3. Technical Constraints
There are several technical constraints for optimized equipment operation that need to be considered. In this section, these constraints will be examined and modeled mathematically.
3.3.1. Diesel Generator Constraints
3.3.2. Energy Storage Constraints
3.3.3. Fuel Balance Constraint
Equation (19) indicates that the volume of fuel output from the storage source equals the total fuel input to the fossil fuel-consuming equipment.
3.3.4. Fuel Supply Modeling and Fuel Source Constraints
3.3.5. Power Balance
3.4. Uncertainty Modeling
There are several parameters in this optimization problem whose uncertainty overshadows the optimal solutions. As mentioned in the previous section, by using radiation PDF diagrams, the uncertainty in the production of PV units has also been modeled in a robust way. In the following, other uncertainties will be examined.
3.4.1. Load Uncertainty
In the HRES optimization case, while the continually changing parameters are wind speed and solar radiation, the uncertainty issues are addressed from the resiliency point of view. By doing so, the HRES works optimally for the worst-case scenario.
The IGDT algorithm is implemented in this problem to model the uncertainty of the hourly load. IGDT is generally divided into two parts, risk seeker and risk averse. In this research, the risk-averse method is considered to be more suitable than another method. The IGDT approach, which is similar to the robust method, performs the same process for uncertain parameters, with the exception that it reduces the costs and ISO has more control over optimization.
The increase in β causes the higher value, and consequently, the amount of robustness also improves. The parameter β itself determines system robustness to the load uncertainty. It represents the percentage that the operator is willing to exceed the base amount for retrofitting purposes. The base value, on the other hand, refers to the cost of system energy supply under average load conditions without any uncertainty.
The IGDT algorithm is a robust optimization approach that does not require probabilistic information of uncertain variables, unlike other uncertainty modeling techniques such as stochastic programming or chance-constrained programming. Instead, it relies on a forecasted value and a deviation range for each uncertain variable and evaluates the performance of the system under different scenarios of uncertainty. The IGDT algorithm can handle two types of uncertainty set models, namely, the energy-bound model and the envelope-bound model.
We chose the IGDT algorithm over other uncertainty modeling techniques because it is more suitable for our problem, which involves multiple uncertainties related to load demand and fuel supply. These uncertainties are difficult to model with probabilistic methods, as they depend on various factors such as weather, market prices, and consumer behavior. Moreover, the IGDT algorithm allows us to capture both the robustness and the opportunity aspects of the decision-making process by using two objective functions, namely, the robustness function and the opportunity function. The robustness function measures the worst-case performance of the system under uncertainty, while the opportunity function measures the best-case performance of the system under uncertainty. By optimizing these two functions simultaneously, we can find a tradeoff between risk-aversion and risk-seeking behaviors and select the most desirable solution for our problem.
The IGDT algorithm has some assumptions and limitations that should be addressed. One assumption is that the forecasted value and the deviation range of each uncertain variable are known or estimated by the decision-maker. This may not always be the practice case and may introduce some errors or biases in the uncertainty modeling. Another limitation is that the IGDT algorithm may not be able to handle nonlinear or nonconvex problems, as it relies on linear programming or convex programming techniques to solve the optimization problems. Therefore, some approximations or transformations may be needed to apply the IGDT algorithm to more complex problems.
-
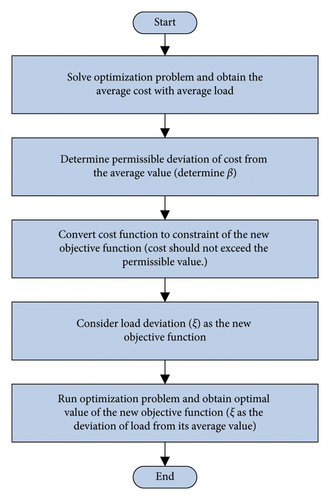
Step 1: solve optimization problem and obtain the average cost with average load:
-
In this step, we solve the original optimization problem of minimizing the total cost of the HRES design, assuming that the load demand is equal to its average value. The average value of the load demand is obtained from the historical data or the forecasted value. The total cost includes the capital cost, the operation and maintenance cost, and the fuel cost of the HRES components. The optimization problem is subject to some constraints, such as the power balance constraint and the capacity constraint. The decision variables include the sizes and operation modes of the HRES components, such as the diesel generator and the battery. The total cost function is a nonlinear function that depends on the decision variables and the uncertain parameters, such as the fuel price and the wind speed. The optimal solution to this problem gives us the minimum average cost and the corresponding optimal design of the HRES.
-
Step 2: determine permissible deviation of cost from the average value (determine β):
-
In this step, we determine the permissible deviation of the total cost from the average value, denoted by β. The value of β represents the risk preference of the decision-maker, and it can be chosen based on some criteria, such as the budget limit, the confidence level, and the expected value of perfect information. The value of β can be expressed as a percentage of the average cost or as an absolute value. The value of β reflects how much the decision-maker can tolerate the uncertainty of the total cost, and it affects the robustness and the opportunity of the HRES design.
-
Step 3: convert cost function to constraint of the new objective function (cost should not exceed the permissible value):
-
In this step, we convert the total cost function from the original objective function to a constraint of the new objective function. The new constraint is that the total cost should not exceed the permissible value, which is the sum of the average cost and the deviation β. This constraint ensures that the HRES design is robust against the uncertainty of the total cost and that the cost does not exceed the budget limit or the risk preference of the decision-maker.
-
Step 4: consider load deviation (ζ) as the new objective function:
-
In this step, we consider the load deviation (ζ) as the new objective function. The load deviation is the difference between the actual load demand and the average load demand, and it represents the uncertainty of the load demand. The new objective function is to minimize the load deviation, which means finding the HRES design that can meet the load demand with the least deviation from the average value. The load deviation function is a nonlinear function that depends on the decision variables and the uncertain parameters, such as the wind speed and the fuel supply. The new objective function reflects the opportunity aspect of the HRES design, as it tries to find the design that can take advantage of the favorable scenarios of the load demand.
-
Step 5: run optimization problem and obtain optimal value of the new objective function (ζ as the deviation of load from its average value):
-
In this step, we run the optimization problem with the new objective function and the new constraint and obtain the optimal value of the load deviation and the corresponding optimal design of the HRES.
The optimal solution to this problem gives us the minimum load deviation and the corresponding optimal design of the HRES, which is both robust and opportunistic under uncertainty. The optimal solution also gives us the optimal value of the robustness function and the opportunity function. The robustness function measures the worst-case performance of the HRES design under uncertainty, while the opportunity function measures the best-case performance of the HRES design under uncertainty. By optimizing these two functions simultaneously, we can find a tradeoff between risk-aversion and risk-seeking behaviors and select the most desirable solution for our problem.
3.4.2. Fuel Supply Uncertainty
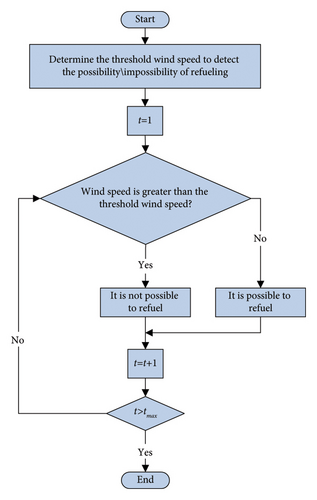
In the above equation, Vm is a large number that can be represented as the highest wind speed occurred in island, and Vth is the wind speed threshold to measure the ability of boats to move towards the island. If the wind speed per hour (Vt) is less than Vth, the boat can move to the island for refueling. In this case, the value of the upper limit in (34) is greater than 1 and xt, which is a binary variable, can be equal to zero or 1. Nevertheless, if the wind speed is higher than Vth, this causes greater sea wave fluctuations, which can stop fuel transfer of boats. In this case, the value of the upper limit in (34) will be less than one and the value of xt will be equal to zero. According to the data collected in the past, if the maximum wind speed occurring per hour is represented by Vt, then the worst case is considered for refueling and the HRES should somehow be robust to the fuel uncertainty.
3.4.3. Monte Carlo Simulation
To generate the data of different scenarios as input to the Monte Carlo method, the actual and practical historical results recorded and measured on the island were used for the uncertain variables. These results reflect the real-world conditions and uncertainties that affect the load demand and fuel supply on the island.
A normal probability distribution curve was fitted to these results, and this fitted function was used to sample random values of the uncertain variables. These values were then used to generate scenarios of uncertainty in the Monte Carlo simulation. The normal distribution was chosen because it is a common and simple way to model uncertainty, and it fits well with our data.
-
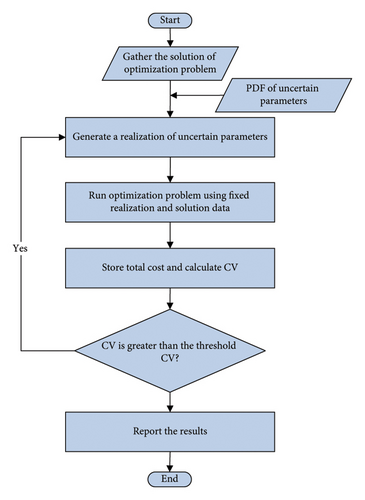
Step 1: gather obtained solutions: the initial step of the algorithm involves collecting the solutions of the optimization problem. These solutions, generated by deterministic or stochastic models, are considered fixed, reflecting the outcomes of decisions made within these models. These fixed solutions are used as reference points for subsequent analyses.
-
Step 2: generate a realization of uncertain parameters: The algorithm proceeds by generating a realization of the uncertain parameters. The PDFs of these parameters are employed to generate stochastic realizations, encompassing a range of possibilities and capturing the probabilistic nature of these parameters.
-
Step 3: run optimization problem using fixed uncertain parameters: for each set of fixed generated realizations of uncertain parameters, the optimization problem is solved. The realizations are paired with the solution data, allowing for the evaluation of the objective function in a realization scenario. This simulation of the optimization problem under specific instances of parameter uncertainty yields total cost values.
-
Step 4: store total cost and calculate CV: upon each run of the optimization problem, the algorithm records the associated total cost. Subsequently, it calculates the CV for the stored total cost values. The CV is computed as the ratio of the standard deviation to the mean of these values, offering a quantitative measure of result variability.
-
Step 5: check stop criteria: the algorithm assesses whether the calculated CV exceeds a predetermined threshold value. If the CV surpasses this threshold, it suggests that the results remain highly variable. Consequently, the algorithm returns to step 2, reiterating the process of generating realizations to enhance the stability and reliability of the results.
-
Step 6: report final results: when the CV falls below or equals the threshold, the algorithm proceeds to report the final results. The primary outcome is the estimated expected total cost, derived from the mean of the stored total cost values. This result encapsulates the expected performance of the optimization problem under the influence of uncertain parameters.
4. Simulation Results and Discussion
The electrical load data are given in Section 2. These data are taken as the expected values of electric charge in the simulation. Also, considering the technical challenges of synchronizing the different diesel generators, only one type of diesel generator was used. Therefore, it is recommended to install a diesel generator that can provide all the required power. For this reason, a 400 kVA generator was used in the simulation. PV panels with 1 kW and battery units with 200 Ah were used for planning since the manufacturer provide these common capacities for the corresponding units on the island. The problem is simulated using GAMS software and Mixed Integer Programming (MIP) modeling. The data used can be found in Table 2. In addition, the data utilized in this article’s simulation have been uploaded to Google Drive and are accessible via link [54]
| Parameter | Value | Unit |
|---|---|---|
| αDiesel | 0.53 | Liter/kW |
| βDiesel | 0 | Liter/kW |
| 325 | kW | |
| FIn | 50000 | Liter |
| cT | 13.7 | Cent/liter |
| PSTC | 3 | kW |
| GSTC | 1000 | W/m2 |
| KMPT | −0.004 | — |
| 0 | kW | |
| 325 | kW | |
| σES | 0.0001 | — |
| ηES | 0.93 | — |
| 6 | kW | |
| 12 | kW | |
| υl | 0.125 | — |
| CCDiesel | 42500 | $ |
| CCPV | 194 | $ |
| CCES | 172 | $ |
| CCFS | 1690 | $ |
| i | 15 | % |
| f | 20 | % |
| Y | 10 | Year |
| λ | 1.9 | Cent |
| 5.6 | Cent/kW | |
| 0 | kW | |
| 3.6 | kW | |
| 0 | kW | |
| 3.6 | kW | |
| υFS | 80000 | Liter |
| υu | 1 | — |
4.1. Simulation Results without considering Uncertainty
As mentioned in the previous section, the current way to supply energy to the island is only through diesel generators. Therefore, the optimal sizing of RERs should be designed to achieve maximum energy supply cost reduction. The island’s demand is considered constant according to Figure 3. It is also assumed that there are no restrictions on refueling by fuel-carrying tankers. All the equations provided in the previous section have been coded and executed by GAMS software. The simulation results are shown in Table 3. A comparative analysis is conducted between the costs of energy supply for fuel consumption in the current state (nonoptimal) and the optimal state.
| Current system (only diesel generator) | Proposed system (optimized by RERs) | Saving rate | |
|---|---|---|---|
| Total cost ($) | 95590 | 79422 | 17% |
| Investment cost ($) | 0 | 20260 | — |
| Operation costs ($) | 95590 | 59162 | 38% |
| Fuel costs ($) | 50049 | 30976 | 38% |
| Diesel generator maintenance costs ($) | 45541 | 28186 | 38% |
| Fuel consumption (liter/year) | 365324 | 226104 | 38% |
| Refueling frequency (times per year) | 8 | 5 | 38% |
| PV investment cost ($) | — | 19400 | — |
| Energy storage investment cost ($) | — | 860 | — |
| Number of PVs (1 kW) | — | 100 | — |
| Number of ESs (200 Ah) | — | 5 | — |
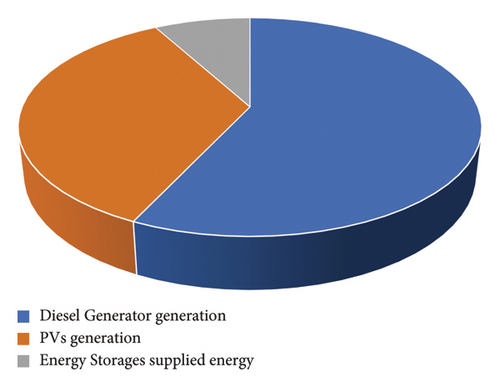
| Diesel generator generation (kWh) | 689292 (100%) | 426612 (57%) | 43% |
| PV generation (kWh) | — | 262680 (35%) | — |
| Energy storage generation (kWh) | — | 60204 (8%) | — |
| Cost of energy supply (cent per kwh) | 13.9 | 7.9 | 43% |
As it is clear from Table 3, the current operating cost of the system (nonoptimal) is 95590$. This cost is prohibitive and indicates the need to use RERs equipment. However, with installing the PVs, the operating cost is reduced to 59162$, representing a 38% reduction. Similarly, fuel consumption decreases from 365324 to 226104 liters per year, indicating an approximate 38% reduction. In the existing configuration, based on the field information obtained from the island, the frequency of refueling per year is currently 24 times. However, by reassessing and reevaluating the current situation, it can be reduced to 8 times annually. Refueling in the current configuration occurs in a nonoptimal manner on the 1st, 29th, 74th, 116th, 162nd, 217th, 277th, and 338th days of the year while refueling takes place in on the 1st, 75th, 134th, 245th, and 333rd days of the year in the optimal configuration. Therefore, the refueling number decreases from 8 to 5, which reduces the island’s dependence on refueling by fuel-carrying ships.
On the other hand, if we want to examine the amount of profit over a 10-year horizon, the annual inflation rate must be considered. Table 4 compare the system costs over a 10-year horizon.
| Year | Current system (only diesel generator) | Proposed system (optimized by RERs) | Saving rate (%) |
|---|---|---|---|
| 1 | 95590 | 79422 | 17 |
| 2 | 114708 | 70994 | 38 |
| 3 | 137650 | 85193 | 38 |
| 4 | 165180 | 102232 | 38 |
| 5 | 198215 | 122678 | 38 |
| 6 | 237859 | 147214 | 38 |
| 7 | 285430 | 176657 | 38 |
| 8 | 342516 | 211988 | 38 |
| 9 | 411020 | 254386 | 38 |
| 10 | 493223 | 305263 | 38 |
| Total | 2481390 | 1555168 | 37 |
As can be seen, total costs over a 10-year horizon are reduced by about 38%. According to numerical results, the initial investment cost to enhance the island’s existing energy supply system is expected to yield a return on capital in approximately 3 years. This signifies significant cost savings in the energy supply expenses, primarily attributable to the utilization of RESs. In the forthcoming section, we will conduct system simulations to account for load uncertainties and analyze the resulting outcomes.
According to Table 4, the 10-year horizon cash flow diagram is drawn in Figure 13 according to the savings made in each year and the investment cost of the first year. As it can be deduced from the figure, the return on investment happens very quickly.
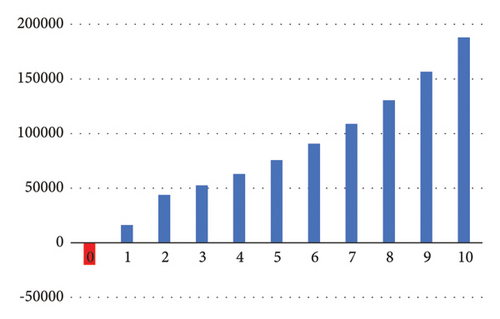
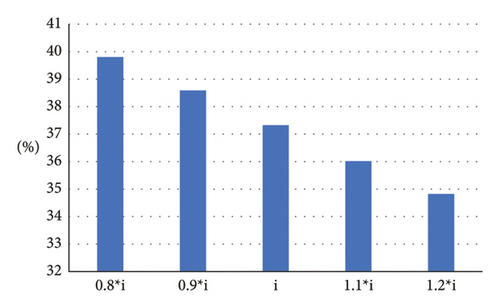
Figure 14 illustrates how inflation affects the savings rate. The proposed system clearly becomes more economical as inflation decreases. However, even at high levels of inflation, savings are achieved. This analysis aims to demonstrate the impact of inflation on the savings rate.
4.2. Simulation Results considering Load Uncertainty
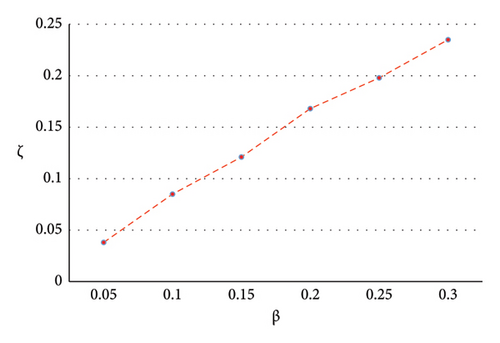
Although the previous simulations assumed a constant load for the HRES design, the assumption for this island is not very accurate, according to the load profile diagram. In addition, ongoing development projects on the island will increase the current load profile. As stated before about the IGDT, the robustness degree of HRES against the load uncertainty parameter is determined by the β parameter. β is the percentage of total costs that the operator is willing to pay more than the base amount for robustness. The base case denotes the cost of supplying the system with average load in deterministic manner, obtained in the previous section. In this section, the problem is simulated for different values of β and the results are categorized in Table 5. It is observed in Figure 15 that β increases by the increase in α value. This means that the operator’s eagerness to pay more than the base-case value increases the robustness level. For example, if the operator is willing to pay 20% more to supply the island over a 10-year horizon, the system will be 16.8% more robust against load variation.
| Results | β | |||||
|---|---|---|---|---|---|---|
| 0.05 | 0.1 | 0.15 | 0.2 | 0.25 | 0.3 | |
| ζ (convergence radius of load) | 0.038 | 0.085 | 0.121 | 0.168 | 0.198 | 0.235 |
| Number of diesel generators (400 kVA) | 1 | 1 | 1 | 1 | 1 | 1 |
| FST (liter) | 80000 | 80000 | 80000 | 80000 | 80000 | 80000 |
| Total cost ($) | 83393 | 87364 | 91335 | 95306 | 99278 | 103249 |
| Investment cost ($) | 63887 | 67276 | 70731 | 75218 | 78158 | 83809 |
| Fuel consumption cost ($) | 33449 | 35224 | 37033 | 39383 | 40922 | 43880 |
| Diesel generator maintenance cost ($) | 30437 | 32052 | 33698 | 35836 | 37236 | 39928 |
| Fuel consumption (liter/year) | 244160 | 257113 | 270317 | 287466 | 298698 | 320295 |
| PV investment cost ($) | 18818 | 19400 | 19400 | 19400 | 19400 | 18236 |
| Energy storage investment cost ($) | 688 | 688 | 1204 | 688 | 1720 | 1720 |
| Number of PVs (1 kW) | 97 | 100 | 100 | 100 | 100 | 94 |
| Number of energy storages (200 Ah) | 4 | 4 | 7 | 4 | 10 | 7 |
| Refueling frequency (times per year) | 5 | 6 | 6 | 6 | 6 | 7 |
| Cost of energy supply (cent per kWh) | 10.9 | 11.0 | 10.7 | 11.2 | 10.6 | 11.1 |
| Diesel generator generation (kWh) | 460679 | 485118 | 510032 | 542388 | 563582 | 604331 |
| PV generation (kWh) | 254799 | 262680 | 262680 | 262680 | 262680 | 246919 |
| Supplied energy by energy storages (kWh) | 45876 | 45991 | 79073 | 45887 | 113909 | 80103 |
| Contribution of diesel generator in energy supply | 61% | 61% | 60% | 64% | 60% | 64% |
| Contribution of PVs in energy supply | 33% | 33% | 31% | 31% | 28% | 27% |
| Contribution of energy storages in energy supply | 6% | 6% | 9% | 5% | 12% | 9% |
4.3. Simulation Results considering Load and Fuel Uncertainty
On the understudy island, the required fuel for diesel generators is transported by large ships or boats. As mentioned, the movement of ships depends on wind speed and sea waves. According to the literature, refueling will not be possible if the wind speed is greater than 4.7 m/s(17 km/h). Therefore, as shown in Figure 8, refueling is not possible on the island from November to March, or it is difficult and associated with expensive charges. In this case, it is needed to design an energy supply system for the island that does not require refueling from November to March. In other words, the power supply system will be resilient to fuel uncertainty during these months.
Table 6 shows the results of this scenario. It is observed that, despite the impossibility of refueling in the last months of the year, the diesel generator still plays a key role in the energy supply system. Therefore, the volume of the fuel tank should be increased, and it has to be filled with 100% of its capacity before reaching November. In the last months of the year, the diesel generator will provide a small system load, but most of the load will be provided by PV panels and batteries.
| Results | β | ||
|---|---|---|---|
| 0 (without load uncertainty) | 0.1 | 0.2 | |
| ζ (convergence radius of load) | 0 | 0.065 | 0.065 |
| Number of diesel generators (400 kVA) | 1 | 1 | 1 |
| FST (liter) | 80000 | 80000 | 80000 |
| Total cost ($) | 81124 | 87364 | 95306 |
| Operation cost (fuel & DG) ($) | 63169 | 65384 | 65415 |
| Fuel consumption cost ($) | 33074 | 34234 | 34250 |
| Diesel generator maintenance cost ($) | 30095 | 31150 | 31165 |
| Fuel consumption (liter/year) | 241419 | 249882 | 249997 |
| PV investment cost ($) | 17266 | 19400 | 19400 |
| Energy storage investment cost ($) | 688 | 2580 | 10492 |
| Diesel generator generation (kWh) | 455507 | 471475 | 471693 |
| PV generation (kWh) | 233785 | 262680 | 262680 |
| Supplied energy by energy storages (kWh) | 51134 | 148829 | 307130 |
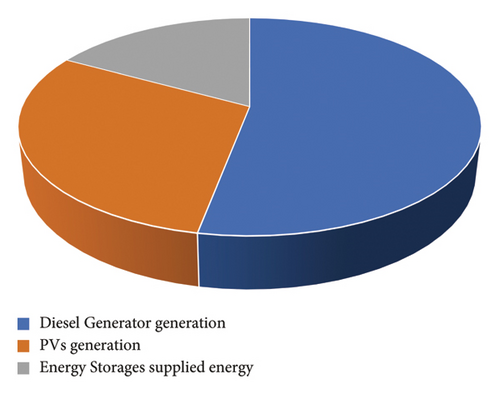
| Contribution of diesel generator in energy supply | 61% | 53% | 46% |
| Contribution of PVs in energy supply | 32% | 30% | 25% |
| Contribution of energy storages in energy supply | 7% | 17% | 29% |
| Number of PVs (1 kw) | 89 | 100 | 100 |
| Number of energy storages (200 Ah) | 4 | 15 | 61 |
| Refueling frequency (times per year) | 5 | 5 | 5 |
As explained in Section 3.4.3, a huge number of scenarios are generated using the obtained PDFs of uncertain parameters. The PDFs were obtained from the practical data of the island. An out-of-sample analysis is carried out to evaluate the performance and reliability of a proposed model. This analysis is of high importance in the stochastic optimization problem to evaluate how well the proposed model performs when confronted with new and unseen instances of random parameters. To do so, the proposed model is applied to out-of-sample data, which could include different realizations of uncertain parameters or scenarios not previously encountered based on the PDFs of uncertain parameters. In Figure 16, the outcomes of the out-of-sample analysis are presented, encompassing different values of the coefficient of variation (CV).
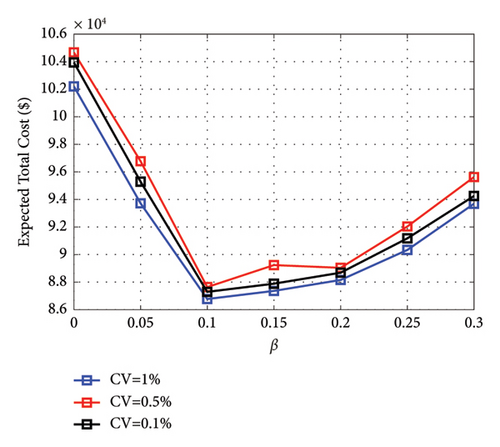
The choice of β affects the tradeoff between robustness and operational costs, as it determines the permissible deviation of the total cost from the average value. A larger β means a higher tolerance for cost uncertainty and lower robustness of the HRES design. A smaller β means a lower tolerance for cost uncertainty and a higher robustness of the HRES design. However, higher robustness also implies a higher operational cost, as the HRES design has to be more conservative and less opportunistic to cope with the worst-case scenario of uncertainty. Therefore, there is a tradeoff between robustness and operational costs, and the optimal choice of β depends on the risk preference of the decision-maker and the characteristics of the problem.
Notably, the deterministic model, denoted by β = 0, exhibits the highest expected cost, primarily attributed to its disregard of inherent uncertainties. In contrast, all hybrid stochastic/IGDT models manifest superior results when juxtaposed with the deterministic model. Among these hybrid models, the configuration with robustness budget factor (β = 0.1) yields the lowest expected cost. Subsequently, a heightened robustness budget factor (β) corresponds to an increase in the expected cost, albeit bolstering the model’s robustness and its capacity to yield robust solutions in the face of uncertainties. Consequently, a compromise must be struck between the pursuit of robustness and the associated operational costs. As discerned in Figure 16, a robustness budget factor of β = 0.1 emerges as the optimal solution in terms of the expected cost.
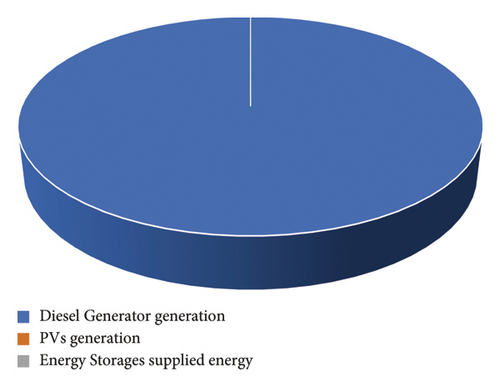
Also, as shown in Figure 17, the share of diesel generator generation compared to renewable energy sources has decreased due to the optimization in the proposed system. In the current configuration, the diesel generator is the sole provider of energy, bearing the entire burden of power supply. However, in the proposed configuration without considering uncertainties, PVs contribute 35% to energy provision, while batteries account for 8%. When uncertainties are factored in, the proposed configuration further diminishes the diesel generator’s share, with PVs delivering 30% and batteries increasing their contribution to 17% of the total energy supply. This shift underscores the effectiveness of the proposed model in integrating renewable sources and enhancing the sustainability of the energy system.
5. Conclusion
This study presented a comprehensive model for energy optimization of an HRES in the Persian Gulf remote-area islands. In the first step, the simulation results were obtained while ignoring the load and fuel uncertainty. It was observed that the installation of solar panels and batteries significantly reduced energy supply costs by 43% compared to the current situation and created significant economic savings for the operator. In the second step, the simulation results were analyzed by considering the uncertainty of load and fuel. This case aims to increase the security of the energy supply and strengthen the system against uncertain parameters. It was found that the consumed fuel amount and the number of refueling times had an approximate 38% reduction, validating that the proposed model is desirable. Furthermore, it was shown that the β variation was in the same direction as ζ (convergence radius of load), as both increased together. This implies that the higher the uncertainty level, the larger the convergence radius of load and thus the more robust the system. It has also been observed that the use of renewable equipment and storage devices has reduced the total cost by 38%, and considering uncertainties has led to an increase in system robustness along with reduction in expected total cost by 16%. To account for different uncertainty scenarios, the β value was calculated for different strategies using the Monte Carlo method, which is a measure of the increase in investment. The optimal value of β was found to be 0.1, which minimizes the expected total cost and maximizes the system performance. It is imperative to note that the practical implementation of the proposed optimal planning rests with the system operator. This plan encompasses stated benefits and challenges that must be considered. Finally, the outcomes expressed that the diesel generator’s existence in an HRES is of importance despite the impossibility of refueling in the last months of the year. This is because the HRES system faces the challenge of having uncertain power output from renewable energy sources. Considering the uncertainties mitigate this challenge, but it still remains. The presence of the diesel generator is due to this challenge. Moreover, the uncertainty in power generation can lead to increased technical constraints and increased cost of unsupplied energy. Therefore, it is necessary to optimize the operation and planning of the HRES system under uncertain conditions. The proposed model was compared with the deterministic approach (without uncertainty) and showed better results in terms of cost, fuel, and robustness.
- (1)
Considering the space constraint for solar panels: the installation of solar panels requires a large area of land or roof, which may not be available or feasible in some locations. Therefore, it is necessary to investigate the optimal design and layout of solar panels under space constraints and to evaluate the tradeoff between solar power generation and land use.
- (2)
Modeling the thermal and cooling loads: the HRES system can also provide heating and cooling services to buildings or facilities, improving energy efficiency and comfort levels. However, the thermal and cooling loads are affected by many factors, such as weather, occupancy, and building envelope. Therefore, it is necessary to develop accurate and reliable models for the thermal and cooling loads and to integrate them into the HRES optimization model.
- (3)
Using CHP or CCHP for energy supply: combined heat and power (CHP) or combined cooling, heat, and power (CCHP) are technologies that can produce electricity, heat, and cooling simultaneously from a single fuel source, such as natural gas, biogas, or biomass. These technologies can enhance energy utilization and reduce greenhouse gas emissions. Therefore, it is necessary to explore the feasibility and potential of using CHP or CCHP for the HRES system and to compare their performance with the conventional diesel generator [55].
Indices
-
- d:
-
- Index of each type of diesel generators
-
- k:
-
- Index of each unit of equipment
-
- t:
-
- Time index
Sets
-
- Diesel:
-
- Diesel generators
-
- ES:
-
- Electricity energy storage units or batteries
-
- FS:
-
- Fuel storage units
-
- PV:
-
- Photovoltaic solar panels
-
- Ω:
-
- Equipment type where Ω ∈ {Diesel, ES, FS, PV}
Parameters and Variables
-
- CT:
-
- Fuel transfer costs ($)
-
- :
-
- Repair cost of diesel generator type d ($)
-
- :
-
- Operation and maintenance cost of diesel generator ($)
-
- cT:
-
- Fuel transfer cost per liter ($/liter)
-
- CCΩ:
-
- Capital cost of the equipment ($)
-
- :
-
- Input power of battery k at time t(kW)
-
- :
-
- Minimum and maximum of input power to the battery (kW)
-
- :
-
- Stored power of battery k at time t(kW)
-
- :
-
- Minimum and maximum of battery power (kW)
-
- :
-
- Output power of battery k at time t(kW)
-
- :
-
- Minimum and maximum of battery output power (kW)
-
- LCC:
-
- Lost load cost ($)
-
- :
-
- Fuel volume stored at the fuel storage source per hour t(liter)
-
- FIn:
-
- Refueling capacity of fuel transmission equipment (liter)
-
- :
-
- The volume of output fuel of the fuel storage source at time t(liter)
-
- f:
-
- Inflation rate
-
- GSTC:
-
- Irradiance under standard conditions (W/m2)
-
- Gt:
-
- Irradiance at time t(W/m2)
-
- IΩ:
-
- Binary/decision variable for the equipment, IΩ ∈ {0, 1}
-
- i:
-
- Interest rate
-
- IC:
-
- Total installation cost ($)
-
- ICΩ:
-
- Installation cost of the equipment ($)
-
- KMPT:
-
- Panel temperature coefficient
-
- :
-
- Electrical load at time t(kW);
-
- LCt:
-
- Load curtailed at time t(kW);
-
- OMTRC:
-
- Operation, maintenance, transportation, and replacement cost ($);
-
- :
-
- Output power of diesel generator equipment k with type d at time t(kW);
-
- :
-
- Output power of PV equipment k at time t(kW)
-
- :
-
- Minimum and maximum power of diesel generator with type d(kW)
-
- :
-
- Rated power of diesel generator with type d(kW)
-
- PSTC:
-
- Panel output power in standard conditions (kW)
-
- Ta:
-
- Ambient temperature (°C)
-
- TC:
-
- Standard temperature (°C)
-
- TC:
-
- Total cost ($)
-
- VM:
-
- Maximum wind speed in the area (m/s)
-
- Vt:
-
- Wind speed at the time t(m/s)
-
- Vth:
-
- Threshold wind speed for refueling at the sea site (m/s)
-
- VOLL:
-
- Value of lost load ($/kW)
-
- xt:
-
- Binary/decision variable for refueling, xt ∈ {0, 1}
-
- :
-
- Fuel curve coefficients of diesel generator with type d
-
- ϵl, ϵu:
-
- Lower and upper limits of fuel volume in the fuel storage source (liter)
-
- ηES:
-
- Battery energy storage efficiency
-
- λ:
-
- Fuel price ($/liter)
-
- σES:
-
- Battery self-discharge coefficient
-
- τ:
-
- Net present value ($)
-
- υFS:
-
- The volume of each fuel storage unit (liter).
Conflicts of Interest
The authors declare that there are no conflicts of interest.
Open Research
Data Availability
The numerical data used to support the findings of this study are included within the paper.


