Mortality Prediction in COVID-19 Using Time Series and Machine Learning Techniques
Abstract
Predicting mortality in COVID-19 is one of the most significant and difficult tasks at hand. This study compares time series and machine learning methods, including support vector machines (SVMs) and neural networks (NNs), to forecast the mortality rate in seven countries: the United States, India, Brazil, Russia, France, China, and Bangladesh. Data were gathered between December 31, 2019, when COVID-19 began, and March 31, 2021. The study used 457 observations with 4 variables: daily confirmed cases, daily deaths, daily mortality rate, and date. To predict the death rate in the seven countries that were chosen, the data were analyzed using time series analysis and machine learning techniques. Models were compared to obtain more accurate mortality predictions. The autoregressive integrated moving average (ARIMA) model with the lowest AIC value for each nation is found through time series analysis. By increasing the hidden layer and applying machine learning techniques, the NN model for each country is chosen, and the optimal model is determined by determining the model with the lowest error value. Additionally, SVM analyzes every country and calculates its R2 and root-mean-square error (RMSE). The lowest RMSE value is used to compare all of the time series and machine learning models. According to the comparison table, SVM provides a more accurate model to predict the mortality rate of the seven countries, with the lowest RMSE value. During the study period, mortality rates increased in Brazil and Russia and decreased in the United States, India, France, China, and Bangladesh, according to the comparison value of RMSE in this study. Furthermore, this paper shows that SVM outperforms all other models in terms of performance. According to the author’s analysis of the data, SVM is a machine learning technique that can be used to accurately predict mortality in a pandemic scenario.
1. Introduction
Most of the severe global public health anxiety is the 2019 new coronavirus outbreak [1]. The COVID-19 virus is a novel pathogen that belongs to the same virus family as SARS and several strains of the common cold. In Wuhan City, China, there have been cases of pneumonia with no known cause as of December 31, 2019, according to World Health Organization (WHO). Chinese authorities determined a brand-new coronavirus, 2019-nCoV, to be the culprit on January 7, 2020. On February 11, 2021, the WHO officially declared COVID-19 and SARS-CoV-2. Worldwide, 430,257,564 identified COVID-19 occurrences, comprising 5,922,049 deaths, have been reported to WHO as of 4:39 p.m. Central European Time (CET), February 25, 2022. About 10,407,359,583 doses of vaccine have been given as of February 20, 2022 [2]. Predictions of the mortality rate are very crucial all over the world. Mortality data are frequently used as a foundation in public health programs and policies that aim to avoid or minimize premature mortality rates and enhance our quality of life. This study postulates a mortality rate prediction over seven countries, the United States, India, Brazil, France, Russia, China, and Bangladesh, using time series and machine learning techniques. This study includes two types of countries: The first five were selected for their vulnerability during the COVID-19 pandemic, while China and Bangladesh were included for specific reasons—China, where the virus first emerged in Wuhan, and Bangladesh, where the author, who is from Bangladesh, wanted to examine the experiences of its people during the pandemic, which also saw a rising mortality rate. Data are collected from the initial stage of COVID-19, December 31, 2019, through March 31, 2021, for each country. Due to a sharp increment in the claim for medical funds, a dearth of hospital beds with troublesome care materials for the immediate care of unwell patients, and demands that have outpaced their capacity, hospitals are facing tremendous challenges. These numbers are also rising quickly every day. Furthermore, precise and efficient patient triaging is difficult because the COVID-19 clinical spectrum lies from an asymptomatic condition to acute viral pneumonia with respiratory failure and even death [3]. This real-world issue is comparable to demand forecasting, a predictive analysis used to improve supply and business management decisions by estimating customer demand. The study’s supply is the government and the health sector, while the customer demand is the COVID-19 parameters (number of cases, deaths, and/or recovered). When making decisions, demand forecasting is essential. The predicted outcomes determine how effective a decision is [4]. To get accurate and timely results, machine learning techniques and image processing methods are frequently employed in diagnostics. One noteworthy innovation that has shown promise is the application of machine learning, particularly convolutional neural network (NN) (CNN)–based architecture [5]. Millions of people worldwide have had their lives severely disrupted by COVID-19, and this situation is still unrelenting. It remains a major concern even after the introduction of COVID-19 vaccines that are effective, and more than half of the population has received vaccinations. Machine learning has demonstrated its importance in nearly every field, and researchers are actively using its techniques to combat COVID-19 with encouraging results [6]. Social solutions, such as global lockdowns, social distancing, mall, university, and school closures, travel restrictions, border closures, and others, have been considered in many countries due to the coronavirus’s high growth rate and rapid transmission. The purpose of these remedies is to lower mortality and the spread of disease [7]. Deep NNs (DNNs) have been widely applied for detecting COVID-19 in medical images [8]. To enhance COVID-19 detection through artificial intelligence and generative adversarial networks (GANs), many researchers have proposed a semisupervised classification approach that utilizes limited labelled data (SCLLD) to facilitate automated COVID-19 detection [9]. To compare long short-term memory (LSTM), Conv-LSTM, and GRU with their bidirectional extensions, in-depth is the driving force behind this study. Also, it appears from the literature currently in publication that Bi-GRU and Bi-Conv LSTM have never been applied as COVID-19 time series data predictors [10]. Owing to COVID-19’s pandemic nature, automated tools for the disease’s clinical diagnosis are greatly desired. On image datasets, convolutional NNs (CNNs) have demonstrated exceptional classification performance [11]. Chest radiography and computed tomography (CT) scans of the lungs can be used by artificial intelligence techniques to potentially achieve high diagnostic performance for COVID-19 diagnosis [12]. This paper postulated that a machine learning score based on data-driven feature selection, distinct from inference statistics, could capture nonlinear relationships between clinical features without human bias and predict mortality for specific patients more precisely than the risk scores currently available [3]. It is extremely valuable to have a COVID-19 mortality prediction model that is only based on the daily confirmed cases and daily deaths in the seven most vulnerable countries in the world. Such a model has a wide range of advantages. At the personal level, this can support telemedicine for patients who have tested positive and alert individuals who have not contracted COVID-19 of the risk they might pose, enabling them to take preventative actions. It can be used to put intelligent lockdown strategies into place at the federal level [8]. As of March 2021, several vaccinations have received regulatory approval from several governmental businesses. However, considering that the entire population must be immunized against COVID-19 and that it is doubtful that everyone can receive the vaccine by 2021 due to production constraints, the existing preventive measures must remain in place [13]. The main aim of a research paper is highlighted in its objective. The main objectives of this study are to establish a mortality rate model as machine learning techniques like support vector machines (SVMs) and NNs and time series analysis (ARIMA model), compare the model, and find out the better prediction model for the mortality rate prediction to evaluate the condition of the seven selected vulnerable countries.
2. Literature Overview
The most comprehensive study related to the various parameters that have a review of the literature provides a detailed explanation of the impact on the clinical course and management of COVID-19 [14]. A machine learning technique for mortality prediction in COVID-19 pneumonia has been discussed by Drs. Gaza Halasz, Michela Sperti, Matteo Villain, Umberto Michelucci, Pier Giuseppe Agostoni, Andrea Biagi, Elisabetta Salvioni, Massimo Mapelli, Marco Agostino Deriu, and Dario Piga, among other medical professionals. Massimo Piepoli developed and evaluated the Piacenza score. The Piacenza score exhibited an area under the receiver operating characteristic curve (AUC) of 0.78 (95% CI 0.74–0.84, Brier score = 0.19) in the internal validation cohort and 0.79 (95% CI 0.68–0.89, Brier score = 0.16) in the external validation cohort, showing a comparable accuracy with respect to the 4C score and to the naïve Bayes model with a priori chosen features; this achieved an AUC of 0.78 (95% CI 0.73–0.83, Brier score = 0.26) and 0.80 (95% CI 0.75–0.86, Brier score = 0.17), respectively. They have exhibited and tested trustworthy ML patterns that might be applied to augur the warning of COVID-19 patients [3]. Data Analysis and Forecasting of COVID-19 Pandemic in Kuwait Based on Daily Observation and Basic Reproduction Number Dynamics was proposed in 2021 by Oshinubi et al. and demonstrated that support vector regression (SVR) has achieved the best performance for prediction while a simple exponential model without trend gives good optimal results for forecasting of Kuwait COVID-19 data [15]. Time Series Predicting of COVID-19 Based on Deep Learning has been proposed by Alassafi, Jarrah, and Alotaibi and illustrated a deep learning (DL) approach that includes recurrent NN (RNN) and LSTM networks for predicting the probable numbers of COVID-19 cases. The LSTM models showed a 98.58% precision accuracy while the RNN models showed a 93.45% precision accuracy. Also, this study compared the number of coronavirus cases and the number of resulting deaths in Malaysia, Morocco, and Saudi Arabia. Then, predict the number of confirmed COVID-19 cases and deaths for the following 7 days [16]. Cloud-Based Framework for COVID-19 Detection Through Feature Fusion With Bootstrap Aggregated Extreme Learning Machine proposed by Khan et al. illustrated that the COVID-Xray-5k dataset serves as a benchmark for evaluating the suggested cloud-based model. For training and testing, we selected 504 and 100 COVID-19 images, respectively. Ultimately, for training and testing, 2000 and 1000 images are chosen from the non-COVID-19 category. About 95.7% accuracy on average was attained by the model [5]. Analysis of machine learning model, titled A Machine Learning Based Exploration of COVID-19 Mortality Risk, was developed by Mahdavi et al. Three prognostic machine learning models were developed using the aforementioned invasive and noninvasive biomarker groups: two using each of these groups and one using both. The models displayed optimal prediction performance, making them valuable assistive tools in different settings for clinical decision-making and resource allocation. Furthermore, the implemented noninvasive model can be used for rapid triage of patients without the need for additional costs or waiting time for laboratory or imaging tests. The results of this study show that predicting death prognosis during the COVID-19 pandemic is a crucial idea that can lower illness fatality rates by illuminating the best places and people to intervene [17]. Artificial Intelligence for Forecasting and Diagnosing COVID-19 Pandemic: A Focused Review has been discussed by Comito and Pizzuti and investigated a comprehensive review of methods, algorithms, applications, and emerging AI technologies that can be utilized for forecasting and diagnosing COVID-19. The study examined and reviewed an extensive collection of state-of-the-art COVID-19 prediction and diagnosis algorithms, providing a detailed background description of the AI techniques used for COVID-19 [18]. A research paper titled Drivers and Forecasts of Multiple Waves of the Coronavirus Disease 2019 Pandemic: A Systematic Analysis Based on an Interpretable Machine Learning Framework proposed on February 22, 2022, describes the multiple waves of the COVID-19 pandemic. Multidimensional time series data, including policy, travel, medical, socioeconomic, environmental, mutant, and vaccine-related data, were collected from 39 countries up to June 30, 2021, and an interpretable machine learning framework was used to systematically analyze the effect of multiple factors on the spread of COVID-19. Based on a model of the prevaccine era, policy-related factors were shown to be the main drivers of the spread of COVID-19, with a contribution of 60.81%. In the postvaccine era, the contribution of policy-related factors decreased to 28.34%, accompanied by an increase in the contribution of travel-related factors, such as domestic flights, and contributions emerged for mutant-related (16.49%) and vaccine-related (7.06%) factors. Forecasting models to predict the rebound risk were built based on these findings, with accuracies of 0.78 and 0.81 for the pre- and postvaccine eras, respectively. These findings quantitatively demonstrate the systematic drivers of the spread of COVID-19, and the framework proposed in this study will facilitate the targeted prevention and control of the ongoing COVID-19 pandemic [19]. To answer this question, researchers Chatterjee et al. discovered that some characteristics of the COVID-19 participants’ demographics and comorbidities were strongly related to their mortality [13]. Machine Learning-Based Model to Predict the Disease Severity and Outcome in COVID-19 Patients is the name of the paper that Aljameel et al. created. The data were analyzed using three classification algorithms, namely, logistic regression (LR), random forest (RF), and extreme gradient boosting (XGB). Initially, the data were preprocessed using several preprocessing techniques. Furthermore, 10-k cross-validation was applied for data partitioning and SMOTE for alleviating the data imbalance. Experiments were performed using 20 clinical features, identified as significant for predicting the survival versus the deceased COVID-19 patients. The results showed that RF outperformed the other classifiers with an accuracy of 0.95 and an AUC of 0.99. The proposed model can assist the decision-making and healthcare professionals by early identification of at-risk COVID-19 patients effectively. In this essay, the global devastation caused by the COVID-19 pandemic outbreak has prompted a global health catastrophe. To stop this pandemic, several actions have been taken [20].
Many researchers have applied data-driven statistical models such as autoregressive integrated moving average (ARIMA) for the prediction of future trends of the infectious disease as one wave using data from different countries, for example, Dwivedi, Upadhyay, and Pal [21] modeled China COVID-19 and Ajagbe et al. [22] and Yenurkar and Mal [23] proposed a time series model for Italy using France′s COVID-19 data, illustrated a statistical model for US COVID-19 data, and used China, Italy, and France data and India data. The technique of time series analysis has been widely delivered, for its reliability and quick implementation by many stakeholders. The machine learning model is another effective technique that can be applied using different models such as NN and SVM.
3. Methodology
3.1. System Architecture
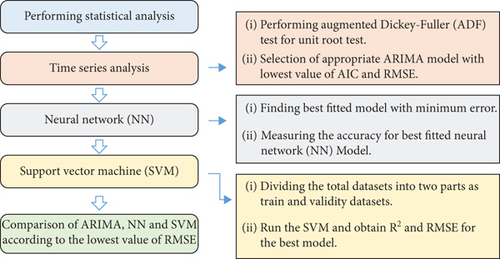
In this paper, at first, some statistical analysis is performed to see the overall condition of the COVID-19 pandemic in seven selected countries. Then, focus on the main terms of time series analysis and machine learning techniques (NN and SVM analyses). The whole study system overview is given in Figure 1. This study is conducted because of the most seven vulnerable countries affected by the COVID-19 pandemic. These countries are the United States, India, Brazil, Russia, France, China, and Bangladesh. The authors chose this country because these countries are the Top 5 countries affected by the COVID-19 pandemic. Another two countries, China and Bangladesh, were selected because this virus was first occurred in Wuhan City, China, and the people of my country Bangladesh were affected by the COVID-19 pandemic, and the death rate was also increasing day by day. This study’s primary goal is to mimic development. In this paper, the ARIMA model for time series analysis, the NN model for NNs, and the SVM model for SVMs are studied. This research examines the best fit model from these models using model selection criteria. Then, the lowest root means square error values of all the top models are compared (root-mean-square error [RMSE]). Here are some of the fundamental ideas behind this research methodology.
3.2. Dataset Collection
For this study, collect secondary data on the COVID-19 pandemic of the seven most vulnerable countries. The daily COVID-19 data were assimilated from the WHO in the following site for the study period of December 31, 2019, through March 31, 2021.
The following URL, https://www.ecdc.europa.eu/en/publications-data/download-todays-data-geographic-distribution-covid-19-casesworldwide, was used for data collection [2].
COVID Live: Coronavirus Statistics (Worldmeter). Website: https://www.worldometers.info/coronavirus [24].
3.3. Dataset Preparation
3.4. Model Development With Time Series Analysis
This paper illustrates a suitable ARIMA model, which is the most accurate for predicting mortality rate, to the time series analysis. An ARIMA model can be constructed by graphing the mortality rate for each country over time and determining whether the data is stationary. If the plot indicates that the data is not stationary, then take the original data’s difference until the data is stationary. The current data must first be converted from nonstationary to stationary to select the time series model that matches them. Next, this study produces the autocorrelation function (ACF) plot and partial ACF (PACF). The study must ascertain the order of the time series model from the ACF plot and partial autocorrelation plot. The COVID-19 pandemic death rate in various nations will then be predicted using the time series model that this paper fitted later.
The data are assumed to be stationary in many time series approaches. The fact that the mean, variance, and autocorrelation structure do not vary over time is a characteristic of stationary processes. Let Yt be a stochastic time series and is said to be a stationary time series if mean EYt = μ, variance (V) , and covariance E(Yt − μ)(Yt+k − μ) = k, where k is the covariance (autocovariance) at lag k. A time series Yt is said to be a nonstationary time series if it is dependent on time t with mean EYt = μ and variance . There are two tests for checking stationarity. These are the unit root test and ADF test.
The ARIMA approach is highly well-liked in econometric time series. A time series {Yt} is an autoregressive process of order p if Yt = ∅1Yt−1 + ∅2Yt−2 + ⋯+∅pYt−p + zt, where {zt} ~ WN (0, σ2) and ∅1, ∅2, ⋯, ∅p are constant. A time series {Yt} moving average process of order q if Yt = μ + β1 ut−1 + β2 ut−2 + ⋯+βp ut−q, where μ is a constant and u is a white noise, that is, {ut} ~ N(0, σ2) . In an ARMA (p, q) process, there will be p autoregressive and q moving average terms, respectively [25].
3.5. NN
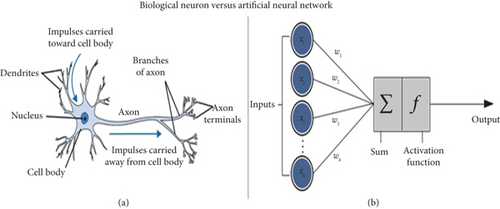
Although the idea of an artificial neuron was initially proposed in 1943, it was not until the 1980s that NNs were first used on computers. To separate them from biological neurons, NNs are frequently referred to as artificial NNs (ANN). These networks were designed to mimic the functions of the human intellect. Like decision trees, the NN technique demands that a graphical model be created to describe the pattern before the model is used to analyze the data. A directed graph with source (input), sink (output), and internal (hidden) nodes can be used to visualize the NN. While the output nodes are found in an output layer, the input nodes are found in an input layer. Over one or more hidden layers, the concealed nodes can be found.
Figure 2 represents a simple NN model. To perform the data mining task, a tuple is input through the input nodes and the output node determines what the prediction is. Unlike decision trees, which have only one input node (the root of the tree), the NN has one input node for each attribute value to be examined to solve the data mining function. Unlike decision trees, after a tuple is processed, the NN may be changed to improve future performance [27].
3.6. SVR
SVM can be used as a regression tool and keeps all the important qualities that characterize the algorithm (maximal margin). SVR for classification adheres to the same principles as the SVM with a few minor exceptions. First off, since output is a real number, it becomes incredibly challenging to anticipate the current information because there are an endless number of possible outcomes. Then, calculate R2 and RMSE values. The fundamental principle, however, remains constant: to minimize error while customizing the hyperplane to maximize the margin while keeping in mind that some mistakes are acceptable [28].
3.7. Evaluation Process
The root-mean-square deviation (RMSD) or RMSE is a commonly employed metric for comparing values predicted by a model or estimator and the values observed. The term RMSD refers to either the square root of the second sample moment of those discrepancies or the quadratic mean of the disparities between anticipated values and actual values. The MSE of an estimator with respect to an unknown parameter θ is defined as . An MSE of zero means that the estimator predicts observations of the parameter θ with perfect accuracy, which is ideal (but typically not possible). Values of MSE may be used for comparative purposes. RMSE is a good measure of accuracy for evaluating the quality of predictions and shows how far predictions fall from measured true values using Euclidean distance. When calculations are made outside of the estimation data sample, the deviations are known as errors (or prediction errors), and when calculations are made within the estimation data sample, they are known as residuals [29, 30].
4. Results and Discussion
4.1. COVID-19 Mortality Rate Prediction by Time Series Analysis
This paper illustrates a suitable ARIMA model, which is the most accurate for predicting mortality rate, to the time series analysis. An ARIMA model can be constructed by graphing the mortality rate for each country over time and determining whether the data is stationary. The United States has the highest incidence of coronavirus in the world. Though this is the most developed country, the mortality rate is very high at the start of the COVID-19 pandemic.
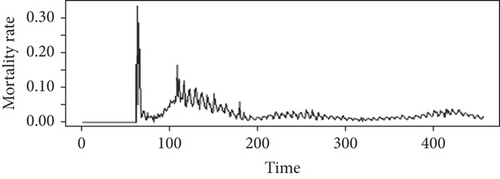
Figure 3 shows the mortality rate time series plot of the United States during the COVID-19 pandemic. A visual plot of the data is usually the first step in any time series analysis. This figure suggests that throughout the study, the time series data seems to be trending upward or downward so the series is not a stationary pattern. So, this paper shows that the original COVID-19 data series is nonstationary.
From Figure 4, ACF and PACF, it is clear that there is no significant spike in the first-order differenced series which also indicates that there are no significant effects of autoregressive and moving average in the first-order difference; that is, the US COVID-19 data series is stationary at the first-order difference.
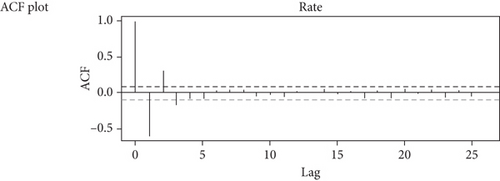
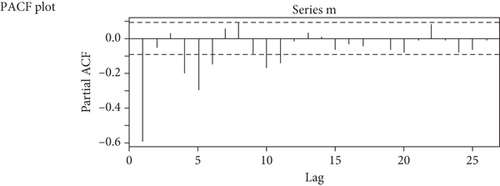
Table 1 shows the ADF test for original data of the United States during the COVID-19 pandemic. The p value exceeds the significant level. So, this author accepts the null hypothesis which means the mortality rate of the US data series is nonstationary. To make it stationary, take first difference of the original data series and plot the first-order differences for mortality rate of the United States during the COVID-19 pandemic. This first-order difference in mortality rate is stationary. So, the mean and variance for this stationary time series are constant, and the covariance is time invariant. The US COVID-19 data series is stationary at the first-order difference.
| ADF test | ||
|---|---|---|
| DF | Lag | pvalue |
| −3.9077 | 7 | 0.137 |
ADF test for first difference in Figure 4 for mortality rate in the United States during the COVID-19 pandemic is shown in Table 2. The p value at the 5% significance threshold is less than 0.05, as the table above has demonstrated. This paper therefore rules out the null hypothesis. The mortality rate of the US data series is steady in this way. Table 3 shows ARIMA (p, d, q) models for the mortality rate in the United States during the COVID-19 pandemic.
| ADF test | ||
|---|---|---|
| DF | Lag | pvalue |
| −9.1834 | 7 | 0.01 |
| ARIMA (p, d, q) | Values of the selection criteria | ||||
|---|---|---|---|---|---|
| AIC | RMSE | MAE | MASE | ACF1 | |
| (1, 1, 1) | −2169.8 | 0.0222766 | 0.007935766 | 0.9580206 | −0.0349147 |
| (1, 1, 0) | −2191 | 0.02176806 | 0.008244335 | 0.9952716 | −0.0281470 |
| (3, 1, 2) | −2226.6 | 0.02073427 | 0.007949179 | 0.9596398 | −0.0280821 |
| (3, 1, 3) | −2283.6 | 0.01941673 | 0.007234496 | 0.873362 | 0.003545712 |
| (3, 1, 4) | −2282.5 | 0.01939634 | 0.007261137 | 0.876578 | 0.000322102 |
| (3, 1, 5) | −2281.0 | 0.01938613 | 0.007277352 | 0.8785356 | −0.00138132 |
| (4, 1, 5) | −2278.72 | 0.01939312 | 0.007270892 | 0.8777556 | −0.00204255 |
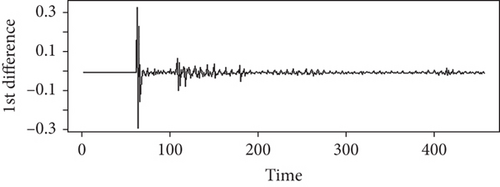
Figure 5 suggests that for the first difference, the data converted into stationary time series data which is time invariant. So, the mean and variance for this stationary time series are constant, and the covariance is time invariant.
From Table 3 models, the best selected ARIMA model for mortality rate is ARIMA (3, 1, 3) with the lowest value of AIC. The following Table 4 represents the same time series formula for all the remaining six countries, the selected ARIMA models for predicting the mortality rate in the COVID-19 pandemic situation.
| Country | ARIMA model | AIC | RMSE |
|---|---|---|---|
| India | (0, 1, 2) | −2093.2 | 0.0058385 |
| Brazil | (6, 1, 5) | −3114.42 | 0.00772655 |
| France | (3, 1, 3) | −845.64 | 0.09399793 |
| Russia | (4, 1, 4) | −3797.91 | 0.00366663 |
| China | (4, 1, 4) | −1189.23 | 0.06409943 |
| Bangladesh | (3, 0, 0) | −2128.27 | 0.02329915 |
4.2. Machine Learning Analysis (NN and SVM)
A series of nonlinear functions with weights determined make a NN through training on data. One has to decide the architecture of the network before the training. Total datasets contain 457 observations of 4 variables. For this analysis, divide the total datasets into two parts with 80% and 20% relatively. One is train datasets, and another is test datasets. The train datasets contain 365 observations of 4 variables, and the test datasets contain 92 observations of 4 variables. For NN analysis, the authors use two input variables confirmed daily cases and daily death, and the output variable is the mortality rate for each of the countries. Then, fit the NN model with the basis of train datasets. The basic concept of the NN model indicates that the best NN model provides the minimum error. So, this study decides the best fitted NN model based on minimum error.
4.2.1. US Data
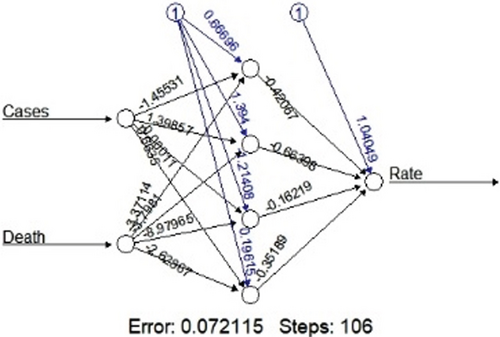
Table 5 and Figure 6 illustrate that, after increasing the hidden layer, the error of the models decreases. Model 03 with four hidden layers is the minimum error model with the value of error 0.072115236. So, Model 03 is the best fitted NN model to predict the mortality rate of the COVID-19 pandemic in the United States.
| No. of hidden layer | Error | No. of steps | MSE |
|---|---|---|---|
| 02 | 0.073607165 | 51 | 0.000177795 |
| 03 | 0.073056762 | 63 | 0.00017646 |
| 04 | 0.072115236 | 106 | 0.0001741917 |
| 05 | 0.106144777 | 97 | 0.0002563884 |
| 06 | 0.187743591 | 135 | 0.000543226 |
4.2.2. India Data
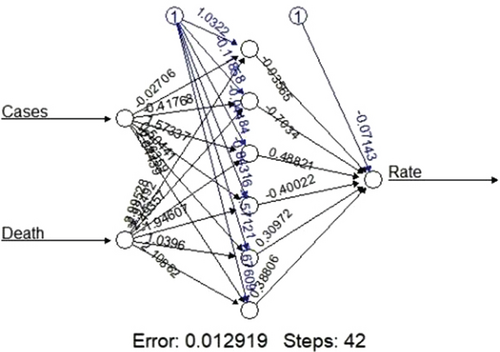
After increasing the hidden layer, the error of the models decreases. Model 05 with 06 hidden layers is the minimum error model with the value of error 0.012918548. So, Model 05 is the best fitted NN model to predict the mortality rate of the COVID-19 pandemic in India shown in Figure 7 and Table 6.
| No. of hidden layer | Error | No. of steps | MSE |
|---|---|---|---|
| 02 | 0.013786057 | 91 | 7.492422e−05 |
| 03 | 0.013906885 | 91 | 7.55809e−05 |
| 04 | 0.013653556 | 61 | 7.420411e−05 |
| 05 | 0.012929815 | 695 | 7.027073e−05 |
| 06 | 0.012918548 | 42 | 7.02095e−05 |
| 07 | 0.013341727 | 36 | 7.250938e−05 |
| 08 | 0.013352922 | 51 | 7.135449e−05 |
4.2.3. Brazil Data
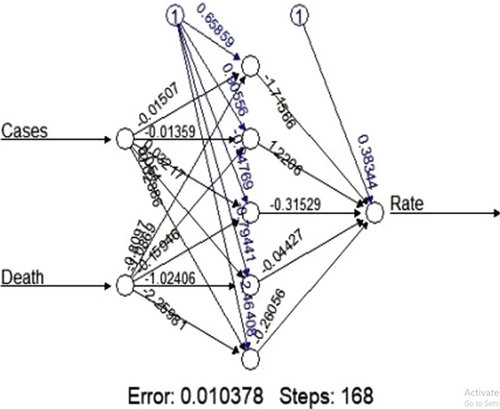
So, after increasing the hidden layer, the error of the models decreases. Model 04 with 05 hidden layers is the minimum error model with the value of error 0.010377549. Therefore, Model 04 is the best fitting NN model to forecast the COVID-19 pandemic’s fatality rate in Brazil shown in Table 7 and Figure 8.
| No. of hidden layer | Error | No. of steps | MSE |
|---|---|---|---|
| 02 | 0.04804837 | 31 | 1.240305e−05 |
| 03 | 0.048383189 | 37 | 1.248948e−05 |
| 04 | 0.04793639 | 36 | 1.237414e−05 |
| 05 | 0.010377549 | 168 | 2.678827e−06 |
| 06 | 0.015667468 | 242 | 4.044349e−06 |
| 07 | 0.044719557 | 40 | 1.154376e−05 |
4.2.4. France Data
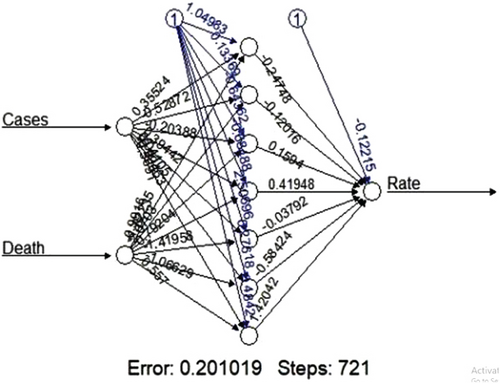
The above table suggests that, after increasing the hidden layer, the error of the models decreases at a certain model, and then again, the model error increases. Model 05 with 07 hidden layers is the minimum error model with the value of error 0.201018964. So, Model 05 is the best fitting NN model to forecast the COVID-19 pandemic’s fatality rate in France shown in Figure 9 and Table 8.
| No. of hidden layer | Error | No. of steps | MSE |
|---|---|---|---|
| 02 | 1.563910403 | 153 | 0.1200365 |
| 03 | 1.5793924 | 69 | 0.1139658 |
| 04 | 1.5639104 | 87 | 0.1176599 |
| 05 | 0.2709922 | 188 | 0.02079976 |
| 07 | 0.201018964 | 721 | 0.01542902 |
| 08 | 0.382510394 | 368 | 0.02935923 |
| 09 | 0.320490472 | 463 | 0.01572727 |
4.2.5. Russia Data
The above table suggests that, after increasing the hidden layer, the error of the models decreases at a certain model, and then again, the model error increases. Model 04 with 06 hidden layers is the minimum error model with the value of error 0.01365774. So, Model 04 is the best fitted NN model to predict the mortality rate of the COVID-19 pandemic in Russia in Figure 10 and Table 9.

| No. of hidden layer | Error | No. of steps | MSE |
|---|---|---|---|
| 02 | 0.01564102 | 32 | 8.668226e−07 |
| 03 | 0.01600916 | 42 | 8.872251e−07 |
| 04 | 0.0159493 | 44 | 8.839098e−07 |
| 06 | 0.01365774 | 59 | 7.569102e−07 |
| 07 | 0.0155657 | 34 | 8.62649e−07 |
| 08 | 0.015656208 | 40 | 7.568248e−07 |
4.2.6. China Data
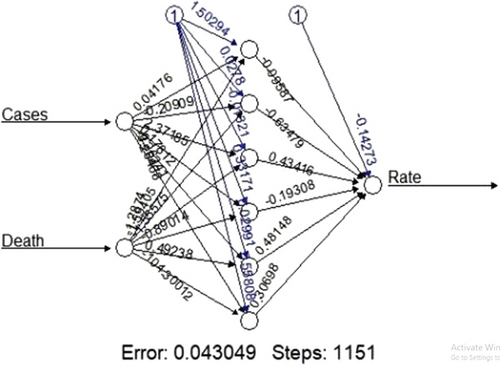
After increasing the hidden layer, the error of the models decreases at a certain model, and then again, the model error increases. Model 05 with 06 hidden layers is the minimum error model with the value of error 0.04304859. Model 05 is, therefore, the best fitting NN model to forecast the COVID-19 pandemic’s fatality rate in China in Figure 11 and Table 10.
| No. of hidden layer | Error | No. of steps | MSE |
|---|---|---|---|
| 02 | 0.167 | 4431 | 0.002638687 |
| 03 | 0.1.5388 | 4727 | 0.002416949 |
| 04 | 0.1.27140 | 1064 | 0.001996934 |
| 05 | 0.0605124 | 10659 | 0.000950440 |
| 06 | 0.04304859 | 1151 | 0.0006761436 |
| 07 | 0.06116876 | 1424 | 0.0009607484 |
| 08 | 0.08943245 | 1553 | 0.0017345675 |
4.2.7. Bangladesh Data
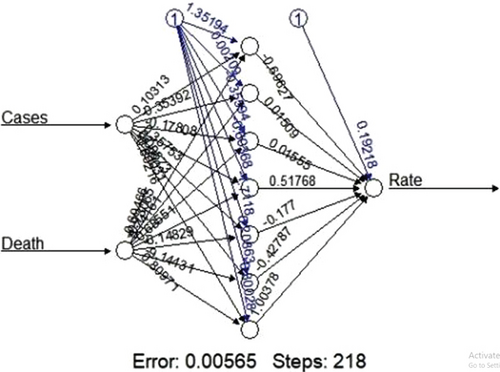
Figure 12 and Table 11 show the NN model analysis for the study period data in Bangladesh. After increasing the hidden layer, the error of the models decreases at a certain model, and then again, the model error increases. Model 06 with 07 hidden layers is the minimum error model with the value of error 0.005649775. Model 06 is therefore the best suited NN model to forecast the COVID-19 pandemic’s fatality rate in Bangladesh.
| No. of hidden layer | Error | No. of steps | MSE |
|---|---|---|---|
| 02 | 0.021634806 | 88 | 5.2257e−05 |
| 03 | 0.021584613 | 78 | 5.2136e−05 |
| 04 | 0.02061859 | 67 | 4.9803e−05 |
| 05 | 0.01102753 | 335 | 2.4819e−05 |
| 07 | 0.005649775 | 218 | 1.36468e−05 |
| 08 | 0.0190058856 | 435 | 4.590794e−05 |
| 09 | 0.0225563335 | 312 | 4.752931e−05 |
NN model and ANN models can give good prediction performance with the lower value of all errors and could be successfully used to set up the forecasting models that could give appropriate and reputable mortality rates in the selected seven most countries during the study period of COVID-19 pandemic as shown in Table 12.
| Country name | ME | RMSE | MAE | MASE |
|---|---|---|---|---|
| United States | −0.0001091 | 0.017987 | 0.006481 | 0.778031 |
| India | 2.2769e−05 | 0.0243787 | 0.00602585 | 1.096725 |
| France | 0.000125218 | 0.0906301 | 0.0302519 | 0.800436 |
| Brazil | −1.689033e−05 | 0.007144465 | 0.004619171 | 0.8285758 |
| Russia | 2.3730e−05 | 0.00383828 | 0.00261815 | 0.8036039 |
| China | −0.000136384 | 0.04080285 | 0.02047086 | 0.7189965 |
| Bangladesh | 9.819736e−05 | 0.02160794 | 0.006798527 | 0.7411017 |
4.3. SVM Analysis
For this analysis, divide the total datasets into two parts with 80% and 20%, respectively. One is train datasets, and another is validity datasets. The datasets are contained in Table 13. In SVM analysis, this paper evaluated the trend of forecasted mortality rate with respect to date. From this analysis, this paper illustrated RMSE and R2 for each of the country.
| Datasets | Observations | Variable |
|---|---|---|
| Total | 457 | 4 |
| T data | 382 | 2 |
| V data | 75 | 2 |
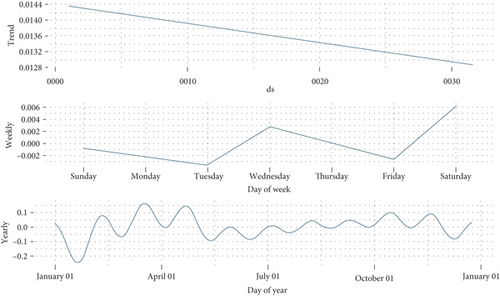
4.3.1. Forecasted Plot for the Trend, Weekly, and Yearly for All of the Seven Countries
Figure 13 suggests that the mortality rate trend remains decreasing with a negative slope. The highest mortality rate occurs on Thursday, and the lowest mortality rate occurs on Monday. The yearly trend indicates that the highest mortality rate occurs throughout the month of March, and it remains decreasing for the rest of the month.

Figure 14 suggests that the mortality rate trend increases at the given study period of the time, and then, it remains decreasing from a certain point. The highest mortality rate occurs on Wednesday, and the lowest mortality rate occurs on Sunday. The yearly trend indicates that the highest mortality rate occurs throughout the month of March, and it continues to decrease for the rest of the month in India.
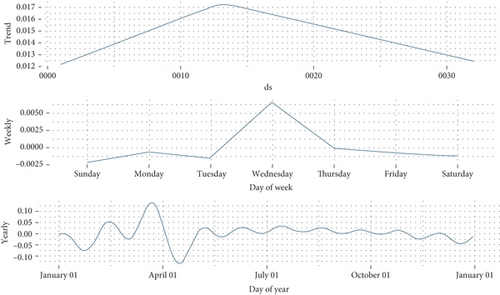
Figure 15 suggests that the mortality rate trend increases at the given study period of the time, and it indicates that the rate is very alarming for that country. The highest mortality rate occurs on Wednesday and Thursday, and the lowest mortality rate occurs on Tuesday. The yearly trend indicates that the highest mortality rate occurs throughout the month of May, and it slightly decreases for the rest of the month in Brazil.
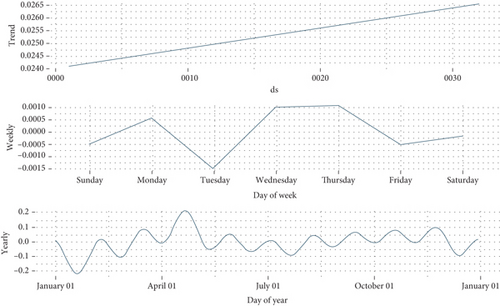
Figure 16 suggests that the mortality rate trend increases at the given study period of the time, and then, it remains decreasing from a certain point. The highest mortality rate occurs on Friday, and the lowest mortality rate occurs on Monday. The yearly trend indicates that the highest mortality rate occurs throughout the month of May to July, and it remains decreasing for the rest of the month in France.
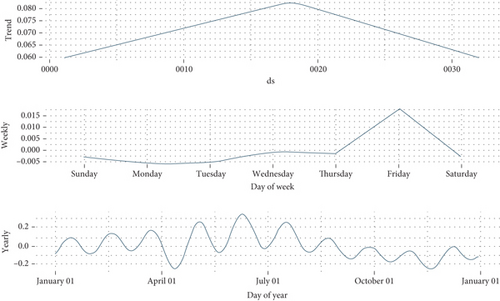
Figure 17 suggests that the mortality rate trend increased at the given study period of that time. The highest mortality rate occurs on Thursday, and the lowest mortality rate occurs on Tuesday. The yearly trend indicates that the highest mortality rate occurs throughout the month of April to May, and it gives slightly increasing and decreasing patterns for the rest of the month in Russia.
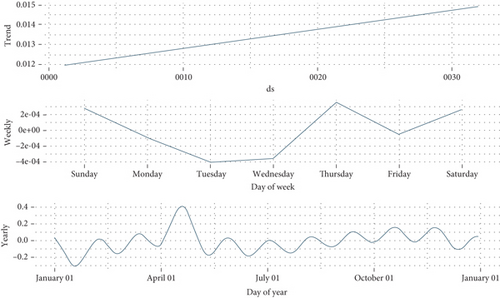
Figure 18 suggests that the mortality rate trend decreased during the given study period of that time. The highest mortality rate occurs on Tuesday, and the lowest mortality rate occurs on Monday and Wednesday. The yearly trend indicates that the highest mortality rate occurs throughout the month of February to March, and it gives decreasing patterns for the rest of the month in China.

Figure 19 suggests that the mortality rate trend decreased during the given study period of that time. The highest mortality rate occurs on Saturday, and the lowest mortality rate occurs on Tuesday. The yearly trend indicates that the highest mortality rate occurs throughout the month of March to May, and it gives decreasing patterns for the rest of the month in Bangladesh.
SVM provides the above results in Table 14 of mortality rate prediction; this result contains a high value of coefficient of determination R2 that predicts better forecasting for prediction and root means a square error which verifies a better prediction model between SVM and NN model.
| Country name | RMSE | R2 |
|---|---|---|
| United States | 0.00837493 | 0.97128731 |
| India | 0.00637859 | 0.9341762 |
| France | 0.00011897 | 0.991653 |
| Brazil | 0.001066004 | 0.991653 |
| Russia | 0.000321 | 0.9757947 |
| China | 0.001253513 | 0.9734394 |
| Bangladesh | 0.0040355 | 0.9812166 |
4.4. Descriptive Statistical Analysis of the COVID-19 Data
Some statistical analysis is performed to show the COVID-19 pandemic situation in the selected seven vulnerable countries.
- 1.
The average daily confirmed cases in the United States are 66,360 persons, the maximum number of people affected in 1 day is 366,655 on January 7, 2021, and the maximum number of deaths in 1 day is 4928 of coronavirus pandemic in our study period.
- 2.
The average daily confirmed cases in India are 26,683 persons, the maximum number of people affected in 1 day is 97,894 on September 17, 2020, and the maximum number of deaths in 1 day is 3335 persons of the coronavirus pandemic in our study period.
- 3.
The average daily confirmed cases in Brazil are 27,894 persons, the maximum number of people affected in 1 day is 98,217 on March 25, 2021, and the maximum number of deaths in 1 day is 3950 persons during the coronavirus pandemic in our study period.
- 4.
The average daily confirmed cases in France are 10,338 persons, the maximum number of people affected in 1 day was 86,852 on November 8, 2020, and the maximum number of deaths in 1 day is 2004 persons during the coronavirus pandemic in our study period.
- 5.
The average daily confirmed cases in Russia are 10,049 persons, the maximum number of people affected in 1 day is 49,412 on August 30, 2020, and the maximum number of deaths in 1 day is 635 persons during the coronavirus pandemic in our study period.
- 6.
The average daily confirmed cases in China are 181 persons, the maximum number of people affected in 1 day is 5141 on February 13, 2020, and the maximum number of deaths in 1 day was 254 persons during the coronavirus pandemic in our study period.
- 7.
The average daily confirmed cases in Bangladesh are 1334 persons, the maximum number of people affected in 1 day is 5358 on March 31, 2021, and the maximum number of deaths in 1 day is 67 persons during the coronavirus pandemic in our study period.
| Countries name | Descriptive statistics | Daily confirmed cases | Daily death | Mortality rate |
|---|---|---|---|---|
| United States | Mean | 66360.05 | 1207.91 | 0.0231593 |
| Minimum | 0 | 0 | 0.0000 | |
| Maximum | 366655 | 4928 | 0.3333 | |
| India | Mean | 26682.85 | 356.82 | 0.0152754308 |
| Minimum | 0 | 0 | 0 | |
| Maximum | 97894 | 3335 | 0.5 | |
| Brazil | Mean | 27894.26 | 694.69 | 0.0257154 |
| Minimum | 0 | 0 | 0 | |
| Maximum | 98217 | 3950 | 0.11135 | |
| France | Mean | 10338.21 | 204.75 | 0.0606852 |
| Minimum | 0 | 0 | 0 | |
| Maximum | 86852 | 2004 | 1.879 | |
| Russia | Mean | 10048.98 | 214.32 | 0.01715917 |
| Minimum | 0 | 0 | 0 | |
| Maximum | 49412 | 635 | 0.0504907 | |
| China | Mean | 181.00 | 7.58 | 0.03520374 |
| Minimum | 0 | 0 | 0 | |
| Maximum | 5141 | 254 | 0.85000 | |
| Bangladesh | Mean | 1334.65 | 19.79 | 0.01712309 |
| Minimum | 0 | 0 | 0 | |
| Maximum | 5358 | 67 | 0.33333 | |
4.5. Comparison Table of All Models for the Seven Countries
This essay compares the machine learning model as NN, SVM, and time series analysis (ARIMA) according to the lowest value of RMSE to obtain the best fitted model for the seven most vulnerable countries in the COVID-19 pandemic. Table 16 compares the best fitted model.
| Country name | Root mean square error (RMSE) | Best method | Comment | ||
|---|---|---|---|---|---|
| Time series analysis | Neural network (NN) | Support vector machine (SVM) | |||
| United States | 0.01941673 | 0.01798794 | 0.00837493 | SVM | SVM produces superior results than the other two methods, which helps to lower the mortality rate in the United States. |
| India | 0.0058385 | 0.02437876 | 0.00637859 | SVM | SVM provides a superior result than the other two methods, resulting in a decline in India’s mortality rate. |
| Brazil | 0.00772655 | 0.007144465 | 0.00011897 | SVM | SVM produces better results than the other two methods, which causes Brazil’s mortality rate to rise. |
| France | 0.09399793 | 0.09063019 | 0.001066004 | SVM | French mortality rate decreases as a result of SVM’s superior results than the other two methods. |
| Russia | 0.00366663 | 0.003838286 | 0.000321 | SVM | SVM produces better results than the other two methods, which causes a rise in Russia’s mortality rate. |
| China | 0.06409943 | 0.04080285 | 0.001253513 | SVM | SVM provides a superior outcome than the other two methods, resulting in a decline in China’s mortality rate. |
| 0.02329915 | 0.02160794 | 0.0040355 | SVM | SVM produces superior results than the other two methods, which helps Bangladesh’s mortality rate decline. | |
Table 16 illustrates that SVM provides better prediction model of mortality prediction for all of the seven countries with the lowest value of RMSE. Therefore, SVM produces better outcomes than other machine learning techniques.
5. Summary and Conclusion With Limitation and Future Work
Coronavirus disease 2019 is a communicable disease. The disease has since spread worldwide, leading to an ongoing pandemic. The world faces a truly unprecedented healthcare crisis. The COVID-19 pandemic is testing the resources and capacity of health systems around the world. Despite measureless efforts to limit the spread of COVID-19, over 435 million people have been confirmed positive for SARS-CoV-2 infection and more than 5.95 million people have died from the virus worldwide, as of March 1, 2022. This study’s main aim is to develop a more accurate model as time series analysis, NN, ANN, and SVM models to predict the mortality rate in this pandemic situation of the seven most vulnerable countries: the United States, India, Brazil, France, Russia, China, and Bangladesh. The beginning of this analysis explains the descriptive statistics of these seven countries in our study period. Here illustrated, the maximum number of deaths in 1 day is 4928 persons in the United States, 3335 persons in India, 3950 persons in Brazil, 2004 persons in France, 635 persons in Russia, 254 persons in China, and 67 persons in Bangladesh during the study period. Time series analysis suggests the best ARIMA model for each country based on the lowest AIC value. The best accurate NN model for each country is selected by increasing the hidden layer, and the best model is obtained according to the lower value of error of the model. Then, analyze the SVM for each country and find out the RMSE and R2. All the models are forecasted for the next 60 days based on study data. At last, all the methods are compared according to the lowest value of RMSE and obtained that the SVM gives us a more accurate model with the lowest value of RMSE for all the seven selected countries as United States, India, Brazil, France, Russia, China, and Bangladesh than the other approach. The comparison section suggests that the mortality rate falls for countries such as the United States, India, France, China, and Bangladesh and the mortality rate rises for countries such as Brazil and Russia. So, this study depicts that the SVM gives a more accurate result than other models with the lowest value of RMSE for all the seven selected vulnerable countries. This paper predicts a more accurate mortality rate by the SVM compared to the other paper described in the literature review. A Machine Learning Based Exploration of COVID-19 Mortality Risk was developed by Mahdavi et al.; the results of this study show that predicting death prognosis during the COVID-19 pandemic is a crucial idea that can lower illness fatality rates by illuminating the best places and people to intervene in the rising and falling mortality rate condition of the seven selected countries which are obtained in this study. The main limitation of this study is time and resources. Also, data cannot be found in the usual process as Excel sheet or CSV format; they can be found graphically. So, it is very tough to collect data on a graph and increase the quality of data from a graphical pattern in a short period. The proposed method is difficult to handle. All the methods deal with statistical software R. R is programming software, and it does not provide results for a tiny fault instruction or comment. So, the result obtained with much reliable comment. Also, any kind of paper is not related to my study directly, and so much difficulty is faced in study time. Our study’s findings show that, during the study period, mortality rates are falling in the United States, India, France, China, and Bangladesh while rising in Brazil and Russia. As a result, this study demonstrates that SVM produces better outcomes than other machine learning techniques. Although the death rates of seven countries with high vulnerability are known from this investigation, it does not show how these rates might be lowered to zero patients. As a result, it can be concluded from this article that SVM will play an important role in the future falling mortality rate, to know the multiple waves of mortality rate by educating the general public about the importance of getting the vaccine to prevent the current pandemic for the next years, which will be more effective if research reader gets it.
Conflicts of Interest
The authors declare no conflicts of interest.
Author Contributions
Tanzina Akter: methodology, software, writing—original draft. Md. Farhad Hossain: supervision, validation. Mohammad Safi Ullah: methodology, writing—review and editing, supervision. Rabeya Akter: writing—review and editing, visualization.
Funding
The authors received no specific funding for this work.
Open Research
Data Availability Statement
Data will be made available on request.


