Modal Parameter Identification and Damage Localization of Composite Helicopter Rotor Blades Based on AR/PR Identification
Abstract
The structural characteristics and application background of helicopters determine that the primary dynamic components work in environments with high cyclic amplitude and low-stress vibration fatigue load. As the most critical structural system of helicopters, structural health monitoring of the rotor blades is necessary to avoid fatigue damage under working conditions. Modal parameters, as functions of the physical properties of structural systems, change when there is damage or internal defects (the mass, stiffness, and damping of the structure will change). This article completes the identification of modal parameters of composite rotor blades under working conditions based on operational modal analysis (OMA). Specifically, using the AR/PR (autoregressive/polyreference) time-domain identification method, experiments are designed to identify the modal parameters (natural frequency, modal damping ratio, and mode shape) of composite rotor blades based on acceleration and strain signals. The results of the identification of modal parameters are verified through finite element simulation and modal measurement experiments. In addition, the application of OMA for the location of composite rotor blade damage is also studied.
1. Introduction
With the continuous development of modern helicopters towards high speed, high range, and diversified flight modes, composite rotor blades, as the main load-bearing structure during a helicopter flight, have attracted significant attention to their safety and reliability issues [1]. In addition to fatigue caused by periodic stress, other major threats to the integrity of modern composite rotor blades include low-speed impact, moisture absorption, and progressive damage accumulation [2]. Damage to the rotor blades can lead to performance degradation and even catastrophic accidents, making it one of the most critical systems that affect helicopter safety. Therefore, it is necessary to conduct structure health monitoring (SHM) of helicopter rotor blades [3] to reduce the need for expensive regular inspections (resulting in approximately 25% of operating costs [4]), increase component lifespan, reduce downtime caused by unplanned maintenance [5], and improve flight safety, as it is estimated that about 3% of helicopter accidents are caused by rotor system failures [6].
The most popular SHM method currently is based on modal parameters (natural frequency [7], mode shape [8, 9], mode shape curvature [10], strain energy distribution [11], etc.) to determine the current health status of the structure (location of damage, degree of damage, remaining life, etc.). When there is damage or internal defects, the mass, stiffness, and damping of the structure will change, thereby changing the modal parameters [12]. The identification methods of structural modal parameters can be divided into experimental modal analysis (EMA) and operational modal analysis (OMA) [13]. EMA identifies the modal parameters of the system by establishing input/output models in the frequency domain or time domain, which requires that the output signal and input signal of the system are known. However, for aerospace vehicles in flight states, large civil structures, etc., it is challenging to apply excitation and measure the input signal under working conditions. To solve the above problems, OMA was proposed, which can only use the working response signal of the structure under environmental excitation (wind, wave, etc.) for modal parameter identification (as long as the output signal is known).
OMA can be divided into frequency-domain and time-domain methods based on the types of parameter estimation methods using dynamic signals. The frequency-domain method refers to the method of identifying the modal parameters of a system using its frequency response function or transfer function. The most classic frequency-domain method is the peak picking (PP) method [14], but this method cannot identify closely spaced modes [15]. Brincker, Zhang, and Andersen [16] proposed the frequency domain decomposition (FDD) method to solve the problem of closely spaced modes. On this basis, Gentile and Gallino [17] proposed the enhanced FDD (EFDD) method and applied it to the modal parameter identification of pedestrian bridges. In addition, classic frequency-domain methods include the least squares complex frequency-domain method [18], the basic frequency-domain method [13], etc. The time-domain method is different from the frequency-domain method. It does not need to convert the measured time domain response and excitation time history signal to the frequency domain but can directly identify modal parameters in the time domain. Ibrahim [19] proposed the Ibrahim time-domain (ITD) method, which has been successfully applied to the modal parameter identification of spacecraft structures [20]. Akaike [21] first applied the autoregressive moving average (ARMA) model to modal parameter identification under white noise environment excitation. Gautier and Gontier [22] used the correlation function of the system response signal to improve the robustness of the ARMA method for modal parameter identification. Peeters et al. [23] applied the stochastic subspace identification (SSI) method to modal parameter identification in civil engineering and achieved good results. Juang and Pappa [24] proposed an eigensystem realization algorithm (ERA). Based on ERA, He et al. [25] completed modal parameter identification of the Alfred Zampa Memorial Bridge. X. Jiang and F. Jiang [26] further proposed OMA technology for nonlinear systems. This method uses nonlinear normal modes (NNMs) to extract modal parameters to identify nonlinear vibration systems. In addition, OMA technology has been widely applied in online condition monitoring of a railway vehicle suspension system [27], on-orbit modal testing of spacecraft [28], damping estimation of offshore wind turbine towers [29], in-flight modal testing of airplanes, and other fields [30].
In this investigation, the time-domain autoregressive/polyreference (AR/PR) identification method is introduced to obtain the modal parameters (natural frequency, modal damping ratio, and mode shape) of composite rotor blades under operating conditions. Based on experimental measurements of acceleration and strain signals, modal parameter identification of composite rotor blades is completed. The modal parameter identification results are verified through finite element simulation and modal measurement experiments. In addition, the application of OMA to the damage localization of composite rotor blades is also carried out.
2. Theory of OMA
This study uses AR/PR identification time-domain OMA. This method estimates the autoregressive (AR) matrix in polyreference and then solves for the adjoint matrix of the AR matrix, which is precisely the state matrix of the system. The modal parameters (natural frequency, modal damping ratio, and mode shape) of the system can be obtained by performing eigenvalue decomposition on the state matrix. AR/PR identification is the simplest method for performing OMA and is very user-friendly for engineering personnel. For structures with closely spaced modes, AR/PR identification can also be well applied. AR/PR identification assumes that the correlation function is free decay, and since this is always the case in the absence of noise, AR/PR identification is an unbiased technique (asymptotically unbiased for the noise approaching zero). In contrast, the currently popular FDD technique is biased, and its solution is always an approximate solution [13]. In addition, the FDD technique cannot accurately estimate the damping ratio [31].
The mode shape vector matrix of the system is ΦC.
3. Numerical Examples and Experimental Verification
3.1. Composite Rotor Blade Model
The structure style of the composite rotor blade is selected as a “C-shaped girder blade,” that is, the main internal structure is a C-shaped girder, trailing edge beam, counterweight, and foam sandwich, and the external structure is covered by skin. The modeling process used airfoil output software, which includes Profili and CATIA. The specific operation is to select the NACA0015 airfoil through Profili software and import the airfoil into CATIA software for modeling. The composite rotor blade model is shown in Figure 1.
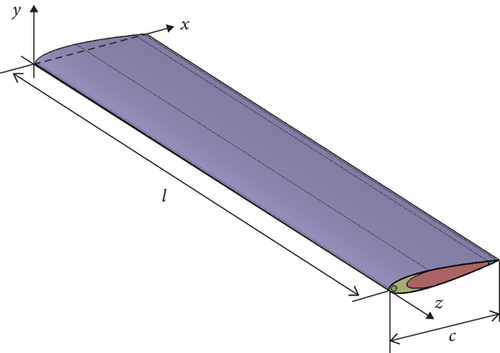
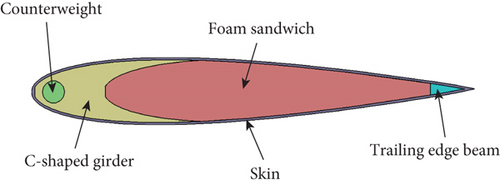
In this study, the rotor blade span length is l = 780 mm, chord length is c = 60 mm, and the maximum thickness of the airfoil is 15% of the chord length, which is 9 mm. The skin is made of composite materials and is laid in three layers, each with a thickness of 0.1 mm. The laying angles are 45°, −45°, and 45°, respectively. The material parameters of each part of the structure are shown in Table 1.
| C-shaped girder and trailing edge beam | Skin | Foam sandwich | Counterweight | |
|---|---|---|---|---|
| ρ (kg/m3) | 2000 | 2000 | 50 | 11,300 |
| E1 (MPa) | 42,600 | 18,500 | 10 | 16,000 |
| E2 (MPa) | 10,000 | 18,500 | / | / |
| E3 (MPa) | 10,000 | 18.5 | / | / |
| μ12 | 0.3 | 0.15 | 0.02 | 0.42 |
| μ13 | 0.4 | 0.15 | / | / |
| μ23 | 0.3 | 0.15 | / | / |
| G12 (MPa) | 5000 | 370 | 4.9 | 5633.8 |
| G13 (MPa) | 3846.2 | 370 | / | / |
Import the rotor blade model created in CATIA software into the finite element simulation software ABAQUS to introduce boundary conditions and divide the mesh to complete subsequent modal analysis. The boundary condition is that the rotor blade is fixed at one end of x = 0.
3.2. Convergence Analysis
The accuracy of simulation calculations depends on the finite element meshes. Therefore, before modal analysis, convergence analysis is required to verify the mesh quality. In the convergence analysis, eight meshes with different densities are considered. The specific naming methods and the number of degrees of freedom (DOFs) they represent are given in Table 2.
| The number of DOFs | |
|---|---|
| M1 | 34,623 |
| M2 | 72,345 |
| M3 | 115,497 |
| M4 | 255,810 |
| M5 | 399,579 |
| M6 | 490,725 |
| M7 | 521,335 |
| M8 | 730,002 |
Calculate the natural frequencies of the first four flap bending mode shapes of composite rotor blades using the above eight different meshes and provide them in Figure 2.
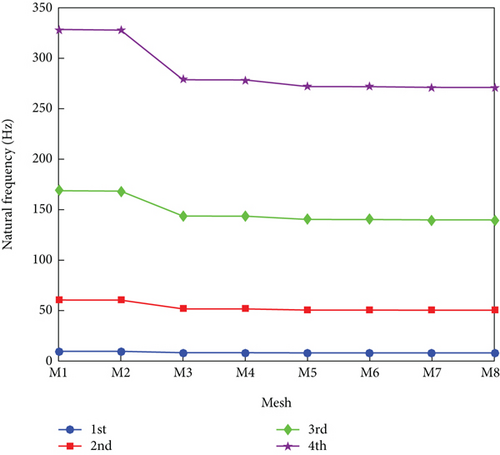
Figure 2 shows that when the number of DOFs reaches M5, even if the mesh is encrypted, the natural frequencies of the first four flap bending mode shapes do not change, indicating that the results have converged. Therefore, in order to ensure computational efficiency, the M5 mesh is used to complete the subsequent modal analysis.
3.3. Verification of Finite Element Simulation Results
In ABAQUS simulation software, modal analysis of the composite rotor blade is completed, and the natural frequencies of the first four flap bending mode shapes are shown in Table 3.
| f1 | f2 | f3 | f4 | |
|---|---|---|---|---|
| FEM | 8.09 | 50.44 | 140.06 | 271.53 |
| Modal experiment | 7.88 | 46.97 | 133.49 | 263.39 |
| Identification results (acceleration) | 7.37 | 45.73 | 131.34 | 259.23 |
| Identification results (strain) | 7.87 | 46.46 | 134.26 | 265.20 |
In order to verify the finite element simulation results, a modal measurement experiment is designed. It is worth mentioning that modal measurement experiments are essentially EMA. A composite helicopter rotor blade specimen with the same dimensions and materials as the finite element simulation model is shown in Figure 3.
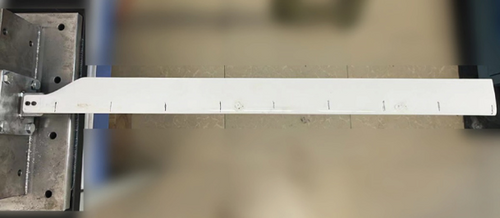
A fixture is designed, as shown in Figure 3, which connects the rotor blade to the fixture through bolts to complete the boundary condition of the rotor blade. All the experimental equipment is shown in Figure 4.
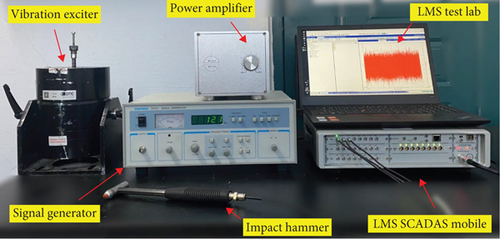
Using LMS SCADA Mobile as the data collection device, accompanied by LMS Test Lab software, we can record and process the collected vibration signals. Hammers and vibration exciters are used as excitation devices for specimens, and signal generators and power amplifiers are used in conjunction with the vibration exciter. Using the above experimental equipment, the modal measurement experiment (hammer impact experiment) of the rotor blade structure is completed. As shown in Figure 5, in the experiment, eight vibration measurement points are set up, all on the straight line of the maximum thickness of the rotor blade (x = 0.297c) and are 115, 210, 305, 400, 495, 590, 685, and 780 away from the fixed end, respectively. One acceleration sensor is installed at the 305 mm position. The sensitivity of the acceleration sensor is 99.9 mV/g.

Adopting the multi-input and single-output method, that is, while the sensor is stationary, hammer eight measuring points in sequence. Each hammering point is hammered four times and is averaged to avoid random errors. Due to the use of unidirectional sensors, only the flap bending mode shape of the rotor blade is measured. In the modal experiment, based on the PolyMAX algorithm in LMS Test Lab software, the modal parameters of rotor blades (natural frequency, modal damping ratio, and mode shape) can be obtained. The natural frequencies and modal damping ratios measured are presented in Tables 3 and 4, respectively. From the above experimental steps, it can be seen that EMA must have known the input (force hammer measurement excitation signal), which is almost impossible to achieve for helicopter rotor blades during flight. Moreover, the weight of rotor blade excitation equipment is often huge, which is unacceptable in modern helicopter design.
| ζ1 | ζ2 | ζ3 | ζ4 | |
|---|---|---|---|---|
| Modal experiment | 3.08 | 1.76 | 1.98 | 1.72 |
| Identification results (acceleration) | 3.37 | 1.34 | 1.96 | 1.28 |
| Identification results (strain) | 3.24 | 1.67 | 2.17 | 1.51 |
3.4. Modal Parameter Identification Experiment
Secondly, the modal parameter identification experiment of the composite rotor blade based on acceleration signals is completed. Eight ICP (integrated circuit piezoelectric) acceleration sensors are installed at the eight vibration measurement points mentioned above (Figure 5), as shown in Figure 6. The sensitivity of acceleration sensors at different vibration measurement points is shown in Table 5. The average mass of each acceleration sensor is 7 g.

| P1 | P2 | P3 | P4 | P5 | P6 | P7 | P8 | |
|---|---|---|---|---|---|---|---|---|
| Sensitivity | 10.04 | 10.28 | 9.67 | 9.67 | 9.88 | 99.90 | 100.00 | 98.70 |
The white noise signal is generated by a signal generator, amplified by a power amplifier, and transmitted to the vibration exciter. The vibration exciter is applied to the rotor blade structure to simulate the vibration of the working environment. Through LMS Test Lab software, the time-domain signals of eight acceleration sensors are recorded. Based on the theory of time-domain OMA, time-domain signals are processed to obtain modal parameters (natural frequency, modal damping ratio, and mode shape) of the rotor blade structure. The natural frequencies and modal damping ratios of the first four mode shapes of rotor blades based on acceleration signal identification are presented in Tables 3 and 4, respectively. The identified flap bending mode shapes of the rotor blade are shown in Figure 7. To verify the correctness of the modal parameter identification results, the simulation mode shape results and modal experimental measurement results are also shown in Figure 7. Due to the displacement mode of the fixed end being zero, the mode shape information of the fixed end has been added in Figure 7. It is worth noting that the simulation results selected the mode shape located on the straight line with the maximum thickness of the rotor blade (x = 0.297c).
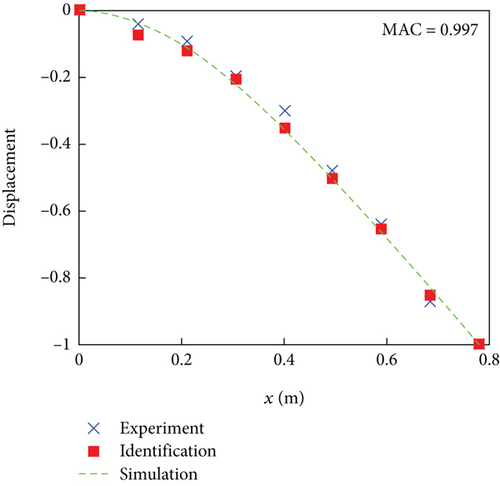
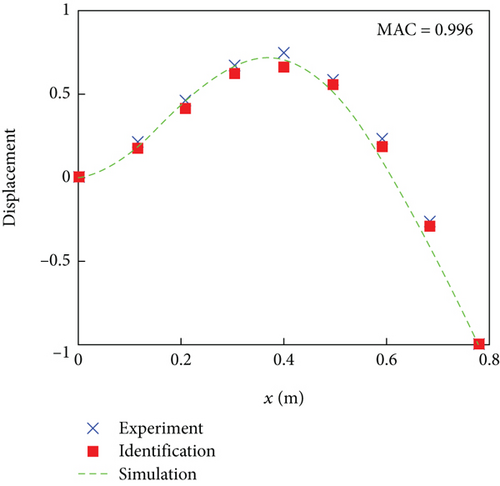
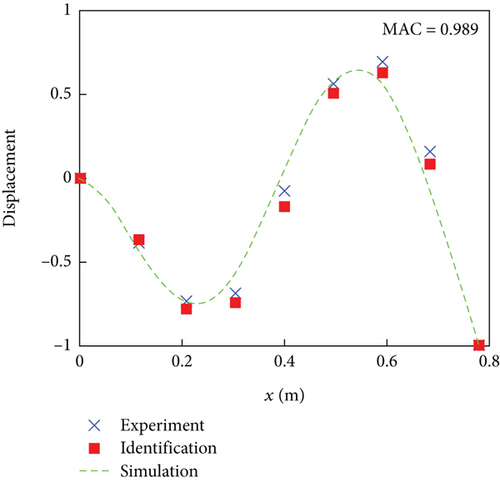
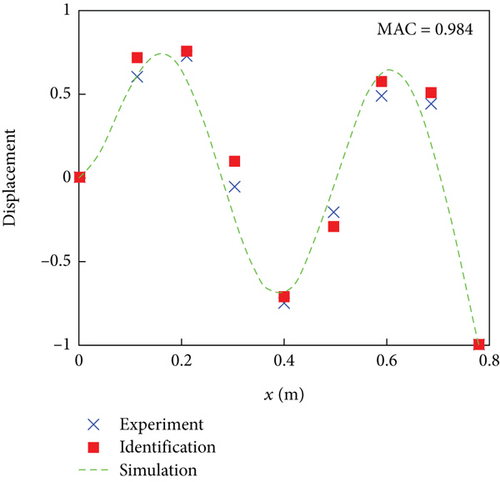
The above results prove that the OMA can complete the modal parameter identification of composite rotor blade structures based on acceleration signals. However, it cannot be ignored that the mass effect generated by too many acceleration sensors will inevitably adversely affect the modal parameter identification results. In the actual health monitoring of helicopter rotor blades, strain gauges are mainly used. Compared to acceleration sensors, strain gauges have low cost, minimal mass, and have little impact on the aerodynamic shape of the rotor blades. Therefore, to demonstrate the universality of the method, the experiment is conducted on rotor blade modal parameter identification based on strain signals. Eight strain gauges are installed at the same vibration measurement points as the above experiment, as shown in Figure 8. The sensitivity coefficient of the strain gauge is 2.1. The strain gauges adopt a quarter bridge connection. The mass of each strain gauge can be ignored.

The strain signal of rotor blade vibration is obtained using the same experimental steps as the modal parameter identification of acceleration signals. Further processing of the time-domain strain signal results in obtaining modal parameters (natural frequency, modal damping ratio, and mode shape) of the rotor blade structure. The natural frequencies and modal damping ratios based on strain signal identification are presented in Tables 3 and 4, respectively. The identified strain mode shapes are shown in Figure 9. As the correctness of the finite element model has been verified through experimental results, only the strain mode shape of the finite element simulation is provided as a comparison in the modal parameter identification results of the rotor blade based on strain signals, as shown in Figure 9.
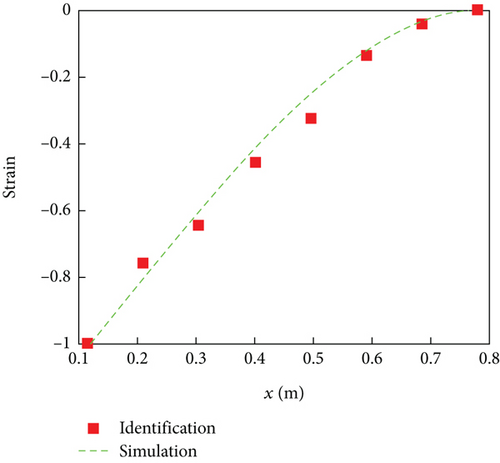
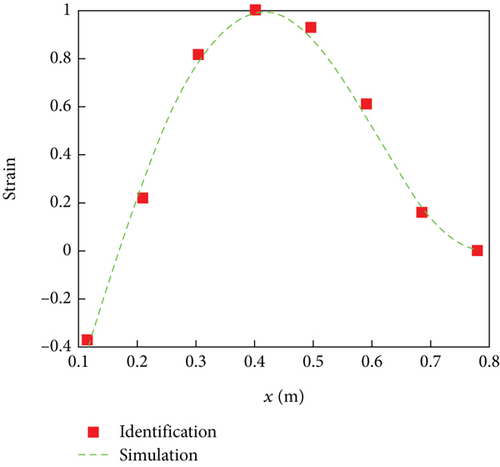
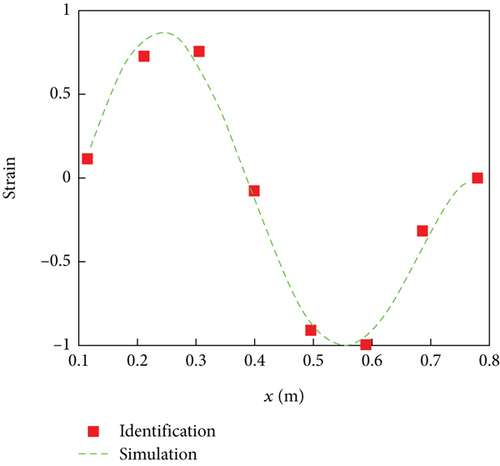
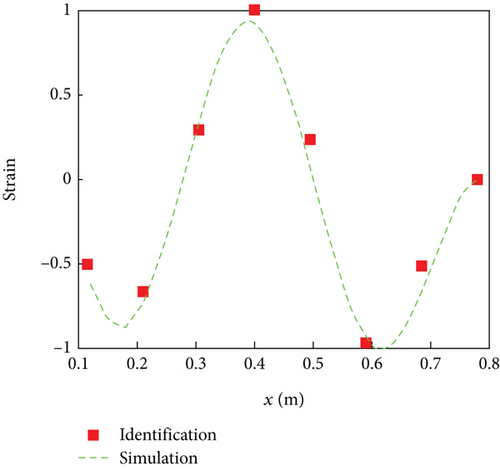
From the results in Tables 3 and 4, it can be observed that, compared to the results based on acceleration signal modal parameter identification, the results of modal parameter identification based on strain signal are more consistent with the results of modal measurement experiments. The main reason is that the mass effect generated by the strain gauge is minimal and has little impact on the modal parameter identification results. In addition, the identification results in Figure 9 are very consistent with the simulation results, which further proves the high accuracy of rotor blade modal parameter identification based on strain signals and also proves the universality of this method in rotor blade modal parameter identification.
3.5. Damage Localization of Composite Rotor Blades
In addition, a study on the damage localization of composite rotor blades is also conducted. As is well known, when there is damage or internal defects, the mass, stiffness, and damping of the structure will change, thereby changing the modal parameters (natural frequency, modal damping ratio, and mode shape). In particular, the strain mode shape is very sensitive to damage and will produce significant changes in the damaged area. The damage location is usually completed by identifying the strain mode shape of the structure. As mentioned earlier, modal parameter identification of structures based on EMA is often impossible in working conditions, especially for rotating structures such as helicopter rotor blades. Therefore, this section studies the damage localization of composite rotor blades based on OMA.
The specific approach is to identify the strain modes of undamaged and damaged composite rotor blades based on OMA and locate the damage by comparing the undamaged and damaged strain modes. Time-domain strain data are obtained through finite element simulation. As mentioned earlier, the composite rotor blades in this section have identical dimensions and materials. In finite element simulation, damage is defined by reducing the elastic modulus of materials in a particular area, which is a very common way. The area of the damaged area is 20∗20 mm, with the center located 130 mm away from the fixed end, as shown in Figure 10. The elastic modulus of the material in the damaged area decreased by 30%.
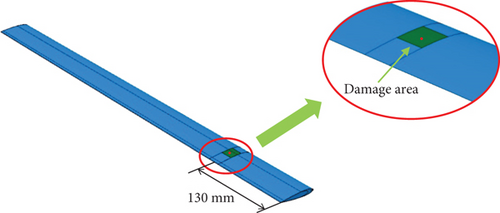
As shown in Figures 10 and 11, vibration measurement points are set up all on the straight line of the maximum thickness of the rotor blade (x = 0.297c) and are 70, 140, 210, 280, 350, 420, 490, 560, 630, and 700 away from the fixed end, respectively.

Similarly, white noise excitation is applied to the structure to simulate working conditions. Strain mode shape (first three flap bending strain mode shapes) identification is performed on damaged and undamaged composite rotor blades based on strain information from vibration measurement points, as shown in Figure 12.
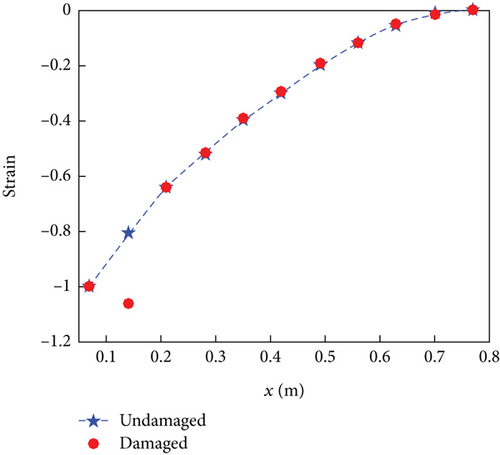
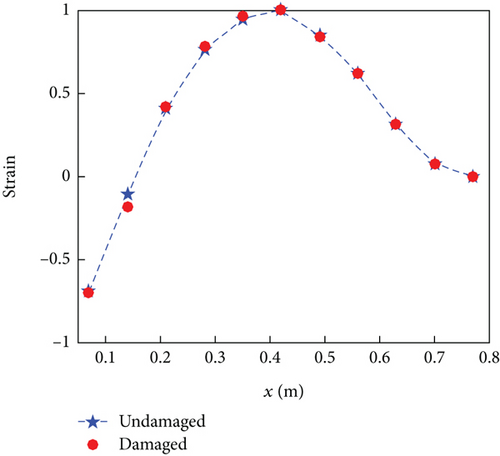
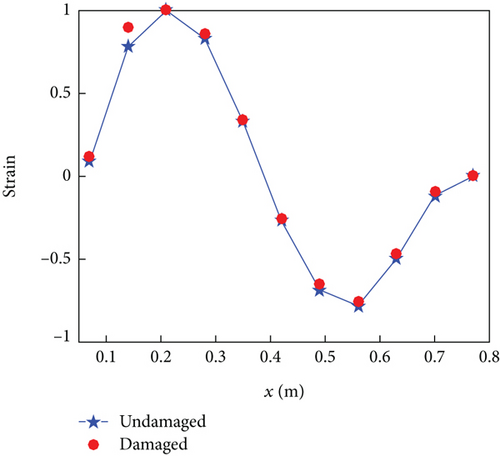
From the comparison of strain modes in Figures 12(a) and 12(c), it can be observed that at measurement point 2 (N2, 140 mm away from the fixed end), there is a significant change in the strain mode of the damaged rotor blade. In contrast, the strain modes at other positions remain unchanged. In Figure 12(b), the strain mode shape of measurement point 2 (N2) changes very little, mainly because measurement point 2 (N2) is located near the second flap bending strain mode shape node. In order to observe the change of strain mode of damaged and undamaged rotor blades more intuitively, the difference in strain mode shape at different measurement points is represented by a histogram, as shown in Figure 13.
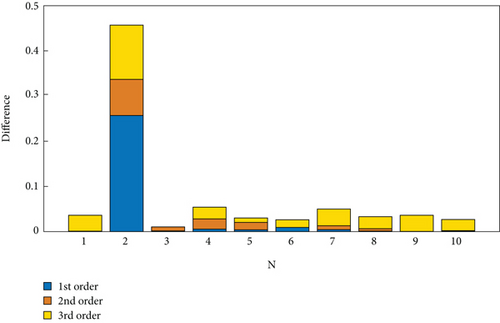
It can be easily observed from Figure 13 that there is a significant strain change at measurement point 2 (N2, 140 mm away from the fixed end), indicating the presence of damage near that location, which is very close to the predetermined location of the damaged area. Therefore, preliminary damage localization of composite rotor blades based on OMA is feasible.
4. Conclusions
- 1.
The method of measuring modal parameters based on modal experiments is unsuitable for helicopter rotor blades. The size of helicopter rotor blades is too large, making it difficult to excite the mode and obtain input forces. However, the time-domain signals generated by environmental loads (such as wind) under operating conditions are very easy to obtain. The method based on OMA can identify modal parameters from the time-domain signals.
- 2.
Based on the OMA method, modal parameter identification can be completed by utilizing the acceleration and strain signals generated by the vibration of the composite helicopter rotor blade.
- 3.
For composite helicopter rotor blades, considering factors such as cost, mass effect, and aerodynamic shape, it is more appropriate to use strain gauges to collect strain signals and complete modal parameter identification work.
- 4.
Based on OMA technology, the strain mode of damaged rotor blades is identified, and compared with the strain mode of undamaged rotor blades, it can be found that there is a sudden change in the strain mode at the damage location. Based on this, the damage localization of composite rotor blades can be achieved.
Conflicts of Interest
The authors declare no conflicts of interest.
Funding
The work described in this paper was supported by grants from the High-Level Oversea Talent Introduction Plan and Special Fund for Basic Scientific Research in Central Universities of China-Doctoral Research and Innovation Fund Project (Grant No. 3072023CFJ0206).
Acknowledgments
The work described in this paper was supported by grants from the High-Level Oversea Talent Introduction Plan and Special Fund for Basic Scientific Research in Central Universities of China-Doctoral Research and Innovation Fund Project (Grant No. 3072023CFJ0206).
Open Research
Data Availability Statement
The data used to support the findings of this study are available from the corresponding author upon request.


