

Electricity Cogeneration Potential in Minas Gerais Cement Industry with Thermodynamic Cycles
Abstract
To assess the electricity cogeneration potential in the Minas Gerais cement industry with thermodynamic cycles is the main purpose of this study. The potential was estimated based on Minas Gerais cement sector data. The Kalina cycle, the organic Rankine cycle, and the conventional Rankine cycle were technically and economically assessed. The technical evaluation considered the thermodynamic modeling with optimization including the mass, energy, entropy, and exergy balances and the heat transfer calculations for heat exchangers. The economic evaluation considered the economic modeling including the calculation of electric power generated specific cost, the total investment, cash flow, and payback. The result shows that the greatest irreversibilities are concentrated in the turbines and evaporators. The Kalina cycle confirmed more generated power and exergetic efficiency, but in terms of thermal efficiency, the values were very similar between the cycles. The three cycles can cover more than 35% of the energy demand, which means a considerable reduction in cement manufacturing costs. All cycles reveal a payback value lower than 3 years, a considerable value of cash flow, and high competitiveness in the current tariff scenario. The electricity cogeneration potential in the Minas Gerais cement industry is near 100 MW, and it is in the south-central region of Minas Gerais, where there is a greater population and energy demand concentration. This potential could save emissions of around 282,913 tCO2/year.
1. Introduction
The cement industry consumes a huge amount of thermal energy, approximately 2% of the world’s energy [1], requiring between 90 and 150 kWh of electric energy per ton of produced cement [2]. The clinker production uses 90% of the total energy consumed [3], while for the whole process, 25% of the energy demand is electrical energy and 75% is thermal energy [4]. Nevertheless, in dependence of the age of the plant and details of the process, around 40% of input energy is heat loss [5], which represents a high potential for waste heat recovery (WHR) and electricity generation via bottoming cogeneration, which could be able to decrease the electric demand of the cement plant by up to 30%, without additional fuel consumption, and to decrease the electrical energy’s expenses [6], which represent about one-quarter of the cement factory’s operational costs [7]. On the other hand, the clinker production process generates a large amount of CO2 in an approximate ratio of 0.927 tons of CO2/ton of clinker [8], which could be reduced with the implementation of the WHR electricity cogeneration system in the cement industry [9].
In the bottoming cogeneration, the primary fuel produces high-temperature thermal energy (useful heat) upstream of the power production [10]. In the cement industries, useful heat is used for clinker production, while a WHR-bottoming electricity cogeneration system (from this point onwards, only a cogeneration system or just cogeneration) is used for power production. The cogeneration system is composed of heat recovery boilers, a power turbine, a condenser, and pumps. In the boilers, the waste heat is recovered from the cement production process for heating, evaporating, and superheating the working fluid, which is used in the turbine to produce mechanical power and electricity with a coupled generator. Later, the working fluid is condensed in the condenser, which is then pumped to the boiler, restarting the cycle [4]. The Kalina cycle, the organic Rankine cycle (ORC), and the conventional Rankine cycle could be applied to the WHR electricity cogeneration system in the cement industries [4]. These cycles are very similar, differing by the working fluid that they use. The first one uses an ammonia-water mixture as a working fluid, and its utilization in the cement industry is practically unexplored; however, some researchers show that the Kalina cycle is very efficient for this application [11]. The second one uses an organic fluid as a working fluid [12], and its utilization in the cement industry is little explored, although showing a great performance for heat sources with temperatures between 80 and 400°C. The last one uses water as a working fluid, and it is widely used for WHR electricity cogeneration in the cement industry [3] given its simple and cheap technology [5]. When it comes to the cogeneration of electricity from WHR, the conventional Rankine cycle is suggested when the temperature of the heat source is above 400°C. ORC is suggested when the temperature of the heat source is less than 300°C, whereas the Kalina cycle can be used over the entire temperature range of the heat source as long as the concentration of the ammonia-water mixture and the cycle setting is properly adjusted. These cycles have been widely studied for WHR electricity cogeneration.
The two-pressure Rankine cycle showed power (5.675 MW) and exergetic efficiency (48.03%) higher than the two-pressure ORC in a cogeneration application [13]. The thermodynamic performance of three Kalina cycle configurations using ammonia-water mixture mass concentration ranging from 0.60 to 0.95 for WHR cogeneration plant using cement kiln exhaust gases showed thermal and exergetic efficiency of 22.15% and 40.35%, respectively [14]. The conventional Rankine cycle produces less CO2 (5.36 × 10⁴ ton/year), less payback (3.4 years), and saves more fuel (2.38 × 10⁷ m3/year) and money (2.1 × 10⁶ $/year) than an ORC with toluene [15]. A comparative study between the simple Rankine cycle and ORC indicated that the conventional Rankine presents a higher thermal efficiency (23.58%) and power production (6.26 MW) than the ORC (4.66 MW) [16]. In a study for WHR in the iron and steel industry, different thermal schemes of ORC and Kalina cycles were analyzed with lower product cost for the first, showing thermal efficiency ranging from 13.37 to 19.43 and 16.21 to 20.41, while exergetic efficiency reached 53.04–89.85 and 44.94–70.13 for ORC and Kalina cycles, respectively [17]. In other studies, the dual flash Rankine cycle can recover more heat and produce more electricity (9.4 MW) than the simple Rankine cycle (8.3 MW) because of its higher exergetic efficiency (41.08% vs. 36.30%) [18]. On the other hand, the simple Rankine exhibits a higher exergetic efficiency (42.1%) than the double-pressure Rankine and ORC [19]. The ORC has a higher thermal efficiency than the Rankine cycle, considering the same turbine inlet temperature when both operate coupled with low-temperature heat sources [20]. In general, the simple Rankine cycle has excellent performance at high source temperatures (>500°C) [4], suggesting the dual-flash Rankine cycle for WHR electricity cogeneration in the cement industry [21]. In cogeneration application with ORC, the largest exergetic losses are in the evaporation and condensation processes, while with simple and dual-pressure Rankine cycles, the largest exergetic losses are in the turbine expansion and condensation processes [22].
The comparative environmental impacts and emission reductions between the ORC and Kalina cycles for WHR, for a roller kiln, were completed. ORC basic, ORC regenerative, Kalina cycle 11, and Kalina cycle 34 (with ammonia-water mass concentration ranging from 0.65 to 0.85) were compared. The Kalina cycles showed better thermodynamic, economic, environmental, and water indicators than the ORCs considered [23]. An exergoeconomic comparison of WHR with thermodynamic cycles in a cement industry considers the Kalina cycle, ORC (trilateral flash), and ORC (recuperated). Several organic working fluids were studied in ORCs, and an ammonia-water mass concentration ranging from 0.70 to 0.90 was considered in the Kalina cycle. ORC showed better economic results in terms of cash flow and payback with higher generated power, while the Kalina cycle exhibits fewer irreversibilities and higher exergy efficiency [24]. The potential savings in the cement industry using WHR technologies in different Latin American countries show that although ORC and Kalina are almost mature technologies, a reduction potential of 1.8 million CO2 tons/year is possible, avoiding between 36% and 58% of the energy requirement of a cement plant [25].
The main purpose of this study is to assess the electricity cogeneration potential in the Minas Gerais cement industry with thermodynamic cycles. Data from the Apodi cement plant are used for the calculation, based on mass, energy entropy, and exergy balances, and the heat transfer calculations for heat exchangers, of cycle thermal and exergetic efficiency, electricity generation, and energy covered from waste heat recovery, as well as the calculation of electric power generated specific cost, the total investment, cash flow, and payback. The potential electricity cogeneration was estimated considering Minas Gerais cement sector data and the attained thermal efficiencies. The novelty of this original research work is related to the following points: (i) the Kalina cycle, the ORC, and the conventional Rankine cycle were studied together and on the same basis for the first time from a thermodynamic and economic point of view aiming the electricity cogeneration potential in Minas Gerais cement sector taking into account the local energy scenario and (ii) it has shown that the electricity cogeneration in Minas Gerais cement sector is promising in terms of energy covered, electricity generation potential, geographic location, economic indexes, and indirectly avoid CO2 emissions, making it unnecessary to install new thermal plants to generate electricity that, with cogeneration, is added to the grid by reducing consumption in cement plants.
2. Materials and Methods
In recent years, Brazil has been ranked among the 10 largest cement producers in the world [26]. In the country, Minas Gerais, which is the fourth largest state in land area [27] and has the second largest population [28], is the leader in cement production. Annual cement production in Minas Gerais is between 15 and 16 million tons [29]. The cement production process in Minas Gerais uses the dry path which is summarized in Figure 1. The process begins with the limestone extraction in the mine, then the crushing of raw materials, and finishes with the cement milling and storage in the cement silos.

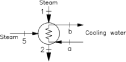
The intermediate stages of the process are interesting for this work because they are where there are points to heat recovery and, consequently, to generate electricity. The points for heat recovery are marked as A, B, and E [2]. Point B considers heat recovery from the heat transfer throughout the walls of the rotary kiln using phase change material, for example [30], and does not apply to this work. Points A and E represent the heat recovery steam generator (HRSG) for WHR and are the focus of this work aiming at electricity cogeneration. In HRSG shown in A and E, the thermal energy is recovered in the cyclone precalcination preheater exhaust gases and in hot air at the clinker grate cooler outlet, respectively.
Table 1 summarizes the data on the Minas Gerais cement sector. The data includes the name of the plant, the city where it is located, the number and type of furnaces, and the daily production capacity of each furnace. In addition, the main necessary data for the calculation of electricity generation from waste heat recovery are presented. This data includes the mass flow rate and the inlet and outlet temperatures of the HRSG. The outlet temperature of the HRSG of the cyclonic economizer is limited to 175°C by the subsequent use of the gas in the raw mill. Without heat recovery, the temperature of the gas is reduced to the values shown in Table 1. The outlet temperature of the clinker cooler HRSG is limited by the satisfactory operation of the electrostatic precipitator or bag filter (100-120°C). As can be seen in the table, there are some factories in which data for the waste heat recovery from the outlet of the clinker cooler are not shown. This is because, in these factories, the hot air at the clinker cooler outlet is injected directly into the rotary kiln. Therefore, in these factories, only the energy from exhaust gas from the cyclone preheater is available for heat recovery. That is, the focus is on those factories that have two points of thermal energy available for waste heat recovery. Cases where there is only one energy point available for waste heat recovery can be addressed with the methodologies provided in [11, 31] and will not be addressed here.
| Factory name | City | Kiln amount | Kiln type | Clinker production (t/day) | Data for energy recovery from cyclone precalcination preheater exhaust gases | Data for energy recovery from clinker grate cooler outlet | ||||
|---|---|---|---|---|---|---|---|---|---|---|
| (kg/s) | Tin (°C) | Tout (°C) | (kg/s) | Tin (°C) | Tout (°C) | |||||
| Lafarge | Montes Claros | 1 | Rotative with grate cooler | 2050 | 72.36 | 345 | 228 | 68.04 | 400 | 114 |
| Lafarge | Matozinhos | 1 | Rotative with grate cooler | 2050 | 72.36 | 345 | 228 | 68.04 | 400 | 114 |
| LIZ | Vespasiano | 1 | Rotative with grate cooler | 4600 | 84.04 | 345 | 228 | 39.83 | 400 | 114 |
| Holcim | Pedro Leopoldo | 2 | Rotative with cooling air injection | 5520 | 88.25 | 345 | 228 | — | — | — |
| Rotative with cooling air injection | 5520 | 88.25 | 345 | 228 | — | — | — | |||
| InterCement | Pedro Leopoldo | 1 | Rotative with cooling air injection | 2100 | 72.59 | 395 | 228 | — | — | — |
| Lafarge | Arcos | 1 | Rotative with grate cooler | 2050 | 72.36 | 345 | 228 | 68.04 | 400 | 114 |
| Itaú de Minas | Itaú de Minas | 3 | Rotative with cooling air injection | 1500 | 69.84 | 345 | 228 | — | — | — |
| Rotative with cooling air injection | 1550 | 70.07 | 345 | 228 | — | — | — | |||
| Rotative with grate cooler | 2800 | 75.79 | 345 | 228 | 59.74 | 400 | 114 | |||
| Tupi | Carandaí | 2 | Rotative with grate cooler | 3500 | 79.00 | 345 | 228 | 52.00 | 400 | 114 |
| 2700 | 75.34 | 345 | 228 | 60.85 | 400 | 114 | ||||
| Holcim | Barroso | 2 | Rotative with cooling air injection | 5520 | 88.25 | 345 | 228 | — | — | — |
| Rotative with cooling air injection | 5520 | 88.25 | 345 | 228 | — | — | — | |||
| InterCement | Ijaci | 1 | Rotative with grate cooler | 5500 | 88.16 | 350 | 228 | 77.00 | 440 | 114 |
| CSN | Arcos | 2 | Rotative with cooling air injection | 2500 | 74.42 | 345 | 228 | — | — | — |
| Rotative with cooling air injection | 6500 | 92.74 | 345 | 228 | — | — | — | |||
| Brennand | Sete Lagoas | 1 | Rotative with grate cooler | 3800 | 80.37 | 300 | 200 | 48.68 | 350 | 200 |
The data used for the calculation of electricity generation from waste heat recovery are shown in Table 2 and include at the inlet of the HRSGs the gas temperature, mass flow, and molar composition. This data is from the Apodi cement plant, located in Quixeré, Ceará, which is the only one with electricity cogeneration in Brazil. This plant has a daily clinker production capacity of 3500 t/day, operates for 8030 h/year, and has an annual electric energy consumption of 121 GWh/year [32].
| Parameter | Cyclone precalcination preheater exhaust gases | Clinker grate cooler outlet |
|---|---|---|
| Tin (°C) | 310.0 | 440.0 |
| (kg/s) | 88.00 | 48.10 |
| Molar composition (%-mass) | ||
| N2 | 64.58 | 79.00 |
| O2 | 4.94 | 21.00 |
| CO2 | 26.30 | — |
| H2O | 4.18 | — |
The data presented on the waste energy available for electricity generation allowed us to consider the use of Kalina, conventional Rankine, and organic Rankine cycles for waste heat recovery in this work. The description of these cycles, the thermodynamic modeling and optimization, and the cost modeling of them are presented below.
2.1. Kalina Cycle
The working fluid of the Kalina cycle is an ammonia-water mixture with variable boiling temperatures at a given pressure, which reduces the irreversibility in the HRSG during the heat transfer process. Figure 2 shows the thermal scheme of the considered Kalina cycle. The choice of this Kalina cycle configuration is based on its better thermal and economic performance [31]. The suspension preheater exhaust gas from the cement production is used to produce superheated steam via heat transfer in the HRSG with SH 1 (20→21 to 19→35), EVAP 1 (21→22 to 18→19), and ECON 1 (22→23 to 31→18). The hot air from the clinker cooler is used to produce superheated steam via heat transfer in the HRSG with SH 2 (36→37 to 33→34), EVAP 2 (37→38 to 32→33), and ECON 2 (38→39 to 30→32). The superheated steam generated in the HRSGs is expanded through the turbine (TURB) to generate mechanical power (). The steam from the turbine exhaust goes into the high-temperature regenerator (HTR), and then it is mixed with an ammonia-water-poor mixture fluid (3→4 and 13→4). This poor mixture condenses through the condenser (COND 1) (4→5). Part of the working fluid is pumped to the low-temperature regenerator (LTR) (7→8), and part is mixed with the ammonia-water-rich mixture fluid from the separator (SEP) (10→15 and 14→15). The low- and high-temperature regenerators (LTR and HTR) heat the pumped fluid before it enters the separator (SEP), in which the vapor with the rich ammonia concentration goes up to COND 2 and the fluid with the poor ammonia concentration goes down to the LTR. This ammonia-water-poor mixture fluid is expanded in the valve to mix with the turbine exhaust steam. The mixture from the SEP and pump 2 condenses through COND 2 (15→16) and is pumped to the economizers ECON 1 and ECON 2, closing the cycle.

2.2. Organic Rankine Cycle Description
In this study, a regenerative organic Rankine cycle with superheating and working under subcritical conditions was evaluated. Regenerative components were included in the simple ORC to increase the cycle’s performance. These components raise the average thermodynamic temperature of the organic fluid during the heat addition process and increase the ORC thermal efficiency. The working fluid selected for this application was the isentropic fluid R11, based on the results given by Moreira and Arrieta [12]. Figure 3 illustrates the regenerative ORC thermal scheme.

The suspension preheater exhaust gas from the cement production is used to produce saturated steam via heat transfer in the HRSG with EVAP 2 (21→22 to 11→14) and ECON (22→23 to 9→10). The hot air from the clinker cooler is used to produce superheated steam via heat transfer in the HRSG with SH (18→19 to 15→1) and EVAP 1 (19→20 to 12→13). The superheated steam generated in the HRSGs is expanded through the condensing extraction turbine (TURB) to generate mechanical power (). The extracted steam is used for regeneration in the direct contact heater (DCH) (2, 7→8) and regenerator (REG) (3→16 to 6→7). The turbine steam exhaust enters the condenser (COND) (4→5) along with the one that comes from the TRAP (16→17) for condensing to saturated liquid in 4, 17→5. At the COND outlet, the fluid is pumped for regeneration in PUMP 1 (5→6) and then pumped into the HRSG in PUMP 2 (8→9), closing the cycle.
2.3. Conventional Rankine Cycle Description
Figure 4 shows the thermal scheme of the considered conventional Rankine cycle. The suspension preheater exhaust gas from the cement production is used to produce superheated steam via heat transfer in the HRSG with SH 2 (17→12 to 15→18), EVAP 2 (12→13 to 11→15), and ECON 3 (13→16 to 0→11). The hot air from the clinker cooler is used to produce superheated steam via heat transfer in the HRSG with SH 1 (4→5 to 33→3), SH 3 (5→2 to 31→32), EVAP 1 (2→6 to 1→31), ECON 1 (6→7 to 10→1), and ECON 4 (8→28 to 25→26). The superheated steam generated in the HRSGs is expanded through the condensing extraction turbine (TURB) to generate mechanical power (). The extracted steam is used for regeneration in the DEAERATOR (30, 26→29). The turbine steam exhaust enters the condenser (COND) (19→20) for condensing to saturated liquid. At the COND outlet, the fluid is pumped for regeneration in PUMP 1 (20→25) and then pumped into the HRSGs in PUMP 2 (29→9), closing the cycle. After PUMP 2, the water is used for desuperheating in DSH (32, 35→33) and produces superheated steam in the HRSGs after SEP 1.

2.4. Thermodynamic Modeling
The thermodynamic modeling of Kalina, organic, and conventional Rankine cycles includes, for each component and the whole cycle, the mass, energy, entropy, and exergy (using the fuel () in kW and product () in kW approach [33]) balances. General considerations for the calculations are steady state, all processes are adiabatic, the variation of kinetic and potential energies is negligible, and the ideal gas behaviour is for the suspension preheater exhaust gas and the hot air from the clinker cooler. Table 3 shows the thermodynamic model for all cycles’ components in the form of generic equipment. This table also contains the generic equipment diagram for a better comprehension of the equations. The heat exchanger component represents in the Kalina cycle the SH 1, EVAP 1, ECON 1, SH 2, EVAP 2, ECON 2, HTR, and LTR; in the ORC the SH, EVAP 1, EVAP 2, ECON, and REG; and in the conventional Rankine cycle the SH 1, SH 3, EVAP 1, ECON 1, ECON 2, SH 2, EVAP 2, ECON 3, and ECON 4. The pump component represents PUMP 1 and PUMP 2 in all cycles. The separator represents SEP and SEP 1 in Kalina and conventional Rankine cycles, respectively, and it is not applicable to the ORC. Bifurcations are applicable for the ones existing in Kalina (bifurcations 6-7-14, 24-25-26, 17-30-31), ORC (10-11-12), and conventional Rankine (9-34-35) cycles. The desuperheater represents DSH in conventional Rankine cycles, and it is not applicable for ORC and Kalina cycles. Junctions are applicable for the ones existing in Kalina (junctions 13-3-4, 10-14-15, 34-35-1, and 27-28-29), ORC (13-14-15), and conventional Rankine (3-18-22) cycles. Condensers, turbines, direct contact heat, deaerators, valves, and traps are well specified in Table 3. The thermodynamic variables in Table 3 are the mass flow rate in a given state “i” () in kg/s, the specific enthalpy in a given state “i” (hi) in kJ/kg, the specific entropy in a given state “i” (si) in kJ/kg.K, the entropy generation for a given cycle component () in kW/K, the specific exergy in a given state “i” (exi) in kJ/kg, the power consumed by the pump () in kW, and the power generated in the turbine () in kW.
| Component and diagram | Mass balance | Energy balance | Entropy balance | Fuel () | Product () |
|---|---|---|---|---|---|
|
|
|
|
|
|
|
|
|
|
|
|
|
|
|
|
|
|
|
|
|
|
|
|
|
|
|
|
|
|
|
|
|
|
|
|
|
|
|
|
|
|
|
|
|
|
|
|
|
|
|
|
|
|
|
|
|
|
|
|
|
|
|
|
|
|


The adopted values for the overall heat transfer coefficient (U) shown in Table 4 for Kalina, ORC, and Rankine cycles were taken from [39] and kept fixed during the calculations. The values presented are the average values suggested in the reference mentioned in accordance with the fluid and the type of interaction presented in Table 4.
| Component | Type of interaction | Kalina cycle | ORC | Rankine cycle |
|---|---|---|---|---|
| U (kW/m2.K) | ||||
| SPH | Gas-gas | 0.2601 | 0.0800 | 0.0227 |
| ECO/EVAP | Liquid-gas | 0.1150 | 0.0900 | 0.0397 |
| REG | Liquid/gas-liquid | — | 0.4000 | — |
| HTR | Liquid-liquid | 0.9500 | — | — |
| LTR | Liquid-vapor | 1.3000 | — | — |
| COND | Liquid/gas-liquid | 1.3000 | 0.3500 | 0.7093 |
For the thermodynamic calculations, the EES (Engineering Equation Solver version V10.836-3D) was used for the Kalina cycle and ORC, while the GateCycle™ version 6.00 SP 4 was used for the conventional Rankine cycle.
2.5. Optimization
The optimization of the cycles was performed to maximize the power generated considering independent parameters presented in Table 5 based on previous studies [12, 40, 41], performed for the Kalina, organic, and Rankine cycles, respectively. These parameters are related to the mass and energy balance calculation, including the effectiveness, which is the ratio of Q/Qmax. In ECON 1 and SH 3 of the Rankine cycle, the effectiveness is used in GateCycle™ to compute the water outlet temperature. In the Kalina cycle, the steam flow produced in the HRSGs ( and ) are used as independent parameters for better numerical performance of the Kalina cycle EES model, while in the ORC and Rankine cycles, the steam flow produced in the HRSGs results as maximum as possible according to the calculation of the mass and energy balance. The additional data adopted during the calculations that are kept fixed can be inferred from the optimization results that are shown later. The optimization was performed by employing the existing genetic algorithm tool in the EES for the Kalina cycle and the ORC and using the Excel GateCycle™ supplement for the case of the Rankine cycle. The constraint variables are related to the second law of thermodynamics, specifically that the entropy generation in each component must be equal to or higher than zero.
| Kalina cycle | ORC | Rankine cycle | |||
|---|---|---|---|---|---|
| Parameter | Range value | Parameter | Range value | Parameter | Range value |
| P1 (kPa) | 3000–8300 | ΔT10 subcooling (°C) | 31-66 | P19 (kPa) | 10.6–14.6 |
| P2 (kPa) | 110-300 | ΔT19−13 (°C) | 100–200 | T3 (°C) | 437-439 |
| x_1 (-) | 0.45–0.70 | ΔT21−14 (°C) | 100–200 | T18 (°C) | 298-308 |
| ΔT20−35 (°C) | 10-40 | T1 (°C) | 200-250 | T14 (°C) | 170-178 |
| ΔT36−34 (°C) | 5–100 | — | — | ΔT13−11 (°C) | 7–13 |
| ΔT2−9 (°C) | 5-50 | — | — | ΔT12−15 (°C) | 100-120 |
| (kg/s) | 1-12 | — | — | εECON 1 (-) | 0.10–0.12 |
| (kg/s) | 1-12 | — | — | εSH 3 (-) | 0.60–0.90 |
2.6. Economic Modeling
| Parameter | Kalina cycle | ORC | Rankine cycle |
|---|---|---|---|
| Specific O&M cost (R$/kWh) | 0.072 | 0.02 | 0.072 |
| Useful life (year) | 20 | 20 | 20 |
| Operation hours per year (h/year) | 8,030 | 8,030 | 8,030 |
| Interest rate per year (%) | 7.0 | 7.0 | 7.0 |
| Cost constant (-) | 1.534 | 1.534 | 1.534 |
| Cost indices for 1998 | — | 173 | 142 |
| Cost indices for 2004 | 162 | — | — |
| Current year | 2020 | 2020 | 2020 |
| Cost indices for the year x | 121 | 121 | 100 |
| Dollar conversion rate (R$/US$) | 5.30 | 5.30 | 5.30 |
For each cycle of equipment, the cost is defined from the cost curves existing in [44, 46] in function of some parameters in dependence of the equipment. The main parameters of the turbines, heat exchangers, centrifugal pumps, cooling towers, vertical vessels, and horizontal vessels are the electric power generated, heat transfer surface area, volumetric flow, water mass flow, and total volume, respectively.
3. Results and Discussion
The results of the thermodynamic modeling presented below focus on the optimal solution obtained. Table 7 shows the values of the independent parameters for the optimal condition. In Tables 8, 9, and 10, the main thermodynamic properties in each state of the cycle are shown for the Kalina cycle, ORC, and conventional Rankine cycle, respectively. The thermodynamic properties include the mass flow, pressure, temperature, specific enthalpy, entropy, exergy, and ammonia-water mass fraction in the case of the Kalina cycle.
| Kalina cycle | ORC | Rankine cycle | |||
|---|---|---|---|---|---|
| Parameter | Optimum value | Parameter | Optimum value | Parameter | Optimum value |
| P1 (kPa) | 7214 | ΔT10 subcooling (°C) | 65.00 | P19 (kPa) | 10.6 |
| P2 (kPa) | 125.42 | ΔT19−13 (°C) | 145.00 | T3 (°C) | 437 |
| x_1 (-) | 0.522 | ΔT21−14 (°C) | 124.37 | T18 (°C) | 301 |
| ΔT20−35 (°C) | 10.82 | T1 (°C) | 239.30 | T14 (°C) | 175 |
| ΔT36−34 (°C) | 50.82 | — | — | ΔT13−11 (°C) | 10.7 |
| ΔT2−9 (°C) | 18.53 | — | — | ΔT12−15 (°C) | 115.8 |
| (kg/s) | 5.65 | — | — | εECON 1 (-) | 0.12 |
| (kg/s) | 5.20 | — | — | εSH 3 (-) | 0.90 |
| State | (kg/s) | P (kPa) | T (°C) | h (kJ/kg) | s (kJ/kg.K) | x (-) | ex (kJ/kg) |
|---|---|---|---|---|---|---|---|
| 1 | 10.85 | 7214.00 | 345.39 | 2516.14 | 6.0035 | 0.522 | 990.04 |
| 2 | 10.85 | 125.42 | 84.77 | 1855.14 | 6.3311 | 0.522 | 234.63 |
| 3 | 10.85 | 125.42 | 76.57 | 1359.19 | 4.9319 | 0.522 | 141.87 |
| 4 | 23.43 | 125.42 | 61.43 | 595.42 | 2.4979 | 0.383 | 79.43 |
| 5 | 23.43 | 125.42 | 20.00 | -134.29 | 0.1780 | 0.383 | 18.22 |
| 6 | 23.43 | 287.20 | 20.02 | -134.02 | 0.1783 | 0.383 | 18.41 |
| 7 | 15.31 | 287.20 | 20.02 | -134.02 | 0.1783 | 0.383 | 18.41 |
| 8 | 15.31 | 287.20 | 45.06 | 10.99 | 0.6480 | 0.383 | 28.07 |
| 9 | 15.31 | 287.20 | 66.24 | 362.41 | 1.7127 | 0.383 | 72.69 |
| 10 | 2.74 | 287.20 | 66.24 | 1508.41 | 5.5599 | 0.934 | 110.12 |
| 11 | 12.58 | 287.20 | 66.24 | 113.02 | 0.8755 | 0.262 | 64.54 |
| 12 | 12.58 | 287.20 | 25.05 | -63.55 | 0.3209 | 0.262 | 47.79 |
| 13 | 12.58 | 125.42 | 25.06 | -63.55 | 0.3215 | 0.262 | 47.62 |
| 14 | 8.11 | 287.20 | 20.02 | -134.02 | 0.1783 | 0.383 | 18.41 |
| 15 | 10.85 | 287.20 | 41.63 | 280.25 | 1.5524 | 0.522 | 36.74 |
| 16 | 10.85 | 287.20 | 20.00 | -149.81 | 0.1399 | 0.522 | 13.68 |
| 17 | 10.85 | 7214.00 | 21.26 | -137.77 | 0.1522 | 0.522 | 22.16 |
| 18 | 5.20 | 7214.00 | 157.55 | 523.78 | 1.9848 | 0.522 | 155.67 |
| 19 | 5.20 | 7214.00 | 242.68 | 2192.25 | 5.4309 | 0.522 | 831.13 |
| 20 | 88.00 | 101.32 | 310.00 | -3207.12 | 7.1215 | 0.000 | 96.35 |
| 21 | 88.00 | 101.32 | 300.01 | -3217.98 | 7.1027 | 0.000 | 90.90 |
| 22 | 88.00 | 101.32 | 207.82 | -3316.57 | 6.9152 | 0.000 | 46.34 |
| 23 | 88.00 | 101.32 | 170.42 | -3355.67 | 6.8306 | 0.000 | 31.63 |
| 24 | 650.01 | 250.00 | 15.00 | 63.22 | 0.2244 | 0.000 | 202.35 |
| 25 | 510.63 | 250.00 | 15.00 | 63.22 | 0.2244 | 0.000 | 202.35 |
| 26 | 139.39 | 250.00 | 15.00 | 63.22 | 0.2244 | 0.000 | 202.35 |
| 27 | 510.63 | 250.00 | 23.00 | 96.70 | 0.3390 | 0.000 | 202.80 |
| 28 | 139.39 | 250.00 | 23.00 | 96.70 | 0.3390 | 0.000 | 202.80 |
| 29 | 650.01 | 250.00 | 23.00 | 96.70 | 0.3390 | 0.000 | 202.80 |
| 30 | 5.65 | 7214.00 | 21.26 | -137.77 | 0.1522 | 0.522 | 22.16 |
| 31 | 5.20 | 7214.00 | 21.26 | -137.77 | 0.1522 | 0.522 | 22.16 |
| 32 | 5.65 | 7214.00 | 157.55 | 523.78 | 1.9848 | 0.522 | 155.67 |
| 33 | 5.65 | 7214.00 | 242.68 | 2192.25 | 5.4309 | 0.522 | 831.13 |
| 34 | 5.65 | 7214.00 | 389.18 | 2645.06 | 6.2048 | 0.522 | 1060.95 |
| 35 | 5.20 | 7214.00 | 299.18 | 2376.08 | 5.7683 | 0.522 | 917.73 |
| 36 | 48.10 | 101.32 | 440.00 | 432.73 | 7.7891 | 0.000 | 172.26 |
| 37 | 48.10 | 101.32 | 390.78 | 379.55 | 7.7118 | 0.000 | 141.34 |
| 38 | 48.10 | 101.32 | 204.97 | 183.56 | 7.3657 | 0.000 | 45.08 |
| 39 | 48.10 | 101.32 | 129.38 | 105.85 | 7.1888 | 0.000 | 18.35 |
| State | (kg/s) | P (kPa) | T (°C) | h (kJ/kg) | s (kJ/kg.K) | ex (kJ/kg) |
|---|---|---|---|---|---|---|
| 1 | 97.23 | 3674.00 | 239.30 | 346.26 | 0.9048 | 90.59 |
| 2 | 7.22 | 950.38 | 170.43 | 318.88 | 0.9158 | 60.05 |
| 3 | 24.17 | 399.28 | 136.56 | 301.33 | 0.9234 | 40.30 |
| 4 | 65.84 | 117.13 | 94.98 | 277.87 | 0.9348 | 13.57 |
| 5 | 90.01 | 117.13 | 28.00 | 58.21 | 0.2187 | 0.26 |
| 6 | 90.01 | 950.38 | 29.11 | 59.18 | 0.2219 | 0.30 |
| 7 | 90.01 | 950.38 | 91.06 | 114.61 | 0.3874 | 8.05 |
| 8 | 97.23 | 950.38 | 107.16 | 129.78 | 0.4275 | 11.65 |
| 9 | 97.23 | 3764.00 | 112.24 | 134.67 | 0.4401 | 12.92 |
| 10 | 97.23 | 3764.00 | 120.36 | 144.67 | 0.4602 | 17.12 |
| 11 | 26.38 | 3764.00 | 120.36 | 144.67 | 0.4602 | 17.12 |
| 12 | 70.85 | 3764.00 | 120.36 | 144.67 | 0.4602 | 17.12 |
| 13 | 70.85 | 3764.00 | 185.36 | 287.95 | 0.7839 | 67.13 |
| 14 | 26.38 | 3764.00 | 185.36 | 287.95 | 0.7839 | 67.13 |
| 15 | 97.23 | 3764.00 | 185.36 | 287.95 | 0.7839 | 67.13 |
| 16 | 24.17 | 399.28 | 69.44 | 94.87 | 0.3321 | 4.24 |
| 17 | 24.17 | 117.13 | 28.00 | 94.87 | 0.3404 | 1.84 |
| 18 | 48.15 | 101.35 | 440.00 | 432.73 | 7.7890 | 172.26 |
| 19 | 48.15 | 101.35 | 330.36 | 315.00 | 7.6097 | 106.18 |
| 20 | 48.15 | 101.35 | 127.73 | 104.17 | 7.1845 | 17.88 |
| 21 | 88.03 | 101.35 | 310.00 | -3254.42 | 7.1196 | 96.41 |
| 22 | 88.03 | 101.35 | 270.36 | -3297.36 | 7.0434 | 75.45 |
| 23 | 88.03 | 101.35 | 260.09 | -3308.39 | 7.0228 | 70.32 |
| 24 | 733.32 | 101.35 | 15.00 | 63.08 | 0.2244 | 3.46 |
| 25 | 733.32 | 101.35 | 20.00 | 84.01 | 0.2965 | 3.64 |
| State | (kg/s) | P (MPa) | T (°C) | h (kJ/kg) | s (kJ/kg.K) | ex (kJ/kg) |
|---|---|---|---|---|---|---|
| 0 | 4.86 | 1000.00 | 175.00 | 741.10 | 2.0900 | 140.30 |
| 1 | 4.84 | 1000.00 | 176.80 | 749.10 | 2.1080 | 143.20 |
| 2 | 48.10 | 101.30 | 386.50 | 386.30 | 0.8570 | 139.20 |
| 3 | 4.85 | 1000.0 | 437.00 | 3343.00 | 7.5790 | 1160.00 |
| 4 | 48.10 | 101.32 | 440.00 | 444.00 | 0.9420 | 172.00 |
| 5 | 48.10 | 101.32 | 433.60 | 437.10 | 0.9320 | 168.00 |
| 6 | 48.10 | 101.32 | 189.90 | 178.70 | 0.4840 | 39.20 |
| 7 | 48.10 | 101.32 | 189.10 | 177.90 | 0.4830 | 38.90 |
| 8 | 48.10 | 101.32 | 127.30 | 114.20 | 0.3340 | 17.80 |
| 9 | 9.71 | 1000.0 | 102.50 | 430.40 | 1.3350 | 47.40 |
| 10 | 4.85 | 1000.0 | 175.00 | 741.30 | 2.0910 | 140.00 |
| 11 | 4.86 | 1000.0 | 179.20 | 759.60 | 2.1320 | 147.00 |
| 12 | 88.00 | 101.32 | 295.70 | 3318.00 | 0.6980 | 88.60 |
| 13 | 88.00 | 101.32 | 189.90 | 3431.00 | 0.4790 | 39.00 |
| 14 | 9.71 | 1000.00 | 175.00 | 741.30 | 2.0910 | 140.40 |
| 15 | 4.86 | 1000.00 | 179.90 | 2778.00 | 6.5860 | 881.60 |
| 16 | 88.00 | 101.32 | 188.90 | 3432.00 | 0.4770 | 38.65 |
| 17 | 88.00 | 101.32 | 310.00 | 3303.00 | 0.7250 | 96.39 |
| 18 | 4.86 | 1000.00 | 301.00 | 3053.00 | 7.1260 | 1001.00 |
| 19 | 9.63 | 10.60 | 46.98 | 2586.00 | 8.1280 | 245.40 |
| 20 | 9.63 | 10.60 | 46.98 | 196.60 | 0.6640 | 6.81 |
| 21 | 480.70 | 250.00 | 16.41 | 69.05 | 0.2450 | 0.16 |
| 22 | 9.711 | 1000.00 | 368.90 | 3197.00 | 7.3640 | 1077.00 |
| 23 | 480.70 | 101.32 | 16.40 | 68.87 | 0.2450 | 0.01 |
| 24 | 480.70 | 250.00 | 27.52 | 115.50 | 0.4020 | 1.25 |
| 25 | 9.63 | 250.00 | 47.00 | 197.00 | 0.6650 | 7.07 |
| 26 | 9.63 | 250.00 | 97.43 | 408.30 | 1.2780 | 41.7 |
| 27 | 9.63 | 250.00 | 97.43 | 408.03 | 1.2780 | 41.7 |
| 28 | 48.10 | 101.32 | 85.25 | 71.20 | 0.2210 | 7.50 |
| 29 | 9.71 | 250.00 | 102.40 | 429.40 | 1.3340 | 46.59 |
| 30 | 0.08 | 250.00 | 240.90 | 2950.00 | 7.5670 | 771.60 |
| 31 | 4.85 | 1000.00 | 179.90 | 2778.00 | 6.5860 | 881.60 |
| 32 | 4.85 | 1000.00 | 404.90 | 3274.00 | 7.4800 | 1120.00 |
| 33 | 4.85 | 1000.00 | 404.90 | 3274.00 | 7.4800 | 1120.00 |
| 34 | 9.71 | 1000.00 | 102.50 | 430.40 | 1.3350 | 47.41 |
| 35 | 0.00 | 1000.00 | 102.50 | 430.40 | 1.3350 | 47.41 |
Table 7 for the Kalina cycle shows that, in general, the optimal values of the independent parameters are located near the center of the studied range. This is explained by the fact that to maximize the generated power, the maximum steam generation is sought with a combination of temperature and pressure values at the turbine inlet that maximizes the enthalpy at the turbine inlet and the ammonia-water fraction to optimize the steam generation in the HRSGs. In the case of ORC, subcooling in ECON tended to the maximum value to maintain a gas outlet temperature in the state “23” of the order and 228°C, in accordance with Table 1. In the remaining parameters, the tendency was a value below the average value to maximize the steam generation in the HRSGs. In the conventional Rankine cycle, the optimization tended to bring most of the independent parameters to their extreme values in the range evaluated to maximize the power generated. Thus, the pressure at the outlet of the turbine adopted the minimum value, increasing the enthalpic variation in the turbine, and the temperature of the generated steam in the HRSG tended to have minimum values to increase the amount of generated steam. The approach temperatures in EVAP 2 and ECON 3 take mean values in the range to maintain a high steam generation without further increasing the heat transfer surface area in these equipment. The effectiveness of ECON and SH 3 is maximized to increase steam generation.
A summary of the exergetic analysis results is shown in Table 11. In this table, the fuel (), product (), irreversibility (), and exergetic efficiency (ηex) are presented for each equipment of the cycle and the whole cycle. The irreversibility of the cycle includes the ones of the equipment plus the exergy dissipation in the condenser, which is the product of the condenser. This result must be explained together with Figure 5, in which the entropy—temperature diagram is shown and indicates the main irreversibilities by equipment, in percentage, in the considered cycles. As can be inferred from Table 11 and Figure 5, in equipment where there is more fuel, there is also more irreversibility. The turbines COND 1, EVAP 1 and 2, ECON 1 and 2, and TURB are where the greatest irreversibilities in the Kalina cycle are concentrated. In the SH, COND, EVAP 1 and 2, and TURB are where the greatest irreversibilities in the ORC are concentrated. In the conventional Rankine cycle, the greatest irreversibilities are concentrated in the COND, TURB, and EVAP 1 and 2. It is remarkable that if we sum the irreversibilities of evaporators, they are higher than the turbine ones, as reported in similar studies [2, 3, 6, 16]. In the turbines, the irreversibility is given by the efficiency of the expansion process. In the other equipment mentioned, which are heat exchangers, the irreversibility is due to the temperature differences existing in the heat transfer processes. The higher temperature differences in heat transfer processes are remarkable in ORC, if compared with the other cycles, given the low operation temperature of the organic fluid with respect to cement process gas temperature. This fact is compensated with a high flow rate of the working fluid, considering that the objective function aims to maximize the power generated. If the mass flow rate at the turbine inlet is considered, the ORC presents a working fluid mass flow rate greater than that of the Kalina and Rankine cycles, and between them, the flow value is of the same order, which is to be expected because both cycles operate at similar temperatures. In this equipment, the design, selection, operation, and maintenance should be focused on maintaining the efficiency of electricity cogeneration in the cement sector at the highest possible level. In terms of exergy efficiency, the Kalina cycle and ORC show the highest value, followed by the conventional Rankine. Despite a very similar cycle exergy efficiency value, the Kalina cycle extracts more exergy than the ORC from the cement process gas (note that the fuel in the Kalina cycle is greater than that of the ORC) and generates more power, which is explained by the particularity of the ammonia-water mixture of changing phase at variable temperature (as can be seen in the entropy—temperature diagram), causing a uniform temperature profile in the heat transfer process, reducing the irreversibility of the evaporators and condenser, as shown in Figure 5. Note in this figure that in the Kalina cycle, the irreversibility in these devices has a lower percentage weight than in the other cycles.
| Kalina cycle results | ORC results | Rankine cycle results | ||||||||||||
|---|---|---|---|---|---|---|---|---|---|---|---|---|---|---|
| Equipment | (kW( | (kW) | (kW) | ηex | Equipment | (kW) | (kW) | (kW) | ηex | Equipment | (kW) | (kW) | (kW) | ηex |
| TURB | 8196.20 | 7171.92 | 1024.28 | 0.875 | TURB | 6506.89 | 5786.83 | 720.06 | 0.889 | TURB | 8036.66 | 6280.19 | 1756.48 | 0.781 |
| SH 1 | 479.34 | 450.34 | 28.99 | 0.940 | SH | 3182.16 | 2281.15 | 901.02 | 0.717 | SH 1 | 198.73 | 194.22 | 4.51 | 0.977 |
| EVAP 1 | 3921.35 | 3512.37 | 408.98 | 0.896 | EVAP 1 | 4251.9 | 3543.26 | 708.63 | 0.833 | SH 3 | 1412.97 | 1160.08 | 252.89 | 0.821 |
| ECON 1 | 1294.29 | 694.27 | 600.02 | 0.536 | EVAP 2 | 1845.16 | 1319.24 | 525.92 | 0.715 | EVAP 1 | 4810.16 | 3579.07 | 1231.09 | 0.744 |
| SH 2 | 1487.00 | 1298.49 | 188.51 | 0.873 | ECON | 451.44 | 408.47 | 42.98 | 0.905 | ECON 1 | 14.52 | 13.65 | 0.87 | 0.940 |
| EVAP 2 | 4630.32 | 3816.32 | 813.99 | 0.824 | DCH | 349.53 | 323.7 | 25.83 | 0.926 | ECON 2 | 1015.32 | 902.00 | 113.32 | 0.888 |
| ECO2 | 1285.59 | 754.35 | 531.24 | 0.587 | REG | 871.48 | 697.33 | 174.15 | 0.800 | SH 2 | 683.80 | 583.93 | 99.87 | 0.854 |
| SEP | 1113.03 | 1113.03 | 0.00 | 1.000 | COND | 915.07 | 131.62 | 783.45 | 0.144 | EVAP 2 | 4362.56 | 3570.28 | 792.28 | 0.818 |
| HTR | 1006.51 | 683.22 | 323.29 | 0.679 | PUMP 1 | 87.28 | 4.19 | 83.09 | 0.048 | ECON 3 | 34.15 | 32.14 | 2.01 | 0.941 |
| LTR | 210.68 | 147.86 | 62.82 | 0.702 | PUMP 2 | 475.49 | 123.69 | 351.79 | 0.260 | ECON 4 | 495.46 | 334.46 | 161.01 | 0.675 |
| COND 1 | 1433.86 | 232.93 | 1200.93 | 0.162 | TRAP | 102.52 | 44.48 | 58.05 | 0.434 | SEP 1 | 1362.45 | 1362.45 | 0.00 | 1.000 |
| COND 2 | 250.20 | 63.58 | 186.61 | 0.254 | Bifurcation 10-11-12 | 1664.68 | 1664.68 | 0.00 | 1.000 | DEAERATOR | 58.73 | 46.20 | 12.53 | 0.787 |
| PUMP 1 | 130.59 | 92.04 | 38.55 | 0.705 | Junction 13-14-15 | 6527.18 | 6527.18 | 0.00 | 1.000 | COND | 2296.69 | 524.54 | 1772.14 | 0.228 |
| PUMP 2 | 6.23 | 4.42 | 1.80 | 0.711 | ORC plant | 9730.66 | 5224.07 | 4506.6 | 0.537 | PUMP 1 | 2.74 | 2.50 | 0.24 | 0.911 |
| Valve | 600.98 | 598.81 | 2.17 | 0.996 | — | — | — | — | — | PUMP 2 | 8.96 | 7.96 | 1.00 | 0.889 |
| Junction 3-13-4 | 2138.04 | 1860.77 | 277.27 | 0.870 | — | — | — | — | — | DSH | 5433.11 | 5433.11 | 0.00 | 1.000 |
| Bifurcation 6-7-14 | 431.34 | 431.34 | 0.00 | 1.000 | — | — | — | — | — | Junction 3-18-22 | 10495.82 | 10461.42 | 34.40 | 0.997 |
| Junction 10-14-15 | 450.76 | 398.59 | 52.17 | 0.884 | — | — | — | — | — | Bifurcation 9-34-35 | 460.45 | 460.45 | 0.00 | 1.000 |
| Junction 34-35-1 | 10766.58 | 10741.94 | 24.64 | 0.998 | — | — | — | — | — | Rankine Plant | 13027.66 | 6280.19 | 6747.47 | 0.482 |
| Bifurcation 17-30-31 | 240.43 | 240.43 | 0.00 | 1.000 | — | — | — | — | — | — | — | — | — | — |
| Kalina plant | 13097.89 | 7035.10 | 6062.79 | 0.537 | — | — | — | — | — | — | — | — | — | — |


In Figure 6, the generated power, thermal efficiency, and exergetic efficiency are presented for the studied cycles at the optimum condition. The results are ordered by the function of the generated power presented in bar. The exergy efficiency is presented in dashed lines, and the thermal efficiency is in a continuous line. The highest value of generated power is observed in the Kalina cycle which can be explained by fewer irreversibilities and the high exergy absorption from the cement suspension preheater exhaust gas and the hot air clinker cooler in this cycle if compared to the other ones. As a means of validation, the thermal efficiency values are similar, or in the same range, to those found in other works [14] or [16], which show 23.58% for a conventional Rankine cycle, for example. An analogous fact is also applied to the exergy efficiency values [13, 17], or in other works. For example, in [12], the exergetic efficiency ranges from 35.7% to 52% in dependence on the ORC thermal scheme configuration and the operational parameter; in [2], the exergetic efficiency ranges from 50% to 60% as a function of the maximum pressure; in [3], it could reach 44%-60% in dependence of the evaporator pinch point; in [6], the conventional Rankine cycle exhibits 24.18% or 51.39% for thermal and exergetic efficiency, respectively. Note that in Table 11, the fuel () of the Kalina cycle has the highest value. In terms of thermal efficiency, the values are very similar, with the highest value for ORC explained by the lower heat input into the cycle. In terms of exergetic efficiency, the highest value for the Kalina cycle is explained by the higher power generated and the lower relative irreversibilities of the cycle if compared with the other ones.

In Figure 7, the annually energy generated and the covered energy demand are presented for the studied cycles at the optimum condition. The results are ordered by the function of the annually energy generated presented in bar. The covered energy demand is presented in a continuous line. According to equation (7), annually energy generated for a fixed value of annual operation hours depends on the net power generated. This way, the Kalina cycle generates more energy annually than the other cycles. Considering the fixed value of 121 GWh of annual electric energy consumption of the Apodi plant, the Kalina cycle, as it annually generates more energy, will provide a greater covered energy demand than the other cycles studied. In any case, it is important to highlight that with the implementation of electricity cogeneration in the cement sector, the covered annual electric energy demand can be higher than 35%, which means a considerable reduction in cement manufacturing costs and electric energy consumption. With the reduction in electricity consumption at the cement plant, more electricity is available on the grid for other consumers and final use, avoiding the installation of new thermal power plants, which gives an environmental footprint to cogeneration in the cement sector.

In Figure 8, a summary of the economic results is presented for the studied cycles at the optimum condition. The total investment is presented in a black bar, while the payback is presented in a solid line bar, both could be read on the left axes. The cash flow is presented in a continuous line, while the electricity generation cost is presented in dashed lines, both could be read on the right axes.


According to Figure 8, the implementation of the Kalina cycle costs R$ 69.80 million for a power generation of 7.04 MW (Figure 6), and an annually energy generation of 56.53 GWh able to cover 47% (Figure 7) of the considered 121 GWh energy demand. The cash flow determined with equation (20), shown in Figure 8, results in R$25.4 million, with which it is possible to achieve a payback of 2.74 years. The cogeneration electricity generation cost of 222.7 R$/MWh is very competitive in the existing electricity tariff scenario (430.74 R$/MWh).
In Figure 8, the implementation of a conventional Rankine cycle costs R$42.20 million with 6.28 MW of power generation (Figure 6) and 50.43 GWh of annually energy generation which is able to cover 42% (Figure 7) of the considered 121 GWh energy demand. For this cycle, the cash flow shown in Figure 8 is R$21.7 million which results in 1.94 years of payback. In the existing electricity tariff scenario (430.74 R$/MWh), the cogeneration electricity generation cost of 150.9 R$/MWh is highly attractive.
With the costs of R$ 34.00 for the implementation of ORC (Figure 8), it is possible to obtain 5.22 MW of power generation (Figure 6) with an annually energy generation of 41.19 GWh able to cover 35% (Figure 7) of the considered 121 GWh energy demand. With a cash flow of R$18.8 million, it is possible to achieve 1.88 years of payback. The cogeneration electricity generation cost of 222.7 R$/MWh is extremely competitive in the considered electricity tariff scenario (430.74 R$/MWh).
By way of comparison, it can be said that the Kalina cycle has a better thermodynamic performance than the other studied cycles. This is due to the higher power generated and exergy efficiency, while the energy efficiency presents very similar values between the cycles studied. In economic terms, the Kalina cycle requires the largest investment and the ORC the lowest, so in this respect, the ORC is the most attractive of the cycles. In terms of payback, it can be said that all cycles are very interesting because none exceed 3 years. From a cash flow point of view, the Kalina cycle is by far the most attractive because, after 2.74 years, it will have the greatest annual savings. Although the Kalina cycle has the highest cost of electricity generation and the conventional Rankine the lowest, it can be said that the three cycles studied are competitive in the current tariff scenario. In view of the above, it can be concluded that although all cycles are interesting for the cogeneration of electricity in the cement sector, the Kalina cycle has a better thermodynamic and suitable economic performance in terms of cash flow, payback, and electricity generation cost, which makes it promising for this purpose.
Based on the performance of the Kalina cycle, Table 12 and Figure 9 present the estimated potential for electricity cogeneration in Minas Gerais and its geographic distribution, respectively. To arrive at these results, the information in Table 1 is considered, specifically the mass flow values and the Tin and Tout temperatures of the two energy sources for waste heat recovery considered in this study. Based on this information, a for the cogeneration plant is estimated using a specific heat for the hot air from the clinker cooler and suspension preheater exhaust gas of 1.07 and 1.04 kJ/kg.K, respectively. Specific heat values were estimated using REFPROP with the molar composition presented in Table 2 and an average temperature of 257°C. Then, the value of the thermal efficiency of the Kalina cycle shown in Figure 6 is applied in equation (5) to obtain the potential estimation of power generated in each of the cement plants.
| Factory name | City | Clinker production (t/day) | Electricity cogeneration potential (MW) |
|---|---|---|---|
| Lafarge | Montes Claros | 2050 | 7.80 |
| Lafarge | Matozinhos | 2050 | 7.80 |
| LIZ | Vespasiano | 4600 | 6.21 |
| Holcim | P. Leopoldo | 5520 | 3.51 |
| 5520 | 3.51 | ||
| InterCement | P. Leopoldo | 2100 | 3.85 |
| Lafarge | Arcos | 2050 | 7.80 |
| Itaú de Minas | Itaú de Minas | 1500 | 2.78 |
| 1550 | 2.79 | ||
| 2800 | 7.33 | ||
| Tupi | Carandaí | 3500 | 6.90 |
| 2700 | 7.40 | ||
| Holcim | Barroso | 5520 | 3.51 |
| 5520 | 3.51 | ||
| InterCement | Ijaci | 5500 | 10.10 |
| CSN | Arcos | 2500 | 2.96 |
| 6500 | 3.69 | ||
| Brennand | S. Lagoas | 3800 | 5.14 |
| Total | 96.61 | ||

As can be seen in Table 12, lower values of power generated are found in cement plants with rotative kilns with cooling air injection, while higher values are found in rotative kilns with grate coolers. This is explained by the fact that in plants with rotative kilns with cooling air injection, less waste heat is available for electricity cogeneration. In any case, the power-generating potential in Minas Gerais using cogeneration from waste heat is remarkable and close to 100 MW. This electricity generation potential, in addition to resulting in considerable energy savings in the cement manufacturing process and therefore reducing the cement production cost, can reduce CO2 emissions in Minas Gerais. Considering an electricity generation potential of ~96 MW, an emission factor of 0.367 tCO2/MWh [48], and 8030 h/year of operation, can be avoided 282,913 tCO2/year with the installation of new natural gas-fired combined-cycle thermal power plants.
Figure 9 shows the electricity cogeneration potential distribution in Minas Gerais. As can be seen, the potential of electricity cogeneration from waste heat in the cement sector of Minas Gerais is concentrated in the south-central region of Minas Gerais, which is precisely where there is a greater population concentration and greater energy demand, which is also interesting to reduce electrical problems in the network and improve the energy quality.
4. Conclusions
- (i)
in general, for all cycles studied, the turbines and evaporators are where the greatest irreversibilities are concentrated. Despite a very similar cycle exergy efficiency value in the ORC and Kalina cycles, the last one generates more power between the studied cycles. In terms of thermal efficiency, the values are very similar, with the highest value for ORC
- (ii)
the Kalina cycle generates more energy annually, but all cycles can cover more than 35% of the energy demand which means a considerable reduction in cement manufacturing costs
- (iii)
all cycles are interesting for the cogeneration of electricity in the cement sector given the payback value lower than 3 years, the considerable value of cash flow, and the high competitiveness of the current tariff scenario
- (iv)
the electricity cogeneration potential in the Minas Gerais cement industry is remarkable, ~96 MW, and could save emissions of around 282,913 tCO2/year. Fortunately, the potential is concentrated in the south-central region of Minas Gerais, where there is a greater population and energy demand concentration
Nomenclature
-
- COND:
-
- Condenser
-
- DCH:
-
- Direct contact heater
-
- DSH:
-
- Desuperheater
-
- ECON:
-
- Economizer
-
- EES:
-
- Engineering equation solver
-
- EVAP:
-
- Evaporator
-
- HRSG:
-
- Heat recovery steam generator
-
- HTR:
-
- High temperature recuperator
-
- LMTD:
-
- Logarithmic mean temperature difference
-
- LTR:
-
- Low temperature recuperator
-
- ORC:
-
- Organic Rankine cycle
-
- PUMP:
-
- Pump
-
- R$:
-
- Brazilian reais
-
- REG:
-
- Regenerator
-
- SEP:
-
- Separator
-
- SH:
-
- Superheater
-
- TURB:
-
- Turbine
-
- US$:
-
- United States dollar
-
- WHR:
-
- Waste heat recovery.
Latin Symbols
-
- :
-
- Fuel (kW)
-
- :
-
- Product (kW)
-
- :
-
- Heat rate (kW)
-
- :
-
- Power (kW)
-
- :
-
- Mass flow (kg/s)
-
- h:
-
- Specific enthalpy (kJ/kg)
-
- U:
-
- Heat transfer global coefficient (kW/m2.K)
-
- A:
-
- Heat transfer surface area (m2)
-
- AEG:
-
- Annually energy generated (GWh/year)
-
- AF:
-
- Capitalization factor (1/year)
-
- C:
-
- Cost (R$ or R$/kWh)
-
- CAB:
-
- Dimensional auxiliary buildings cost factor
-
- CC:
-
- Dimensional contingency cost factor
-
- CED:
-
- Covered energy demand (%)
-
- CF:
-
- Cash flow (R$/year)
-
- FCF:
-
- Dimensional fees cost factor
-
- CI:
-
- Cost index
-
- COS:
-
- Dimensional off-site facilities cost factor
-
- CSD:
-
- Dimensional site development cost factor
-
- E:
-
- Estimated cost (R$)
-
- Et:
-
- Electricity tariff (R$/MWh)
-
- HO:
-
- Operation hours (h/year)
-
- P:
-
- Pressure (kPa)
-
- PB:
-
- Payback (year)
-
- T:
-
- Temperature (K or °C)
-
- Tx:
-
- Reais to US dollar exchange rate (R$/US$)
-
- ex:
-
- Specific exergy (kJ/kg)
-
- i:
-
- Interest rate
-
- n:
-
- Useful life (year)
-
- q:
-
- Steam quality
-
- s:
-
- Specific entropy (kJ/kg.K)
-
- x:
-
- Ammonia mass fraction.
Greek Letters
-
- :
-
- Entropy generation rate (kW/K)
-
- Δ:
-
- Difference
-
- ε:
-
- Effectiveness
-
- η:
-
- Efficiency.
Subscripts
-
- 0:
-
- Reference state
-
- 1, 2, …, 20:
-
- States in the thermal schematics of cycle
-
- 1998:
-
- 1998 year
-
- C, x:
-
- Cost in year x
-
- ch:
-
- Chemical
-
- EX:
-
- Exergetic
-
- g:
-
- Gas or generation
-
- ger:
-
- Generated
-
- i:
-
- State
-
- in:
-
- Inlet
-
- inv:
-
- Total investment
-
- l:
-
- Liquid
-
- lm:
-
- Logarithmic mean temperature difference
-
- n:
-
- Period numbers
-
- O&M:
-
- Operation and maintenance
-
- out:
-
- Outlet
-
- p:
-
- Pump
-
- TH:
-
- Thermal
-
- turb:
-
- Turbine
-
- x:
-
- Year x.
Conflicts of Interest
The authors declare that they have no conflicts of interest.
Acknowledgments
The authors thank FAPEMIG, FAPEMIG/CEMIG APQ-03422-12 research project, ANNEL Research and Developed Program (P&D) research project GT0554, CAPES—Financing Code 001 and CAPES grant PROAP 88881.888660/2023-01 and CNPq310727/2023-5 research project, and Pontifical Catholic University of Minas Gerais—PUC Minas for the financial support to this work. The authors wish to thank Mr. Colm Patrick Donnellan M.A. B.Ed. C.C.R.S. for the English review.
Open Research
Data Availability
The calculation data used to support the findings of this study are included within the article.

